This Indicator Says That Santa Claus May Arrive Just in Time
Let's do a dive on Nasdaq's trading volume and price momentum to see when we might hit oversold.
You've reached your free article limit
You've read 0 of 1 free Pro articles.
Let’s talk about Nasdaq. And the volume.
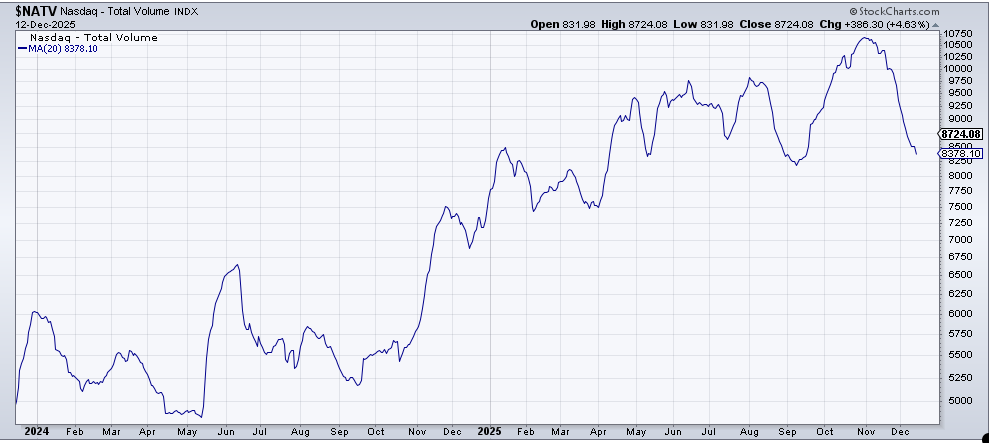
Remember back in September when every speculative stock was flying high, and penny stocks were all the rage? Nasdaq’s volume was regularly clocking in at nearly or over ten billion shares a day.
Here is the chart of the twenty-day moving average of Nasdaq volume. You can see the surge from 8.2 billion shares (average) in early September to over 10 billion shares in early November. But now look at what’s happened to volume in the last six weeks: relentlessly to the downside. Nasdaq’s average volume over the last twenty trading days is back to where it was after the August doldrums.
So naturally, Nasdaq is looking to start trading 24/7! I can’t help but wonder if this is the equivalent of the NYSE announcing they would be adding on a new room for floor trading in the summer of 1987. Timing is always interesting.
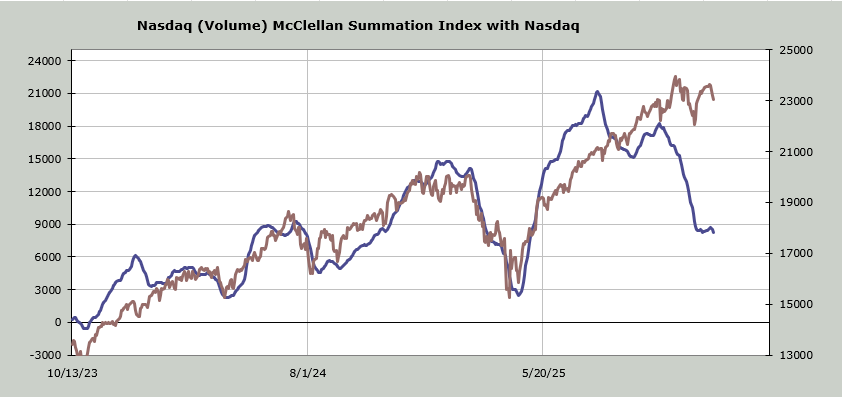
Sticking with Nasdaq, where I use volume inputs to calculate the McClellan Summation Index, notice how this rally off the Thanksgiving low barely registered on the indicator, and now it is heading down again.
It now requires a net differential of +6.6 billion shares (that’s up minus down volume) to halt the decline. If the average daily volume for Nasdaq is currently 8.2 billion shares, you can understand that Nasdaq needs one heckuva up day to halt the decline or several mediocre days. If this gets to the point where it needs +10 billion shares or more to halt the decline, then I’d consider Nasdaq oversold. At the Thanksgiving low, it needed +11 billion shares, which made it oversold.
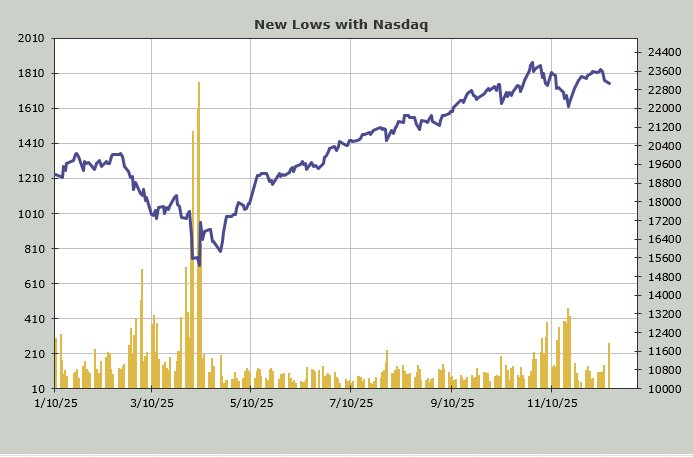
Still sticking with Nasdaq, the number of stocks making new lows nearly (not quite) doubled between Friday and Monday. With 265 stocks making new lows on Monday. We’re still about 200 issues away from the peak reading at Thanksgiving, but you need not even squint to see the rise in new lows.
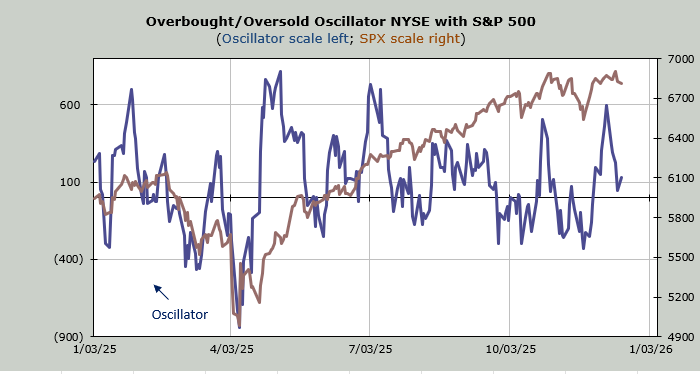
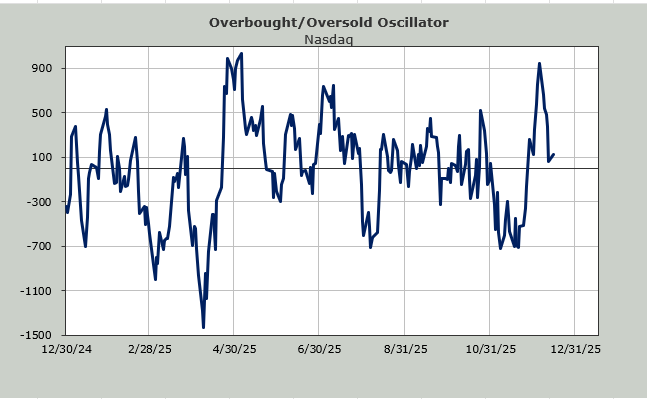
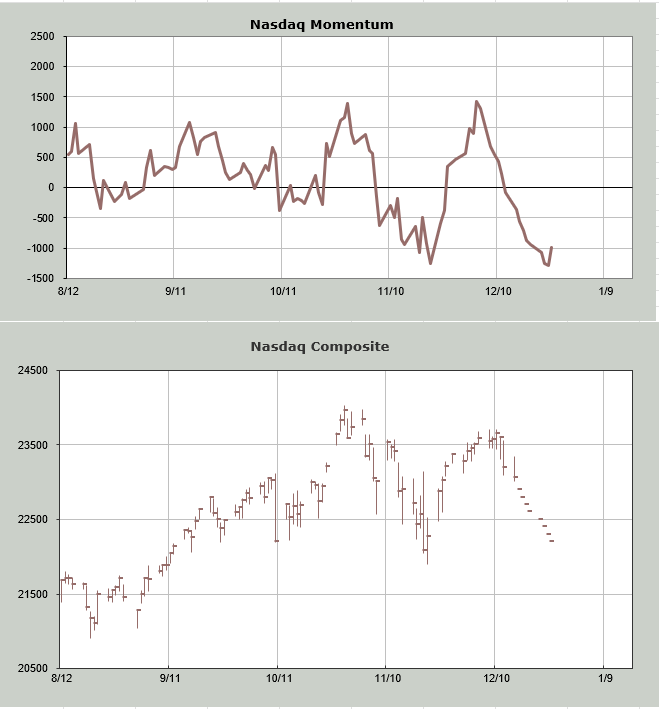
Finally, about two weeks ago, I showed you the Nasdaq Momentum Indicator to explain that I thought the market was overbought. You can see it has come down. Unlike my Overbought/Oversold Oscillator that you see here daily, this indicator is based on price (my Oscillator is based on breadth).
So, I plugged in lower closes for Nasdaq to determine the day we might be close to a good oversold condition. It’s still just before Christmas. Remember, this is not meant to pick the exact day but to give us a general time frame. And if this indicator is correct, that would line up with the Santa Claus rally. Yes, the actual data says the Santa Claus rally should begin a day or so before Christmas, not mid-month.
I do not expect Nasdaq to be down every single day between now and then. Heck, I think it should rally on Tuesday. But the math and data suggest that it could be a volatile time getting there.