This Indicator Just Turned Bearish, but Does That Mean Stocks Will Fall?
Let's dig in and see what this breadth indicator has to say.
You've reached your free article limit
You've read 0 of 1 free Pro articles.
Yesterday, we looked at the Semis (SOX) and the Bank Index, and I can tell you that nothing has changed in the charts. In fact, I can report that they are both trading pretty much where they closed the second quarter on June 30th.
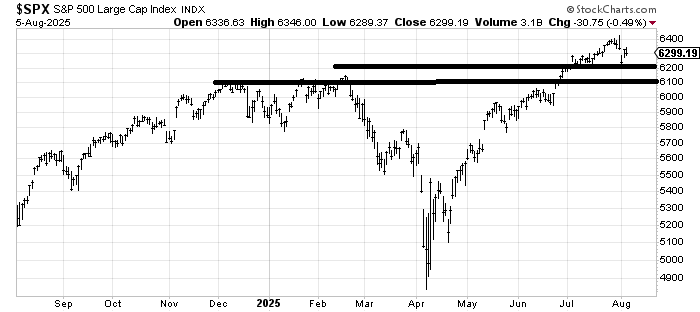
Sometimes when we’re in the day-to-day, we forget to take a step back and look. Recall, on July 3rd the market got overbought and the Daily Sentiment Index (DSI) for the S&P got to 87. I know it felt as though the market was creeping higher every single day in July until last week, but notice these two indexes haven’t done a thing in six or seven weeks now.
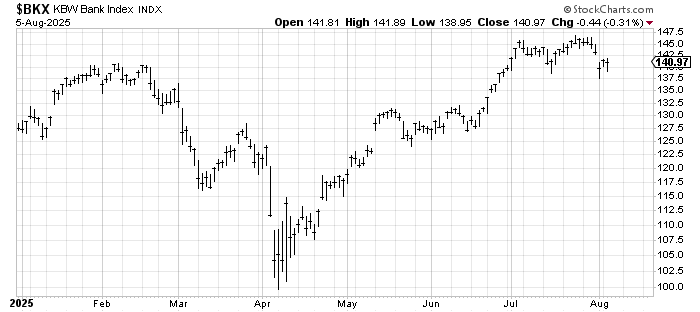
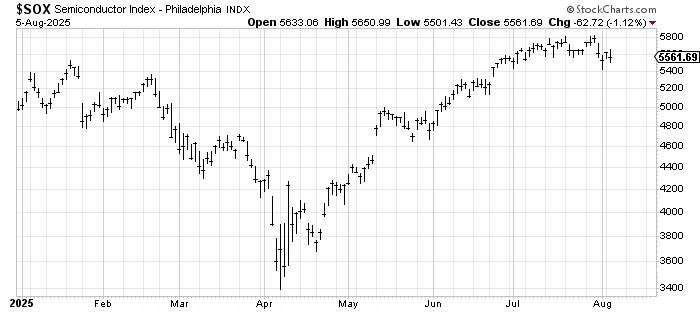
The S&P is not flat over that time, and it still hasn’t managed to break back under 6200, but these two leading groups have stalled.
Last week, we looked at the McClellan Summation Index for Nasdaq using volume to see what it would take to turn it from the newly heading down stance to back up. You might recall that it seemed incredible that it would need a net differential of +12 billion shares (up minus down) when it had needed +14 billion shares at the April low. That number is now 9.7 billion shares.
But take a look at the actual Summation Index. You no longer need to squint to see the turn down. What is incredible when you look at it is that the NYSE saw an attempt to rollover in late May, but Nasdaq had none of that; it has been straight up.
Therefore, the turn down in this indicator is different. The only time on this chart that the turn down in the indicator did not lead to a decent correction was in early 2024 (red arrow), although a few months later, the correction of about ten percent did show up.
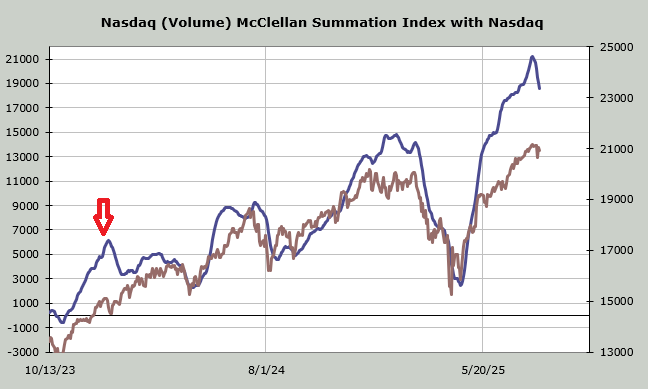
The market caps of the largest stocks are so controlling (and out of control) now that I wouldn’t even hazard a guess that says this is more like early 2024 than the three other instances on this chart. But I do know that one of the leading groups has already stalled out (semis).
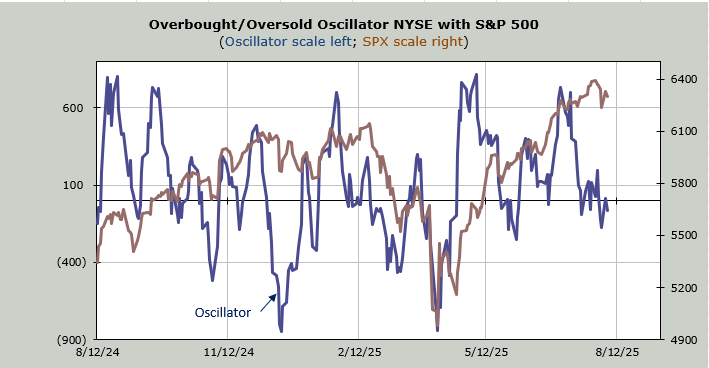
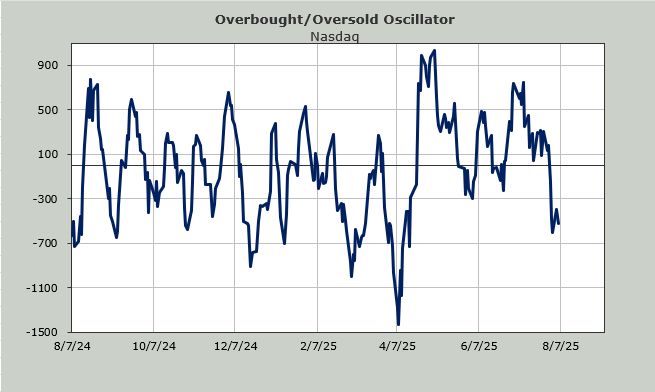
Now for the good news. If the market can stay down for another day or a few, we’ll have another short-term oversold condition with us. In fact, if net breadth is negative on Nasdaq on Wednesday, this Overbought/Oversold Oscillator could plunge to where it was in March (I doubt it would get to April).
To me, that leaves us in the midst of a correction that for most stocks began in early July. We are weeks into this; it didn’t start last week.