This Bear Isn't Done Growling
Let's look at the Fear & Greed Index as well as Jason's inverse ETF indicator. And, we launched a podcast!
You've reached your free article limit
You've read 0 of 1 free Pro articles.
Fear & Greed and my inverse ETF volume indicator
2025 has not been the best of times.
- The S&P 500 is down 14% since the February high and 11% year-to-date.
- This is officially a bear market, since we’ve been down >20%.
- Staples and Utilities are the only sectors that are higher in 2025.
- 158 out of 503 S&P 500 constituents are higher. That’s just 31%
- The best of those are CVS, NEM, PM, COR, ED, EXC, and PLTR
- The worst S&P 500 performers are: DECK, ON, TER, CRL, ZBRA, MRNA, and TSLA
- Bonds are nervous:
- The yield curve is inverted at the medium-term.
- CDS spreads are widening.
- Bond prices rallied, got killed, and are back in the plus column this year.
- The dollar is at multi-year lows, having broken down from support, which will make imports more expensive but exports cheaper, if anybody will buy them from us.
So, things are bad. The good news is that bad times present the best buying opportunities, and we have to be on the lookout for those.
Fear & Greed Review
However, I still don’t think we’re there. I also think that when we are close, the Fear & Greed Index will give us some warning.
This chart shows the last four years of Fear & Greed history (in blue) vs. the S&P 500 (in red).
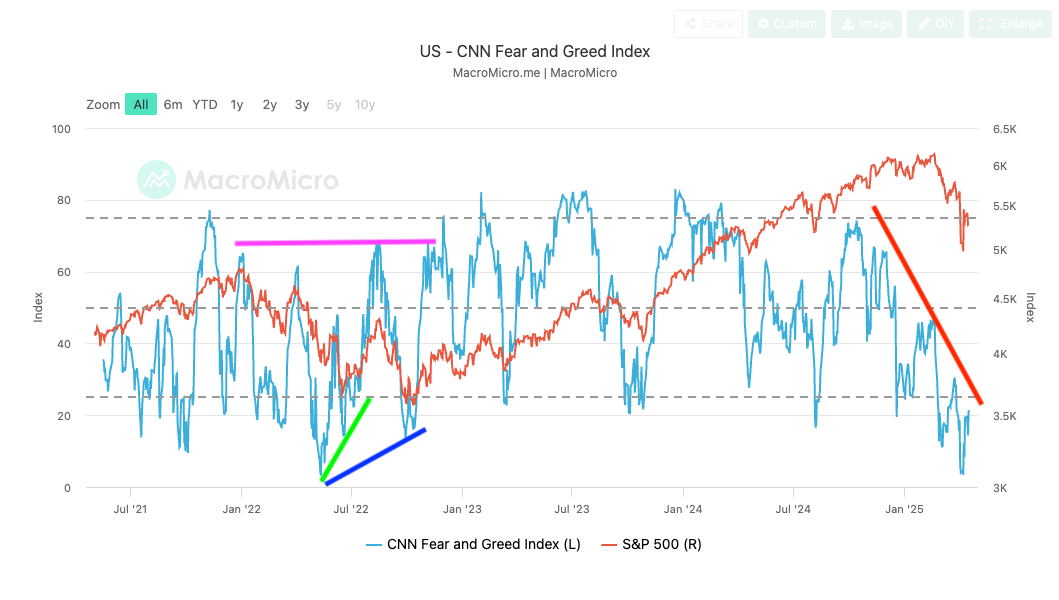
One reason I was cautious going into 2025 was that bearish divergence (red line)-Fear & Greed was declining, while the S&P 500 was setting new highs. We've talked about that before.
Similarly, when the market is trending downward, a bullish divergence (S&P 500 sets a lower low but the Fear & Greed Index sets a higher low) often signals a bottom. That’s what happened in 2022. See the green and blue trendlines in the chart.
The green line was a little early but offered a tradable signal that led to a 16% gain. The caution sign (with the benefit of hindsight) was that Fear & Greed couldn’t get above 70 (pink line). On a rally out of a bear market, we really want to see all indicators get in gear and go to Extreme Greed.
The final low was confirmed in October, when Fear & Greed set another bullish divergence (that's the blue line) and then Fear & Greed finally became Extremely Greedy in January.
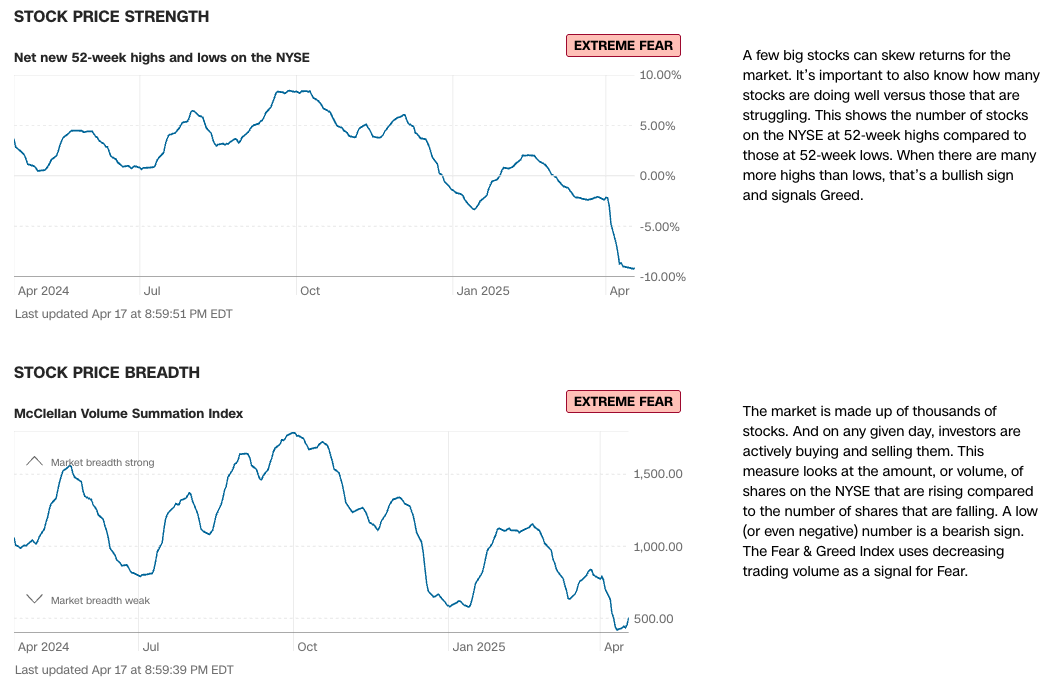
I’d also like to see Fear & Greed’s two breadth indicators, Net New 52-week Highs and the McClellan Volume Summation Index, turn upwards. They’re both stuck in the basement with Extreme Fear right now.
Normalized Relative Volume on Inverse ETFs
Besides Fear & Greed, I've also done work on a volume algorithm that I call Normalized Relative Volume. I wrote a paper on it that can be found here on page 69.
In the paper, I find that by normalizing a security's volume relative to the overall market, I can find times when that security might be ready to pop. I won't get into all of that here, but not included in the paper is work I've done on relative volume for inverse ETFs.
It turns out that building normalized relative volume on inverse ETFs, we can tell when investors are complacent as well as when they've gotten too bearish. This often leads to reversals.
In this chart, the S&P 500 is the purplish line and my indicator is in green, both overlaid on the S&P chart and in the bottom clip. The correct axis for the indicator is the one on the left.
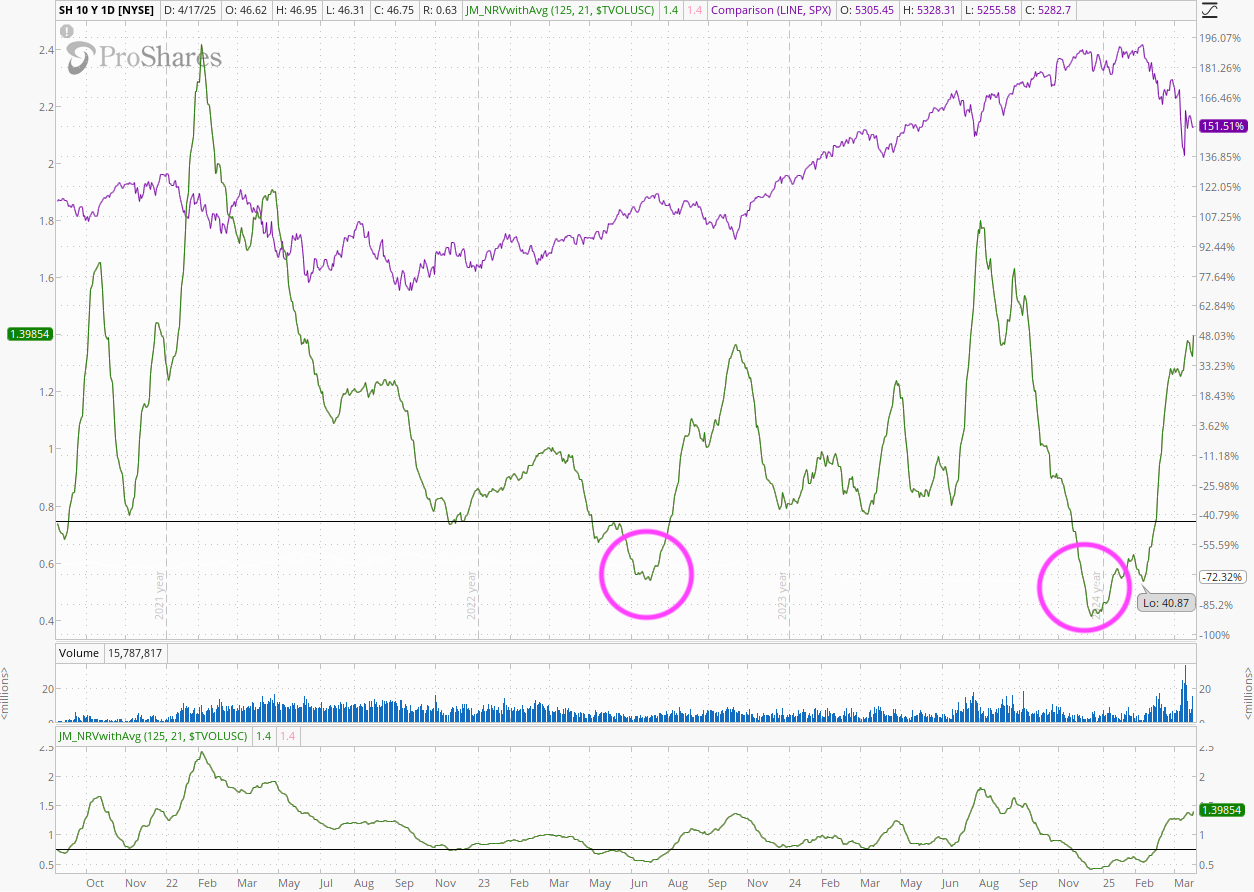
When the indicator is abnormally low, below 0.75, we often get a correction. Why? Investors are complacent. That happened in December (pink circle), and I wish I'd been looking at this indicator back then. Next time!
The indicator is currently at an abnormally high level, 1.4, which often comes with rebounds in the market. But take a look back to 2022, when the indicator hit 2.4. Frankly, I'm surprised we haven't gotten that high again, but it might be that I'm only using one inverse ETF in this calculation, SH, and investors might have added others into their quivver.
The thing is, the indicator is still rising. I'm interested in seeing how the market reacts when this is falling. That would mean that traders are pulling back their hedges and bearish bets. For now, they're not. It's a bear market and we have to treat it differently. Sell the rips, be careful with the dips.
So, put me in the camp that says there's "more weakness to come." There will be rallies and they may be big ones. But until Fear & Greed shows a bullish divergence and the Inverse ETF volume indicator declines, I remain skeptical of this market.
Do you agree? Leave a comment below.
Our New Podcast Launched This Week!
But on the subject of Weekly Wins, we at TheStreet had a big win this week! We launched a podcast!
Chris Versace will lead TheStreet’s Stocks and Markets Podcast with a rotating cast of other market analysts like Peter Tchir, Louis Llanes, Jay Woods, and others. You can read the transcript and watch it here and even share it with your friends here or on YouTube here. It’ll be available soon on your favorite traditional podcast platforms, too.
Members of TheStreet Pro will receive early access to the podcast on Wednesday. We'll share it later that day on all major podcast platforms and on TheStreet on Thursday.
We hope you enjoy and please share your questions. And like and subscribe!
This week's launch included a conversation with Peter Tchir. Highlights include:
- Peter believes that Trump legitimately wants to see the middle class grow and thrive, which requires reducing the deficit and bringing jobs back to America.
- The current strategy, however, isn’t taking the time needed to negotiate trade deals and has damaged the American brand.
- Other problems include isolating US allies and ignoring the US trade surplus in services, which is short-sighted.
That's all for this week. Happy Easter to those who celebrate!
