There's Not a Lot of Bull in This Market, and That Will Impact Us for Months
Let's look back across history to see what happened during past periods when the II Bulls average was below 30%.
You've reached your free article limit
You've read 0 of 1 free Pro articles.
For the last several days, while the market mostly went sideways, I have watched folks slowly warm up to the market. But I am not seeing it in a big way in the statistics yet.
Oh, sure, we see small tidbits of it. I might call all that penny stock speculation a change, or the fact that the put/call ratio was .82 on Wednesday, but the options ratio just doesn’t match the chatter. Not yet. Perhaps the fact that the fan-fave tech stocks all reported decent earnings will help folks get off the fence and jump over it.
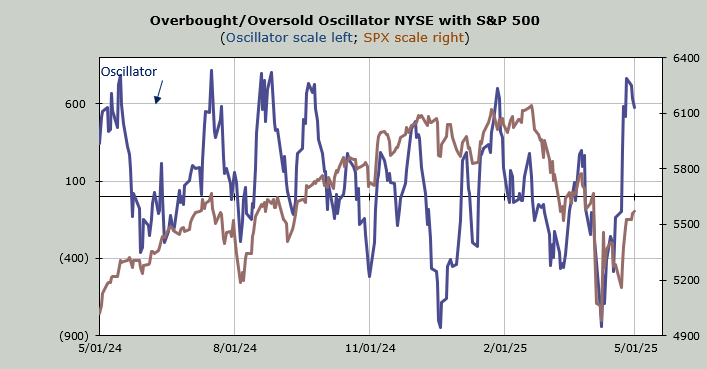
We saw the Investors Intelligence bulls move up five points to 28.8%. But there are still more bears than bulls. In fact, the bulls have been so low for so long that the ten-week moving average of bulls is now at 30%. That does not happen often.
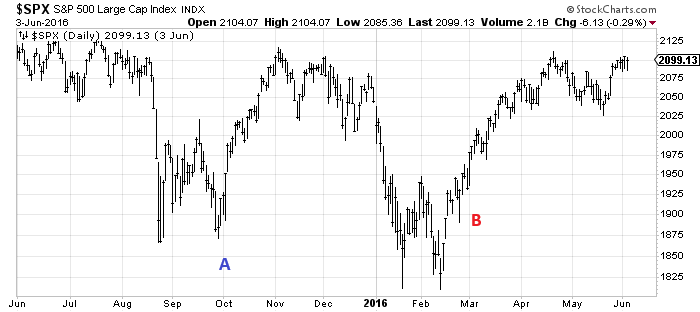
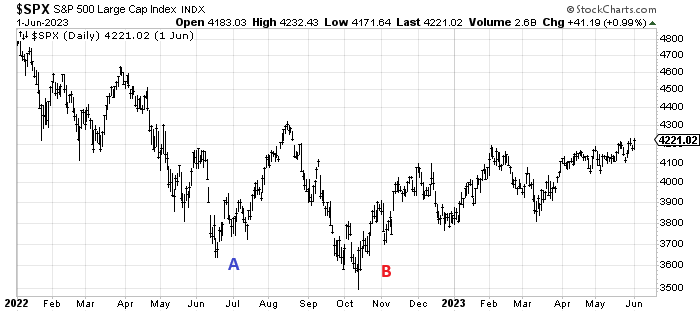
Dating back 30 years, it has only occurred four other times. The last two times (in 2015-16 and 2022) they ‘double tapped’ this level, but even in the depths of 2008, this was about as low as they got.
But here’s what I found fascinating. In each case—and yes, I realize it is only four instances—the market had a nice rally but came back down. I was quite surprised at this; I did not expect to see that. But each time the revisit to the low was months later. None were even just weeks later.
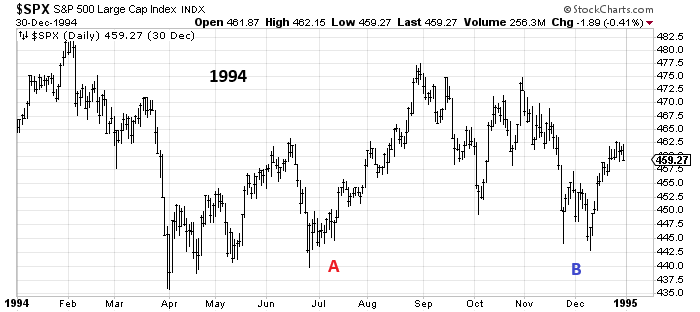
In 1994, we had the now-infamous soft landing, but the ten-week moving average tagged 30% in July, and we rallied eight percent. I know it looks like a lot, but that’s what it was. The rally lasted a bit over two months before we headed back down for the retest.
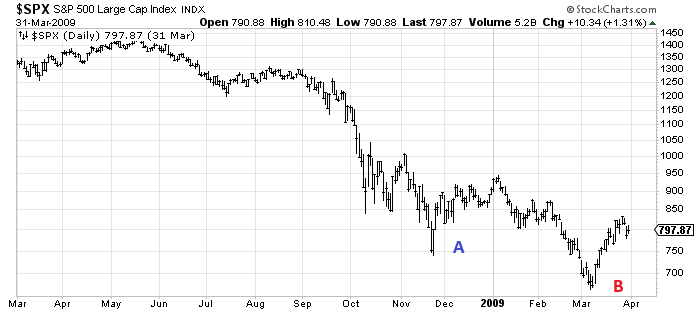
2008’s chart looks different, but the rally off point A was actually 20%. I cannot recall that anyone called it a new bull market, though!. That rally lasted six weeks before heading back down. And it didn’t even break the prior low until close to the end, nearly four months later.
In 2015, the rally looks a lot more exciting than it was since it was only about eight percent but here again you can see the retest was five months later.
Finally, in 2022, we rallied 20% over two months (did they call it a new bull market then, too?!) before heading back down.
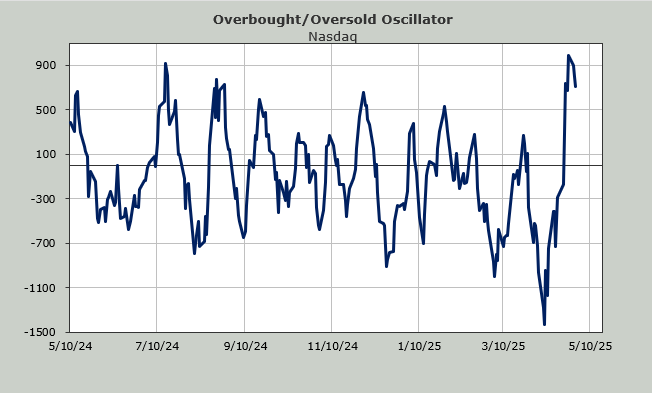
So, for all of you who saw the GDP on Wednesday and the market head down 100 points and asked me if we were just going to slide, let me reiterate that I think it is too soon to see the market head back down. The indicators need time to get overbought (intermediate term). The sentiment needs time to go from too many bears to bulls. That’s the sequence.
The last week has seen most charts chop sideways. Breadth has stayed good. It was negative on Wednesday (not by much), so the test now is if the index movers leave the 493 in the dust. And we all know when the Mag 7 moves up, it gets folks bullish.