There Was Plenty of Selling Thursday, but Was There Panic?
Let's look at the indicators.
You've reached your free article limit
You've read 0 of 1 free Pro articles.
You know that old cartoon of the skeleton sitting at a desk strumming his fingers because he is waiting for something that never comes? That’s what I feel like. Why is that 90% down volume day so elusive?
I wish I knew, but we managed to get 88% of the volume on the downside Thursday. Some might say that is close enough, but Thursday felt more like persistent selling rather than panic.
Here’s one way we saw it: on March 28th Nasdaq had 77% of the volume on the downside. That day, Nasdaq was down 480 points. On Thursday, we saw 71% of the volume on the downside, with Nasdaq down over 1000 points. So there was a bigger rush to sell last Friday than there was on Thursday.
This is not to say there was no selling. There was plenty of it, just not really panicky.
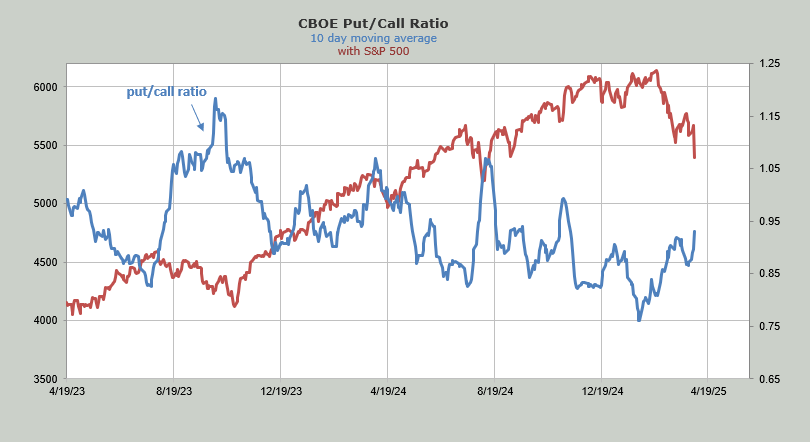
The put/call ratio finally shot up and chimed in at 1.16. As a reminder, since this decline began in February, this is only the second reading over 1.0. This means the ten-day moving average is still relatively low in that it sits at .94. Look at the chart and you can see we had more put buying last fall. And significantly more in August when the ten-day moving average shot up to 1.06. But at least Thursday’s reading was a positive change.
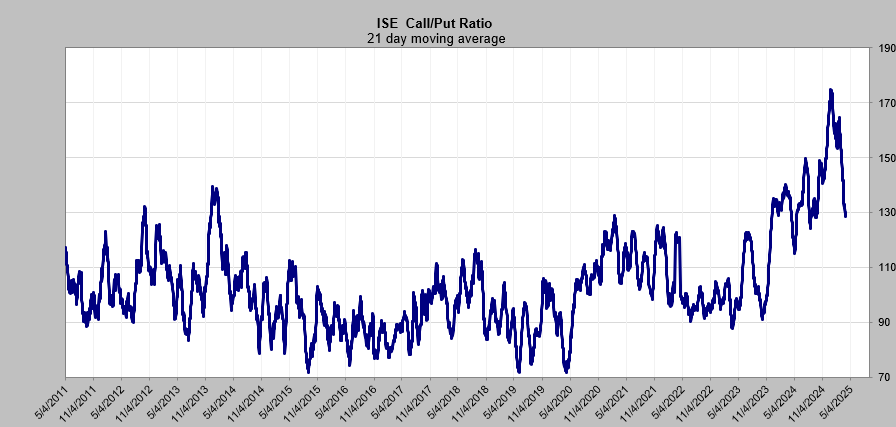
The other day I fussed over a reading under 1.0 in the ISE call/put ratio. Thursday did not replicate that. The reading was 1.11. This is why the 21-day moving average just hovers around 1.30. Several readings under 1.0 and this would fall in a hurry, but the call buyers remain active.
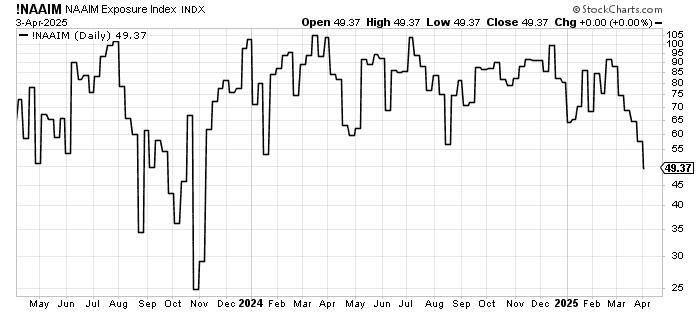
The NAAIM folks did finally do some giving up as they reduced their exposure to 54. This is the lowest in a year. But as you can see on the chart, the surveys such as AAII and Investors Intelligence show bearishness closer to where this was in the fall of 2023 (25).
Now this questionnaire is concluded on Wednesday at midday, so it does not include Thursday. It’s possible next week it will be significantly lower.
Then there is the Daily Sentiment Index (DSI). For Nasdaq, it has fallen to 20. The S&P is at 22. Earlier this week when Nasdaq’s sat at 23, I was hopeful this could plummet to under 15 but we rallied and had to reset it. Once again, it has the chance to get low enough for us to fuss over. The skeleton waits.
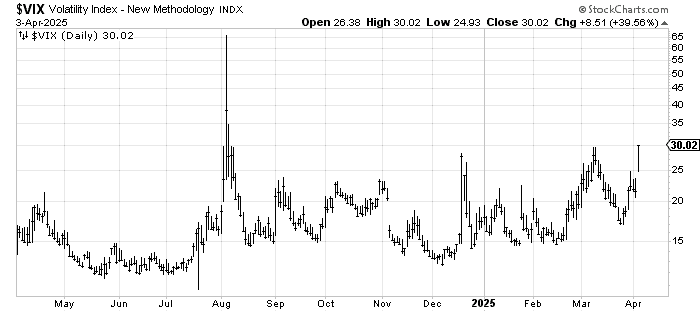
The VIX has moved to the starting line, so to speak, as it sits right at 30. If it can get going and start to look like a breakout, I think I might be able to call it jumpy. Again, this is very subjective.
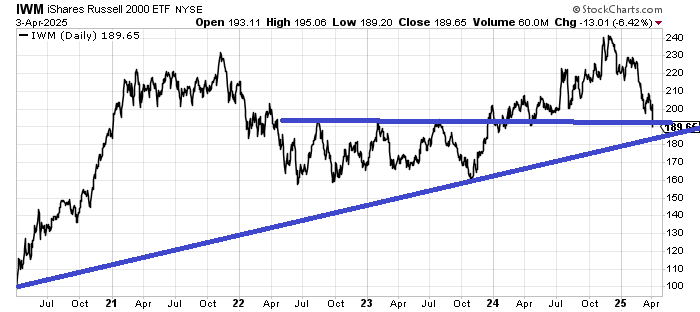
Let me end by noting the Russell 2000 is now down more than 20%. I thought they might fuss a bit more, but it was more in passing that they mentioned ‘small caps are in a bear market.’ It’s coming into some support, but I still prefer the indicators.
Can we rally from here? Sure. But in my view, it would be more of what we’ve gotten: a few days of rallying with sellers showing up. The setup for panic is there. The skeleton would like to see it.