With my official launch, I wanted to express my excitement to be bringing Neil’s Newsletter to TheStreet Pro.
For readers who are new to my work, this piece, The Week Ahead, is meant to be a broad but structured look at the major forces driving markets: the economy, earnings, positioning, flows, sentiment, breadth, valuation, seasonality, the Fed, interest rates, and other macro and geopolitical crosscurrents that matter from week to week.
The goal is not to make bold predictions or force a single narrative. It is to work through the evidence, highlight what seems most important, identify where the risks and opportunities may be shifting, and provide a framework for thinking about the week ahead. As my friend Doug Kass writes “I am often wrong and always in doubt.”
That framework will carry over from Neil’s Newsletter, but I also want this piece, and to a larger extent the intra-week pieces (morning, evening, and economic updates), to evolve in whatever way is most meaningful for readers here. In that regard, I want to encourage an open and robust dialogue. Please post or email comments, questions, pushback, or suggestions on what I write, and especially what you would like to see more or less of. I read all the feedback, and I promise to be responsive as the newsletter settles into its new home.
With that, let’s get into the Week Ahead.
The Week Ahead: A Lighter Week But CPI Looms
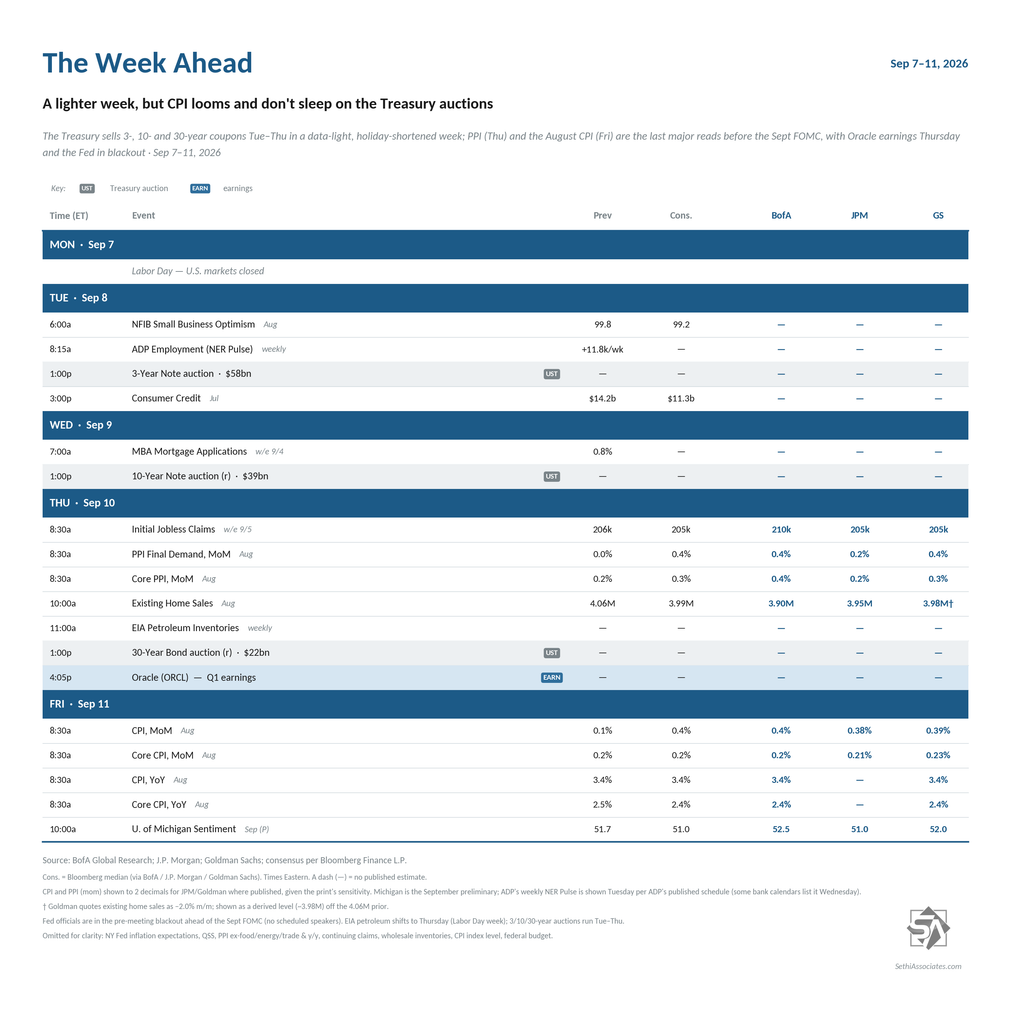
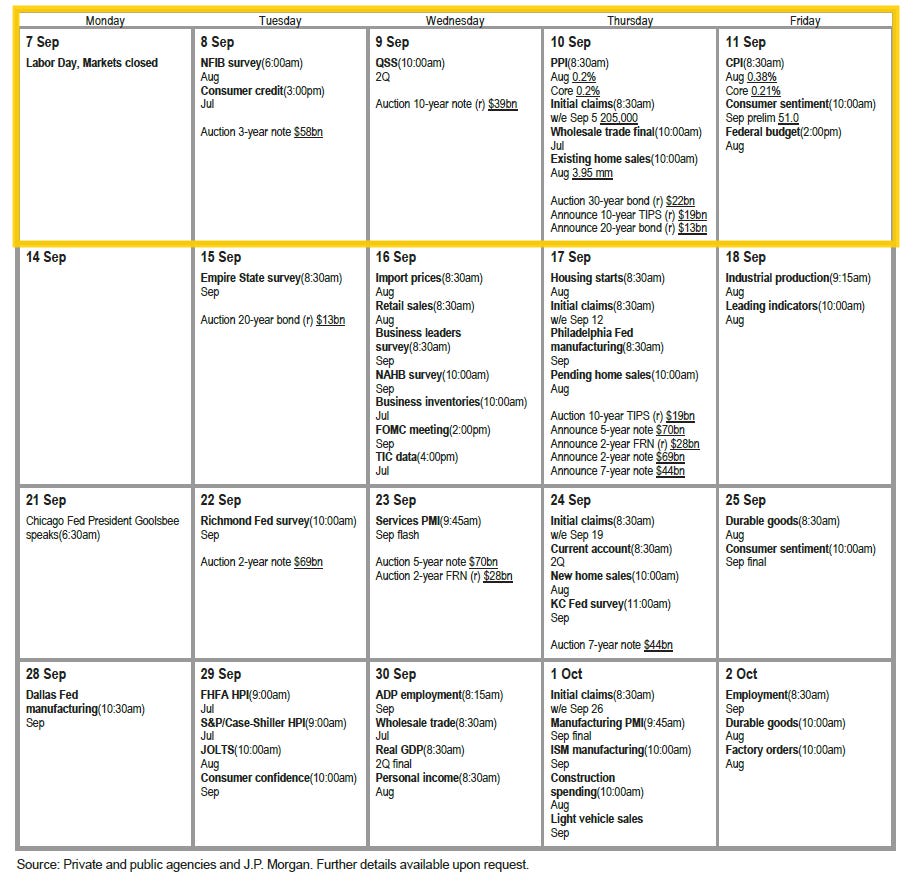
After a packed stretch, things settle down a bit — though we enter the post-Labor Day period, when the heavy hitters are said to return from summer holiday, and the week ends with a bang: the August CPI and PPI reports, which look to be pivotal in determining whether the Fed hikes the following week (a lot more on that in the Fed section towards the end). Unusually, we’ll get them in reverse order, with PPI on Thursday and CPI on Friday.
Other reports include Augustexisting home sales, NY Fed consumer survey, and NFIB small business sentiment, September UMich preliminary consumer sentiment, July consumer credit, plus the standard weekly reports (ADP, jobless claims, etc.).
The Fed blackout has started so no Fed speakers this week.
US Treasury auctions pick back up for non-Bills (>1yr in maturity) with 3, 10, and 30-yr auctions Tuesday, Wednesday, and Thursday respectively. But unlike last month’s set, this month the US Treasury’s expanded buybacks take effect (through November 4) and would apply to the 10 and 30-year auctions (adding “at least” another $2 billion to the $2 billion that was already in effect).
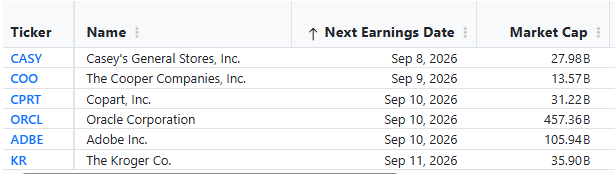
Q2 earnings season will continue to wrap up, and we’ll start getting Q3 reports soon (the unofficial start to Q3 earnings is October 13th with JP Morgan). This week we’ll have just six SPX components reporting, but one will get the bulk of the attention — Oracle (ORCL) on Thursday.One other >$100bn market cap reporter is ADBE also on Thursday. Also, Apple (AAPL) releases its new suite of products Wednesday.
Finally, the US Republican Party will hold its first midterm national convention in Dallas on Wednesday and Thursday. President Trump and Vice President Vance are expected to deliver speeches.
Ex-US highlights from Deutsche Bank:
On Tuesday, Canada’s counter-tariffs on US imports take effect.
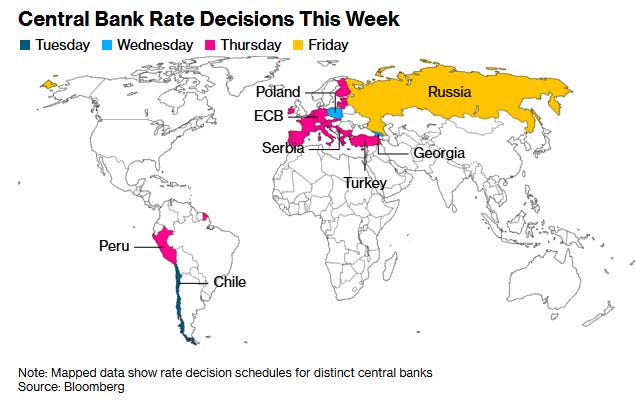
In Europe, a main focus will be the ECB’s decision on Thursday and our European economists expect a 25bps hike to 2.50%. In economic data, the key UK release will be July monthly GDP on Friday. Activity data will also be in focus in France, with July industrial production due Wednesday, and in Germany, with July industrial production due Monday and the trade balance due Tuesday. Elsewhere, August CPI reports are due from Sweden on Monday and from Norway and Denmark on Thursday.
In Asia, the focus will be on China, with the August trade balance due Tuesday and CPI and PPI reports due Wednesday. Our economists forecast PPI inflation to moderate to 3.2% year over year in August from 3.5% in July, while CPI inflation is expected to pick up to 0.8% from 0.5%. They also expect stronger trade activity, with exports and imports projected to grow 27% year over year and 29% year over year, respectively. In Japan, Tuesday’s releases include July labor cash earnings and the August Economy Watchers survey, while the PPI is due Friday.
And here are links to Christophe Barraud’s nice Week Ahead quick-hitter rundown of global events followed by Bloomberg’s with more commentary.
Looking first at the economy, my intro has remained the same since the start of the Iran conflict: “we continue to see it weathering the various storms remarkably well due in large part to continued resilient consumption (fueled by huge increases in wealth over the past few years despite slowing incomes) and AI-spending… with data of late showing a stable (and perhaps accelerating) economy, but one that is also boosting inflation.”
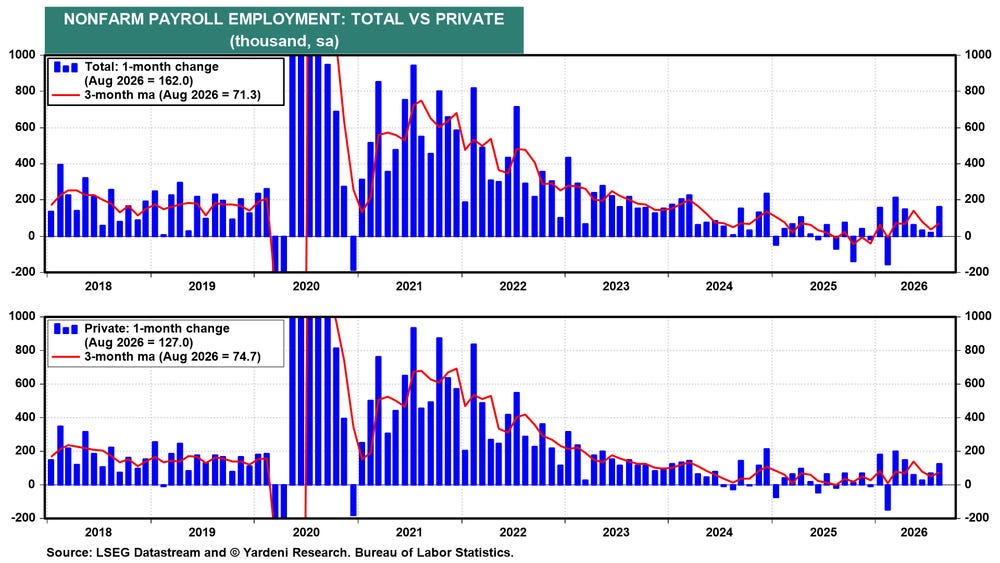
As noted previously, while in June that “perhaps accelerating economy” parenthetical did a lot of work, things tailed off in July into the start of August.But three weeks ago economic momentum started to rebound somewhat outside of the housing sector (which remains sluggish), and that continued into last week ending with the blowout jobs report covered extensively here (I apologize for some of the formatting issues, I’m still getting the hang of this new system).
In addition to the Employment Situation report, on the jobs front ADP came in slightly better than expected (but well under what we saw with Nonfarm Payrolls), jobless claims remained low, Challenger job cuts were the least for an August since 2022 while hires were the strongest since then, the JOLTS report saw job openings, hires, quits, and layoffs all come in under expectations, and Q2 productivity was left with a healthy gain. Elsewhere, factory orders were very strong as were core capital goods (proxy for business capex) shipments (core capital goods orders were weaker but those are less reliable), and manufacturing and services PMIs remain solidly in expansion.
Not everything was great, though, as construction outside of data centers remained weak. As a side note in future months there will be individual breakdowns on all of these reports.
So no reason to change my outlook at this point. As I mentioned last week “the economy was pretty strong in the first half, so some giveback in July was, if anything, a yellow light and more what we should have expected. We’ll need at least another month of similar data before I even start to raise my recession concern levels.” It appears for now that won’t be necessary.
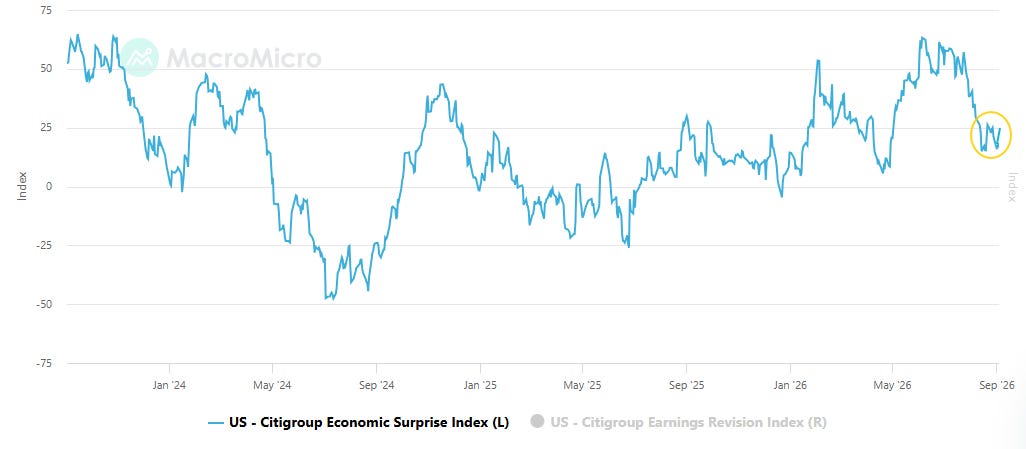
And the strong jobs report saw the Citi economic surprise index jump to 24.8 from 18.5 prior to the report, although still well under the 57.1 six weeks ago (July 24th).
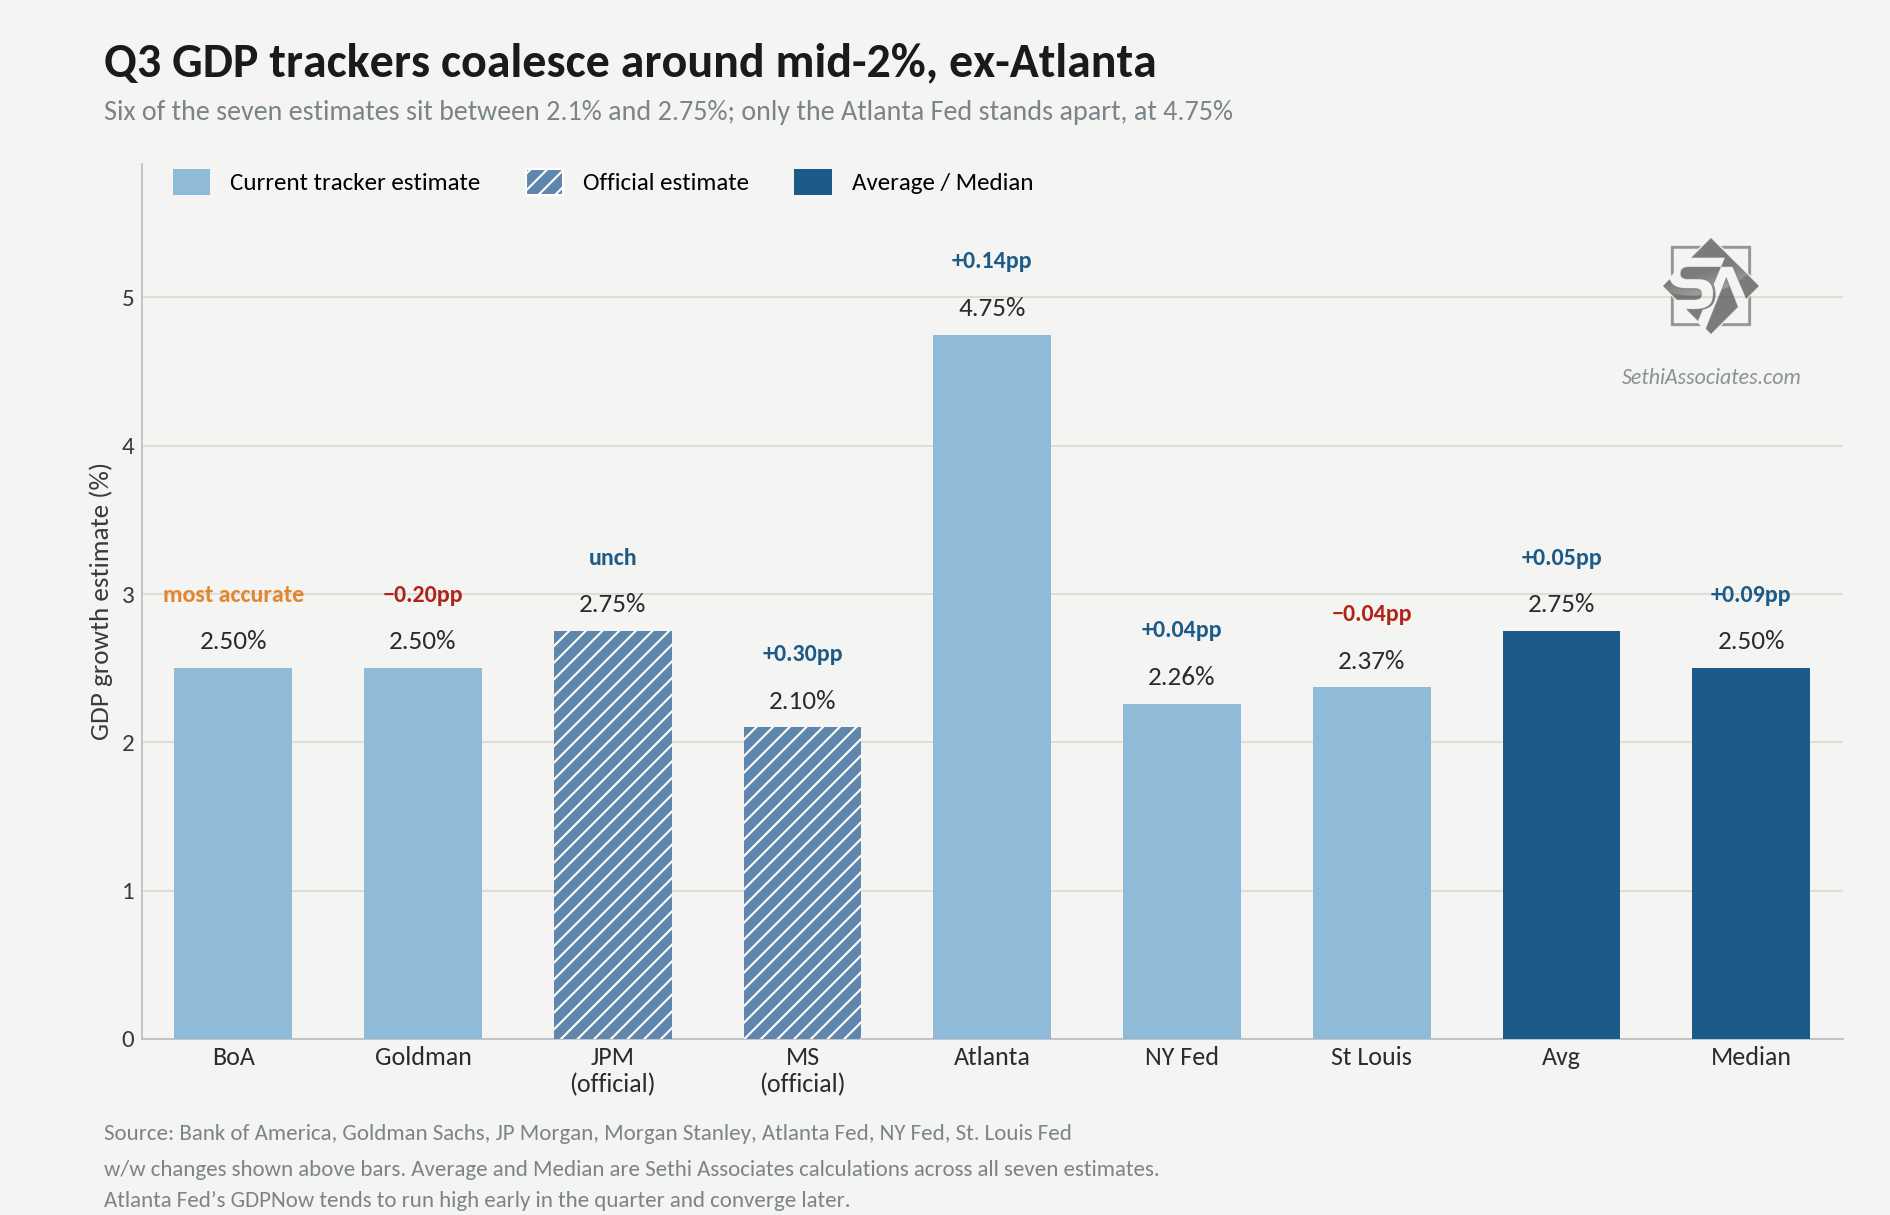
Meanwhile Q3 GDP estimates outside of the Atlanta Fed (who as a reminderhas been very high right up until the end of each of the past two quarters before falling sharply towards the other trackers) have all unusually clustered in the 2.1-2.75% range, consistent with a solid economy (always remembering GDP going into recessions generally doesn’t look like one is coming (it was up around 2% in Q2 & Q3 2008 well after the recession had started)).
BofA (who has been the most accurate over the past year) refreshed theirs after two weeks off +2.5% (from +2.4%). Goldman +2.5% (+2.7%) JPM +2.75% (+2.75%) Morgan Stanley +2.1% (+1.8%) Atlanta Fed +4.75% (from +4.61%) NY Fed +2.26% (+2.22%) St Louis Fed +2.37% (+2.41%)Avg = +2.75% (from +2.71%) Median = +2.5% (from +2.41%)
MS (Gapen) on their upgrade:
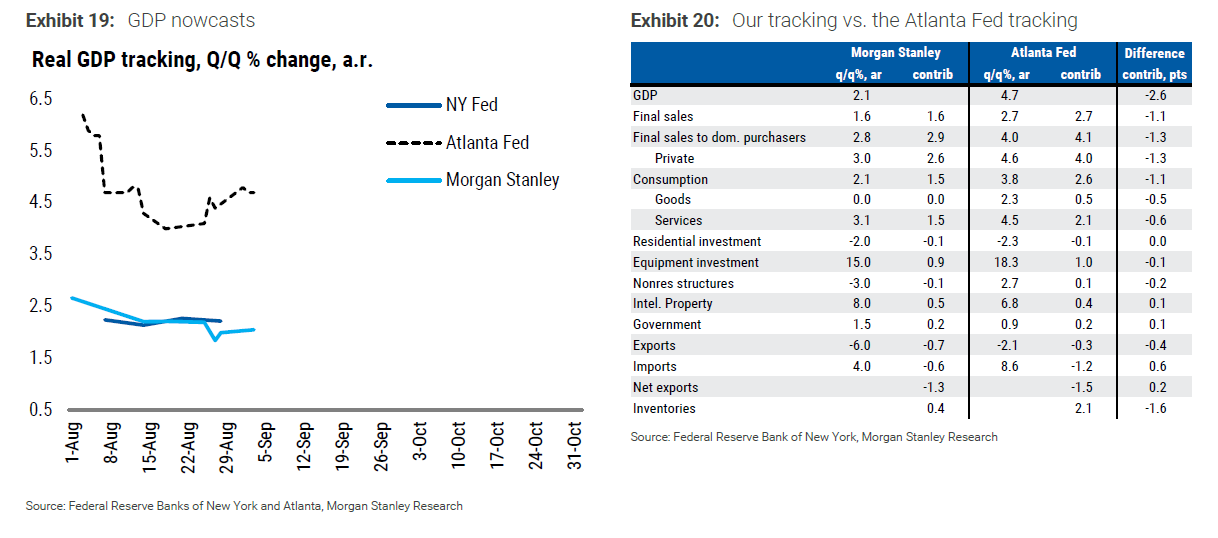
Our 3Q GDP tracking inched up to 2.1% from 1.8%. Consumer spending is stronger, reflecting the upward revisions to 2Q and a strong July. Trade is a larger drag, somewhat offset by faster equipment investment and more inventory accumulation than we had estimated.
The Atlanta Fed’s GDP tracking is much stronger than ours, at 4.7%. Their goods consumption estimate, at 2.3%, is 2¼ points above ours; their services estimate, at 4.5%, is 1½ point above ours. They also allow for much faster inventory investment than we do.
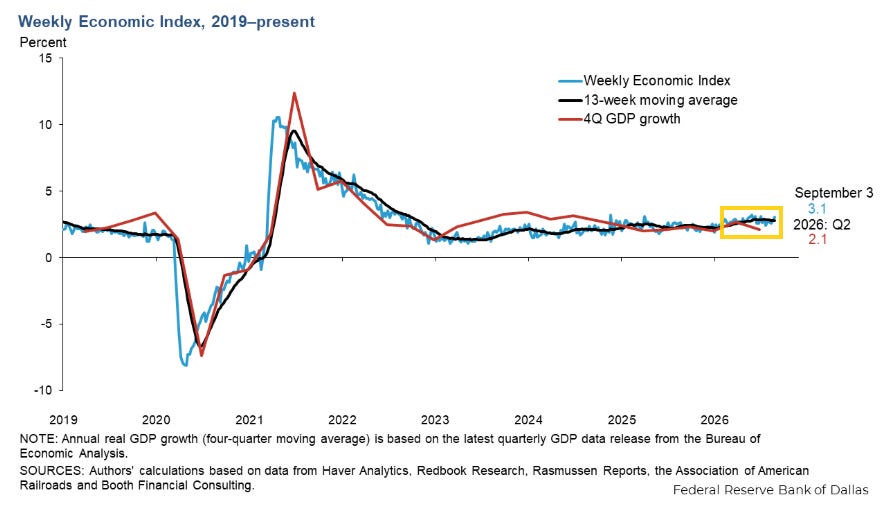
And as you know if you’re a regular reader, one of my favorite GDP trackers is theWeekly Economic Indexfrom the Dallas Fed.*
In the week through August 22nd (so doesn’t have last week’s data) it increased to a very solid +3.06%, the best since the week of July 4th, from +2.84% the prior week.
The 13-week average slowed to 2.77%, but that is just a little under the 2.87% on July 24th which was the best since 2022, continuing to evidence economic momentum that is above trend.
*The WEI is scaled as a y/y rise for real GDP(so different than most GDP trackers which are Q/Q SAAR) and uses 10 daily and weekly economic series but runs a week behind other GDP trackers.
It has over time had one of the highest correlations with actual GDP of any tracker(see chart)although for Q2 it came in highpredicting +2.80% y/y GDP growth vs the actual first estimate of +2.10%, while for Q1 it predicted +2.48% vs 2.66%. More importantly, it has consistently indicated no recession and relatively healthy growth since the pandemic (which is what we’ve experienced).
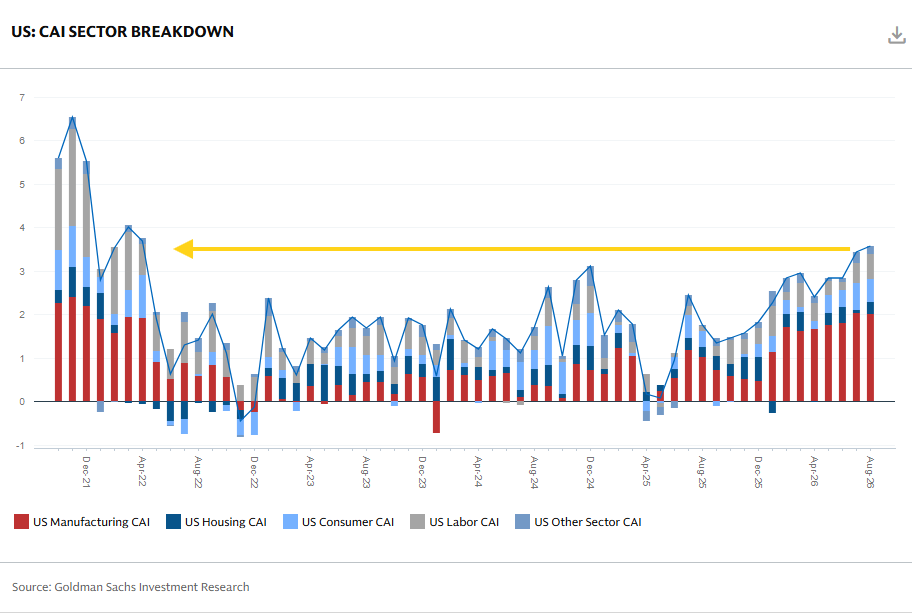
And Goldman updated their August US Current Activity Indicator* which improved to +3.6% from 3.4%, the best since April 2022. That continues the strongest 8-month period since then as well, as the manufacturing component is getting more help from other sectors, although still represents 2.0% of that 3.6% reading.
*The CAI is their “real-time measure of inflation-adjusted economic momentum using 37 inputs.”
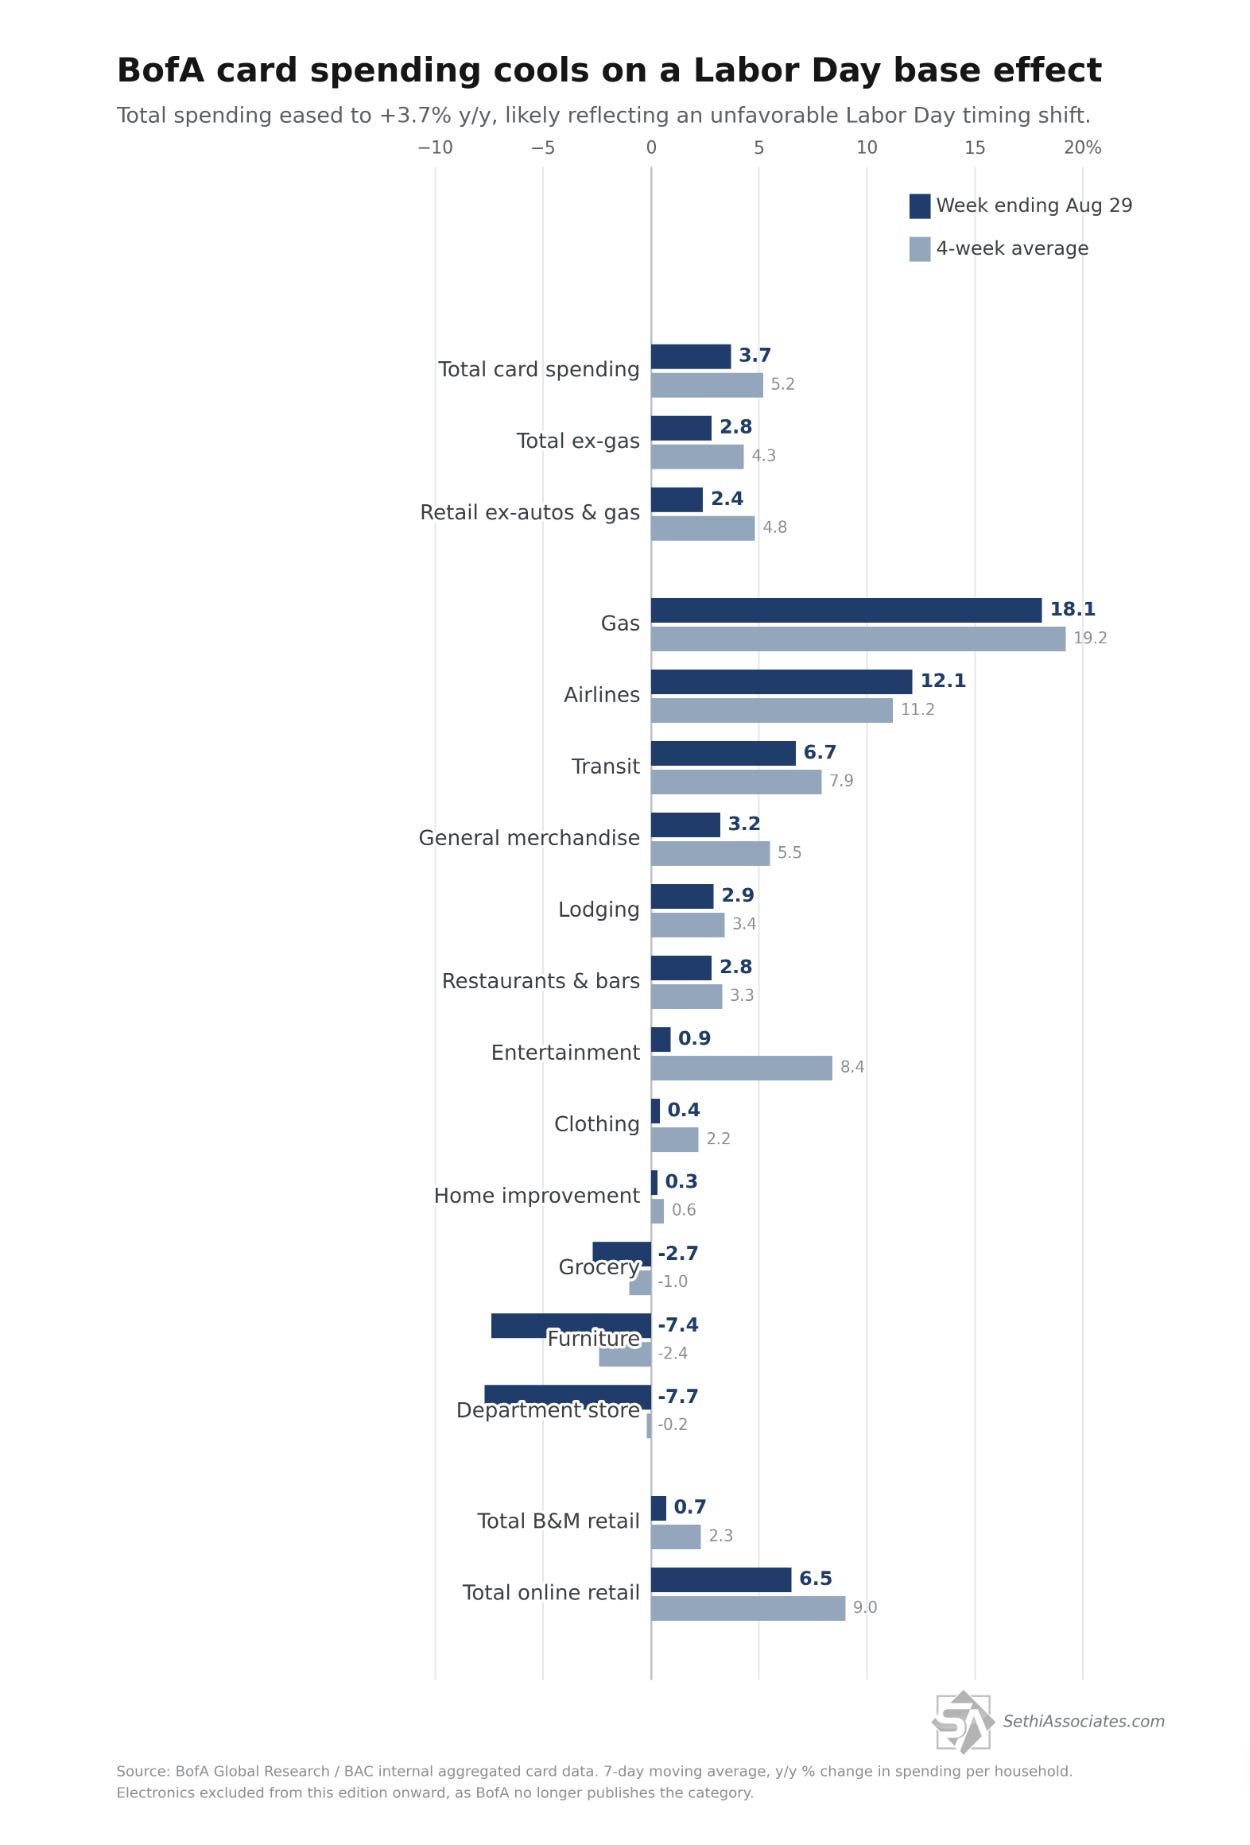
BofA card spending (credit+debit) did cool on a y/y basis in the week ending August 29th, but they attributed the slowdown largely to seasonal impacts with Labor Day falling on September 7 this year versus September 1 in 2025, so the comparable year-ago window captured more holiday-related spending which will presumably “catch up” in next week’s report:
Total +3.7% y/y (vs +5.2% four-week moving average),
Ex-gasoline +2.8% (+4.3% three-week moving average — one week is missing in the report), and
Ex-autos and gasoline +2.4% (+4.8% four-week moving average).
On net, BofA reiterated that August’s robust growth is consistent with its view that the July slump was just a blip. On the income split, higher- and lower-income ex-gas spending growth were once again running roughly in line with each other.
Turning to the category breakdown,gasoline and airlines were the standouts, with gas at +18.1% (from +19.1%) and airlines firming to +12.1% from +10.4% — the only two categories in double digits, in large part on the back of elevated fuel prices. Transit (+6.7%) also stayed clearly positive.
Not every category kept pace, however, with the declines overall consistent with the Labor Day seasonality referenced earlier: department stores dropped to -7.7% from +3.8%, furniture fell to -7.4% from -0.9%, and groceries to -2.7% from -0.5%, while entertainment* continued to unwind its late-summer surge, easing to +0.9% after peaking near +15% four weeks ago. Clothing (+0.4%) and general merchandise (+3.2% from +6.2%) also softened.
*note BofA said they will be discontinuing the electronics series so it will no longer appear going forward.
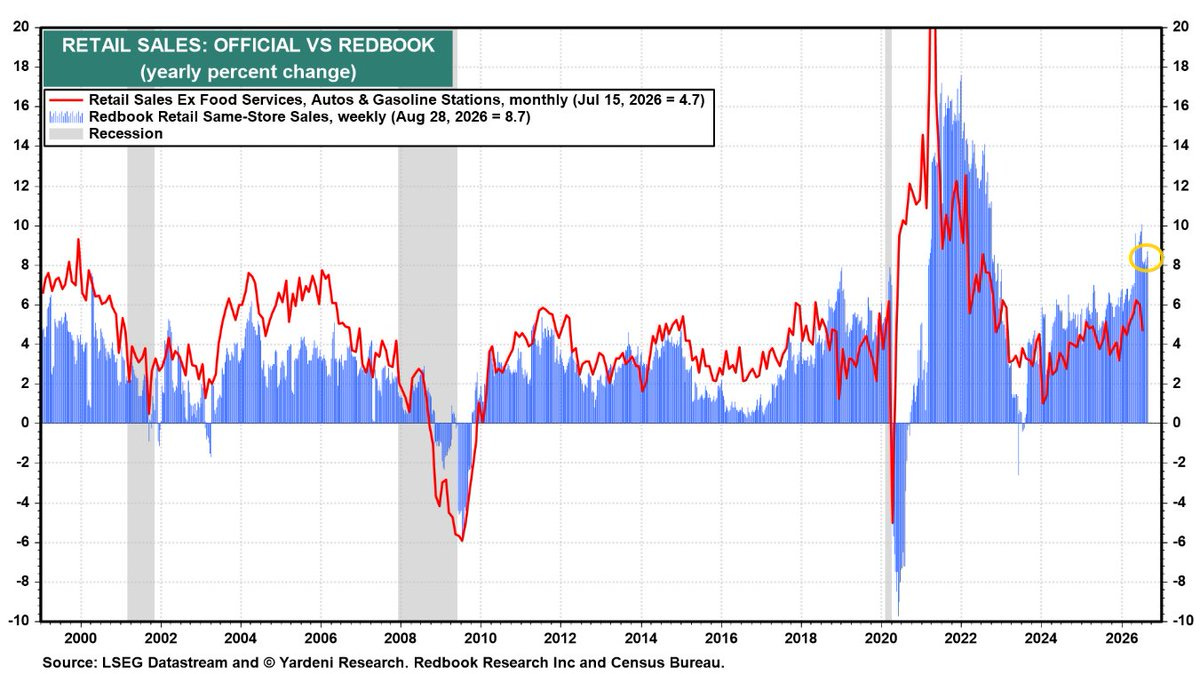
And Redbook sales accelerated to 8.7% y/y growth the week of August 28th. That compares to the 2025 average of 5.8% y/y.
JPM’s Feroli on the jobs report:
While the unemployment rate has been straightforward to read this year—a mostly steady decline—the payroll data have been harder to interpret. At times, job growth appears to be accelerating after a weak 2025; at other times, it appears simply to be maintaining a soft pace.
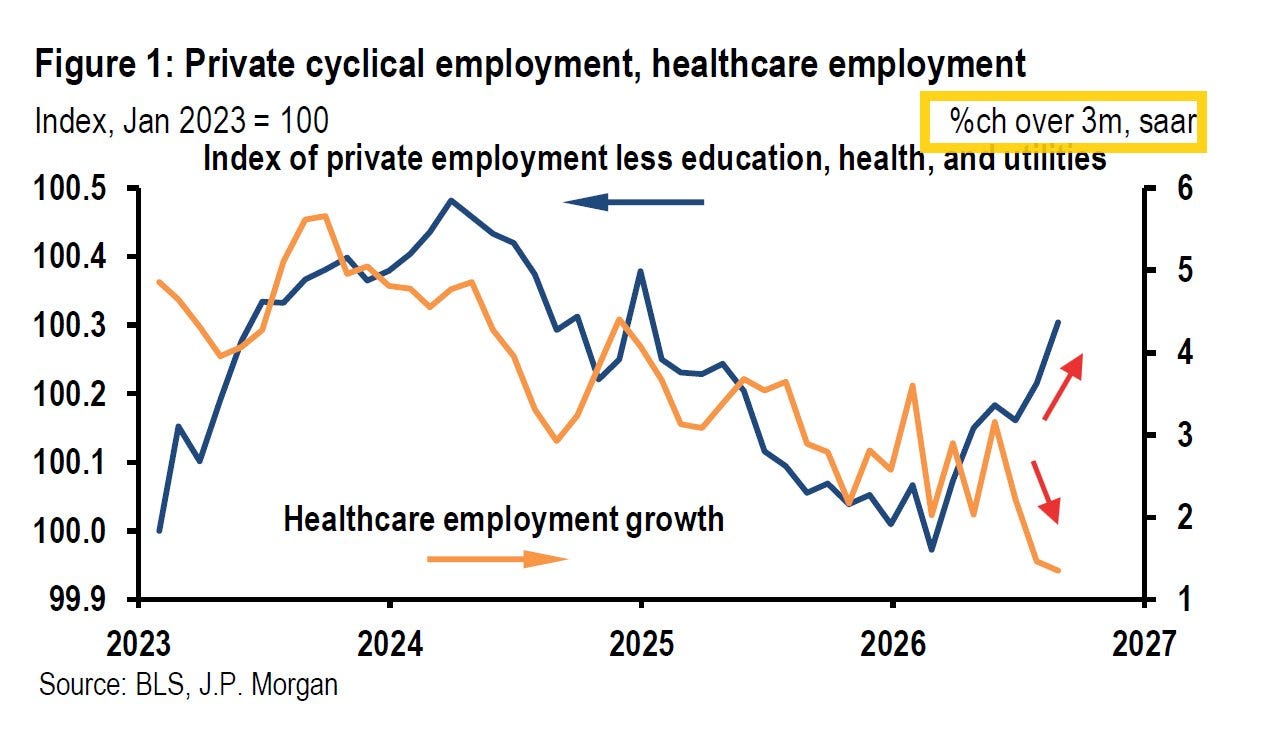
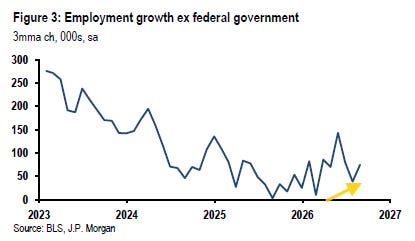
The latest report suggests that job growth may have picked up somewhat this year, particularly in certain industries [pending revisions – August is traditionally a heavily revised month]. This is especially clear when looking at private employment excluding the major acyclical sectors of education, health care, and utilities. This acceleration is valuable because it is occurring as health care employment growth moderates.
In recent months, we have consistently characterized the labor market as doing fine despite occasional stretches of subpar job growth…. Once the noise associated with last year’s federal-government layoffs is removed, the three-month run rate for non-federal employment may not look very different from late last year, although it will likely remain stronger than last summer.
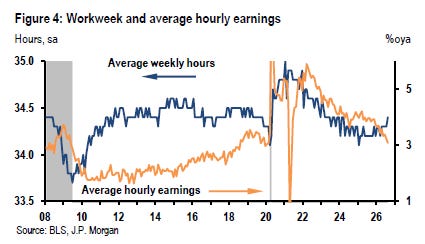
Another positive sign from the establishment survey was an increase in the workweek. Outside of recessions, the workweek is a mildly cyclical indicator and has improved this year…As a result, while private employment is tracking a 0.6% quarter-over-quarter, seasonally adjusted annualized increase in the third quarter, hours worked are running notably stronger at 1.4%. It therefore would not require especially strong productivity growth to achieve our 2.75% GDP forecast.
Decent job growth has not [though] clearly translated into faster wage growth. Average hourly earnings rose 0.27% month over month, or 3.2% annualized, possibly aided by a favorable calendar effect. However, the year-over-year pace still eased to a cycle-low 3.1%. The three-month annualized pace increased to 2.8% from a May low of 2.4%, though it remains at the low end of its cyclical range. Even if wage growth has not accelerated yet, its deceleration may soon stop: the unemployment rate is low, the workweek is edging higher, and the July JOLTS report indicates that the vacancy-to-unemployment ratio has begun to rise.
And Ed Yardeni:
The August US jobs report is among the best we have seen in some time and provided an uplifting backdrop for the Labor Day weekend. Labor demand is solid and becoming more broad-based, unemployment remains low, and labor supply improved in August. At the same time, moderate wage growth and solid productivity gains show that inflationary pressures are subdued in the labor market.
In other words, the report reinforces our view that the Fed has little reason to worry about the employment side of its dual mandate. It leaves Fed policymakers free to focus on inflation
Earnings Remain A (The?) Key Driver
As mentioned last week, with 97% of SPX components having reported by earnings weight, we were able to pretty much put a bow on results (there may be very minor changes in some of the numbers) allowing us to turn our attention to the rest of 2026 and into 2027. For a breakdown on Q2see last week’s post.
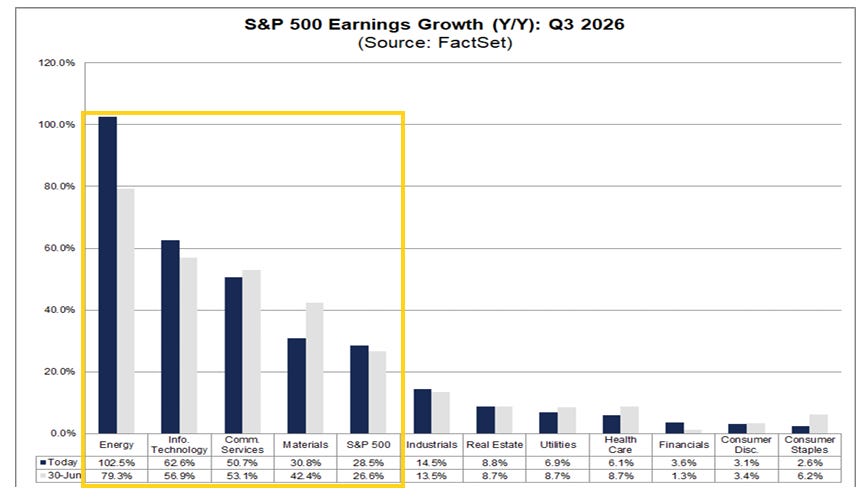
Looking at Q3, at this point analysts are expecting a third consecutive quarter of 25%+ y/y earnings growth with the Q3 estimate at +28.5%. As in Q2, Energy is expected to lead at +102.5% y/y growth (up from +79.3% at the start of the quarter (July 1st), followed by Tech +62.6%, Comm Services +50.7%, and Materials +30.8%.
Unlike Q2 no sector is expected to have negative y/y growth with Staples the least at +2.6% (down from +6.2% at the start of the quarter).
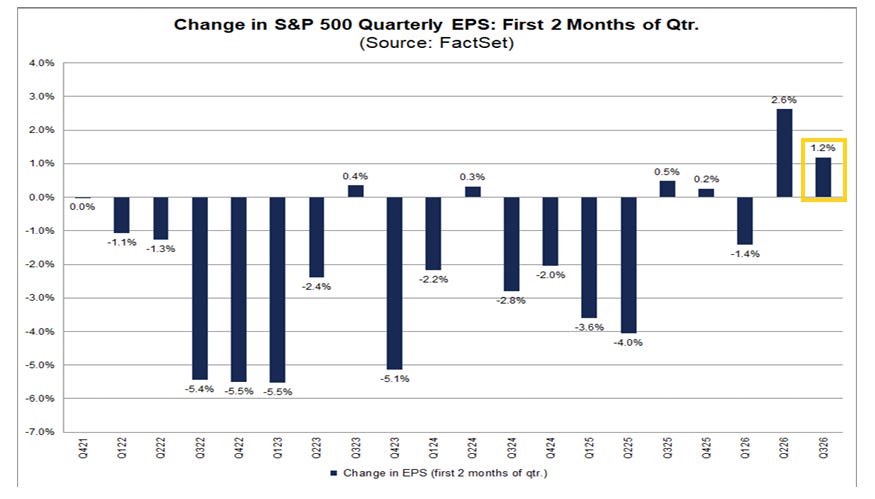
Factset noted this week that earnings expectations for Q3 have risen 1.2% since the start of the quarter (July 1st). While not as large as we saw for Q2, (+2.6%), it is otherwise the most in over five years and compares to a 5-year average of -1.7% and 10-year average of -1.2%.
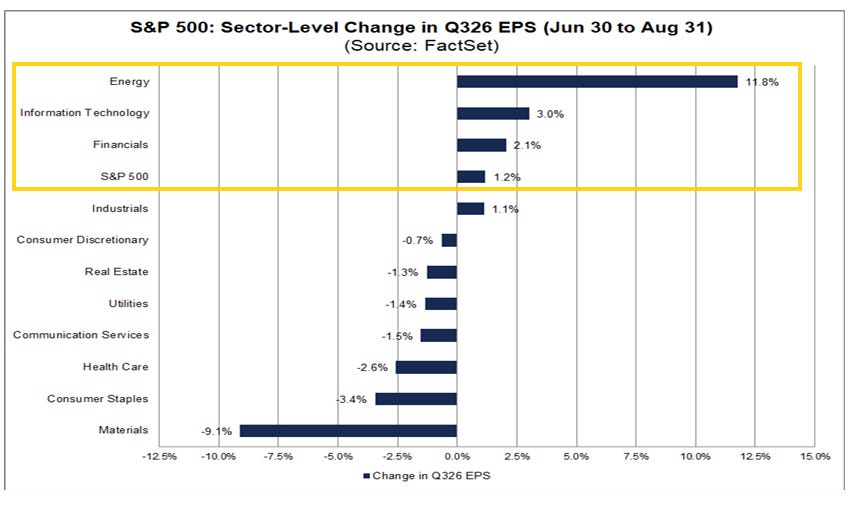
The increase has been driven by the Energy sector, which has risen 11.8% during the quarter, followed by the Tech (+3.0%) and Financials (+2.1%) sectors.
Those along with Industrials (+1.1%) have outweighed seven sectors easing back led by the Materials (-9.1%), Staples (-3.4%), and Health Care (-2.6%) sectors.
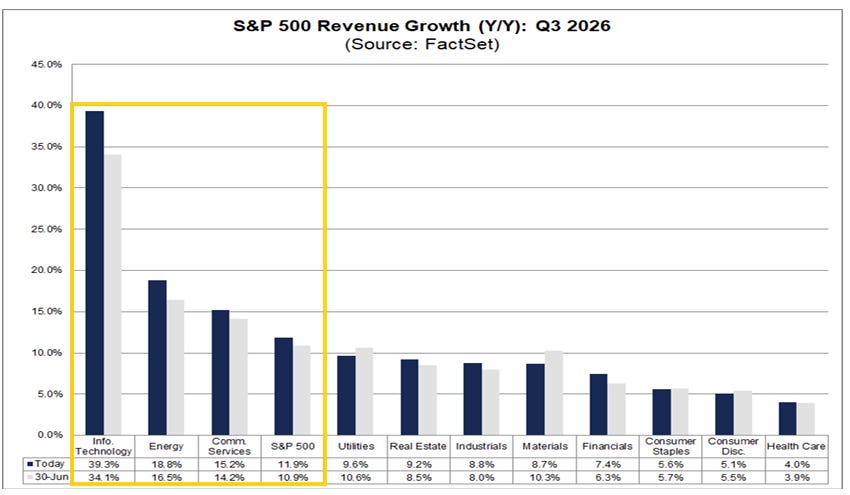
Q3 revenue growth is expected at a likewise stellar +11.9%, down from +15.5% in Q2, which though was the best since Q4 2021 (16.1%). It would mark the third consecutive quarter of double-digit revenue growth for the index.
Expectations are led by Tech (+37.7%), Energy (+18.8%), and Communications (+15.2%).
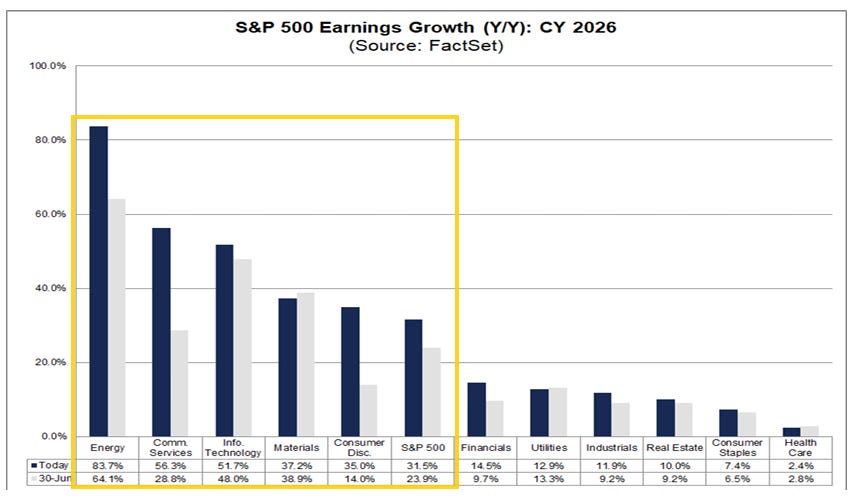
Andthose rising earnings expectations have seen 2026 SPX earnings growth expectations also continue to ratchet higher now at +31.5%, up from +25.4% on June 30th, +17.1% on March 31st, and over double the +14.8% at the start of the year.
As in 2025, Tech is a leader with y/y earnings growth of +51.2% (up from +28.6% at the start of the year) but Energy will exceed that (on a percentage basis) at +82.8% (up from +6.4% at the start of the year) along with Communications +55.6%. Those sectors along with Materials (+37.1%) and Consumer Discretionary (+34.7%) represent the five sectors expected to come in above the SPX average.
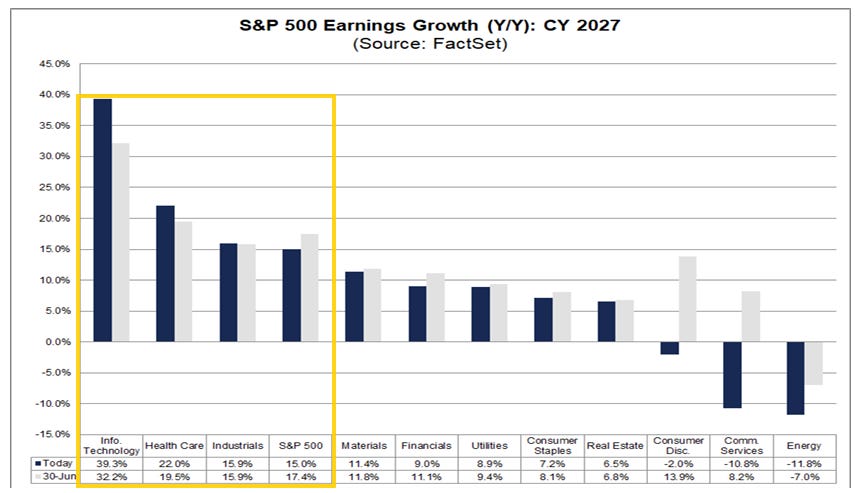
And 2027 earnings are expected to be up another +15.0% on top of the elevated 2026 results, which is down though from +17.4% as of June 30th as analysts are not carrying over all (but still most of) the boosts in 2026 earnings to next year (such as the investment gains by some hyperscalers). That’s also down from +16.5% at the start of the second quarter (Apr 1st). Still it’s a double digit advance on top of what is expected to be a 30%+ gain in 2026. That would also represent a fourth straight year of double-digit earnings growth for the S&P 500, something we’ve rarely seen..
2027 is expected to be led again by Tech (+39.3%, up from 24.6% at the start of the second quarter (April 1st) despite the huge increase in 2026 estimates) followed by Health Care (+22.0%) which is expected to see a big turnaround after lagging in 2026. Industrials (+15.9%) is also above the SPX average.
With hyperscaler investment gains expected to slow, the sectors that have seen the biggest boosts from that are now expected to see negative y/y growth (Comm Services (-10.8% from +8.2% at the start of the third quarter) and Consumer Discretionary (-2.0% from +13.9%)) along with Energy (-11.8%).
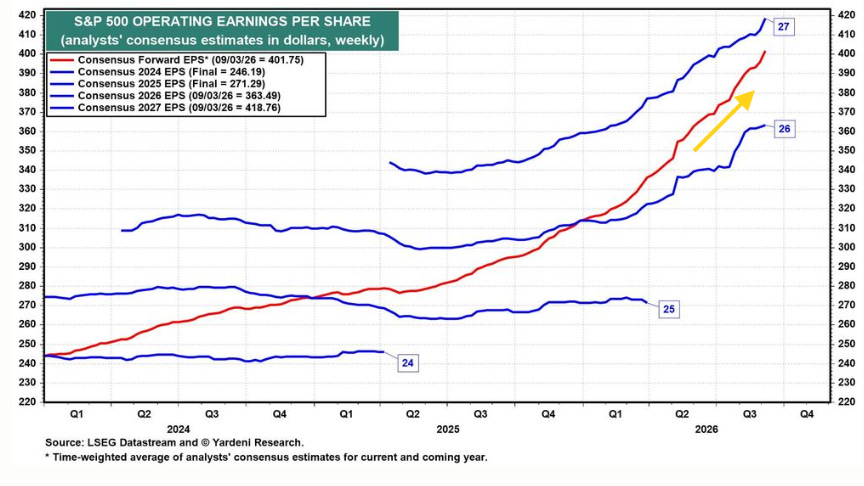
Forward earnings rose to a record $401.75 per share last week (chart). It is converging toward the year-end consensus estimate for 2027, which just jumped to $418.76, exceeding the $415.00 we set as our year-end target for both series.
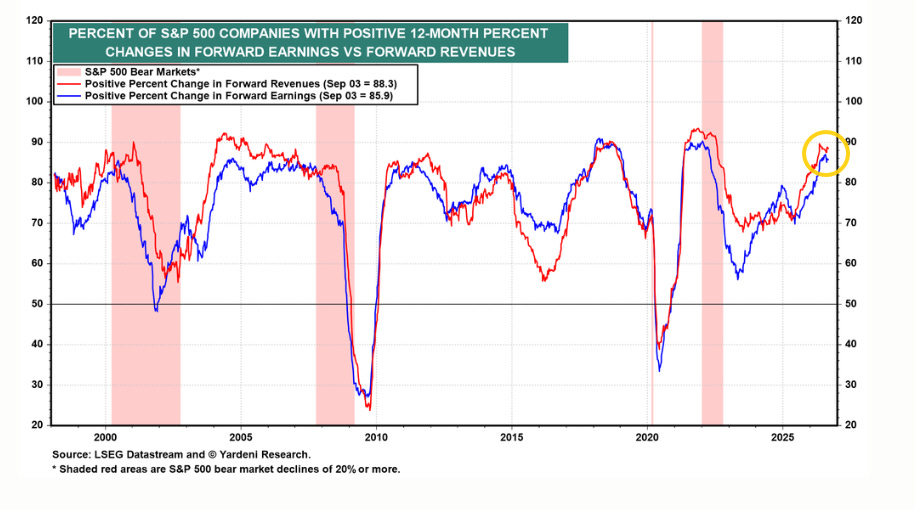
The strength in earnings is broad-based. Some 88.3% of S&P 500 companies currently have positive 12-month changes in forward revenues, and 85.9% have positive changes in forward earnings (chart).
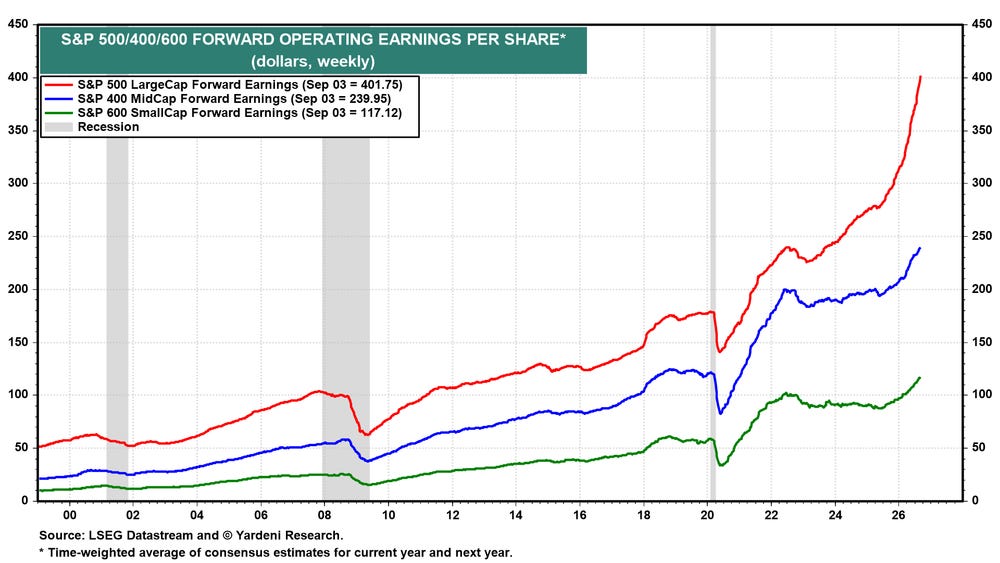
It is not just a LargeCap story, either. Forward earnings for the S&P 500, S&P 400, and S&P 600 all are rising to record highs together (chart).
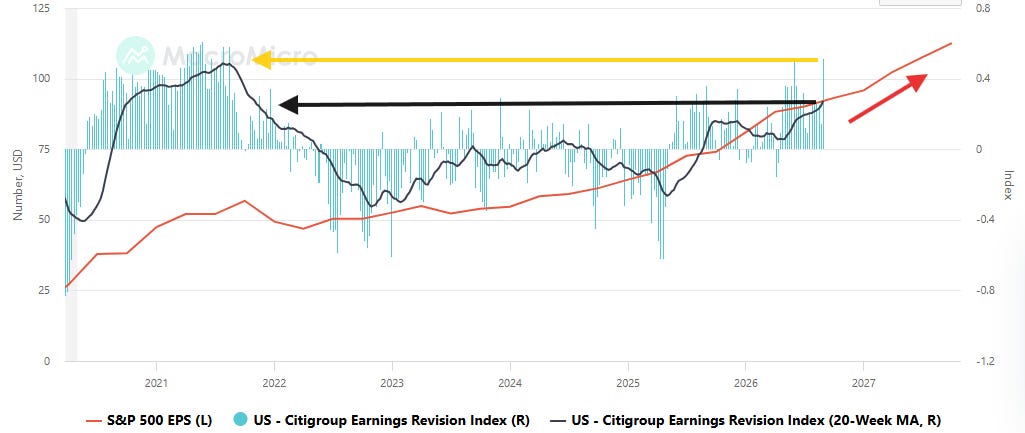
And earnings expectations continue to be supported by very strong earnings revisionswhich jumped in the week of August 28th to the joint highest (with May 29th) since August 2021. That continues a 19-week streak of positive revisions something we also haven’t seen sincelate 2021 into early 2022.
As a result, the 20-week moving average (black line) lifted to the best since October 2021, as 12-month out EPS estimates (red line) continue to rise to new highs, as they’ve done each week since the turn of the year.
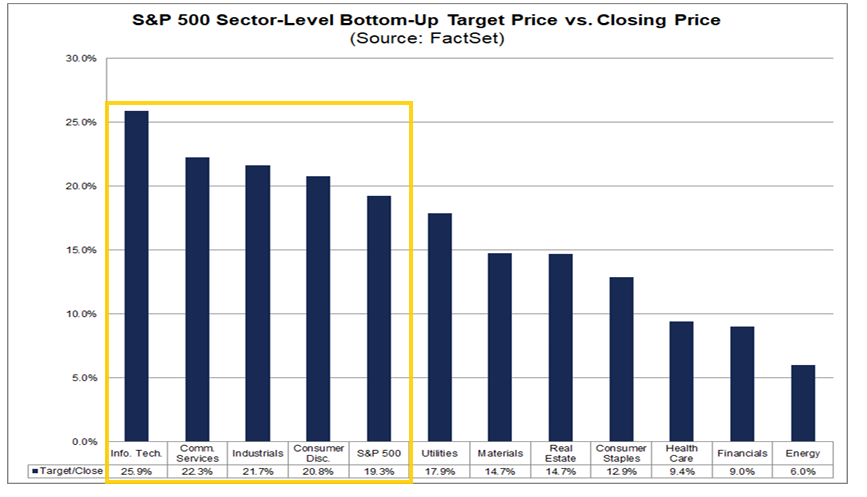
Analysts also collectively continue to think that the S&P 500 has a lot of upside with FactSet’s compilation of analyst bottom-up SPX 12-month price targets up to 9,241 (~955 pts since March 31st, ~+2,130 pts since Thanksgiving, and ~+3,080 pts since July 1, 2025). That would be +19.3% from Thursday’s close.
Tech (+25.9%) has overtakenCommunications (+22.3%) as the sector seen with the biggest upside, followed by Industrials (+21.7%). On the other side Energy (+6.0%) remains the sector with the least upside.
As a reminder we started the year with a 12-month bottom-up price target of 8,000 and according to FactSet the last 20 yrs (through 2024) analysts have been on avg +5.9% too high from where they start the year, but they have underestimated it five of the past six years (including 2025 when they saw 6,755 at the start of the year and we ended at 6,845).
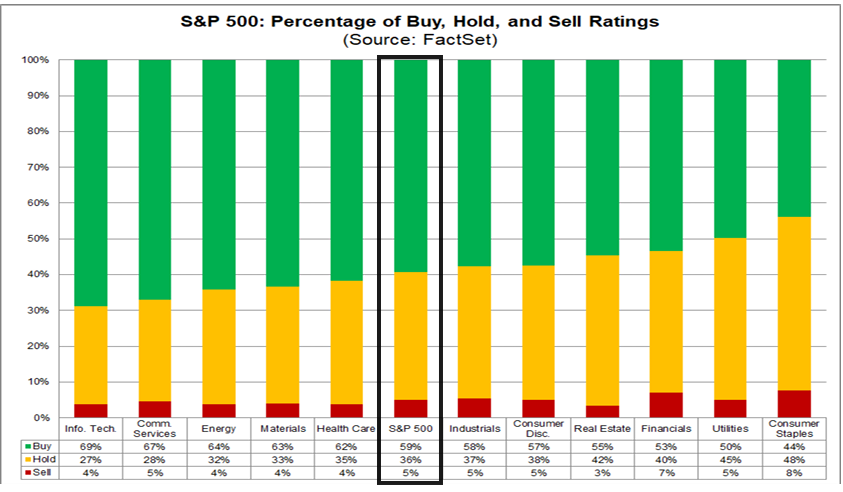
In terms of analyst ratings, buy and hold ratings continue to dominate with buy ratings at 59.2% seven tenths below the record high of 59.9% the last week of April. The 5-year month-end average though is 55.8% according to FactSet, so we’re well above that.
Hold ratings are at 35.9%, off the 35.4% record low (to 2009), but well below the 5-year month-end average of 38.7%, with sell ratings at 4.9%, remaining in their narrow range since 2009 but below the 5-year month end average of 5.6%.
Tech leads in buy ratings (69%) while Staples leads in sell ratings (8%).
These numbers have not changed much over the past month.
Valuations Remain Relatively Attractive
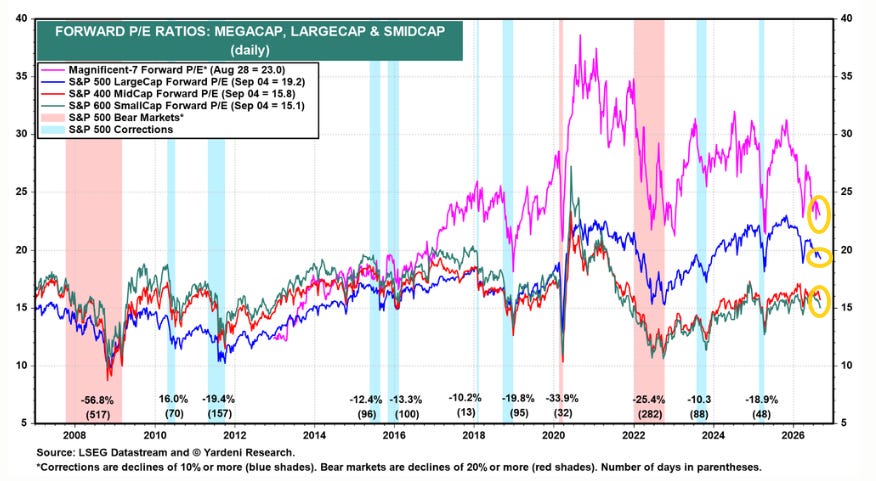
The relatively modest increase in the S&P 500 since the start of the third quarter (+2.8%) versus the huge increase in earnings expectations has seen valuations (price to next-twelve-month earnings) remain near the least since April (and for the Mag-7 since April 2025).
While earnings are soaring, valuation multiples are contracting. The S&P 500 forward P/E is 19.2, with the S&P 400 at 15.8 and the S&P 600 at 15.1 (chart). All three are down in recent weeks. FEMO isn’t being matched by fear of missing out (FOMO). As a result, investors are getting more earnings per dollar than they were at the start of the year.
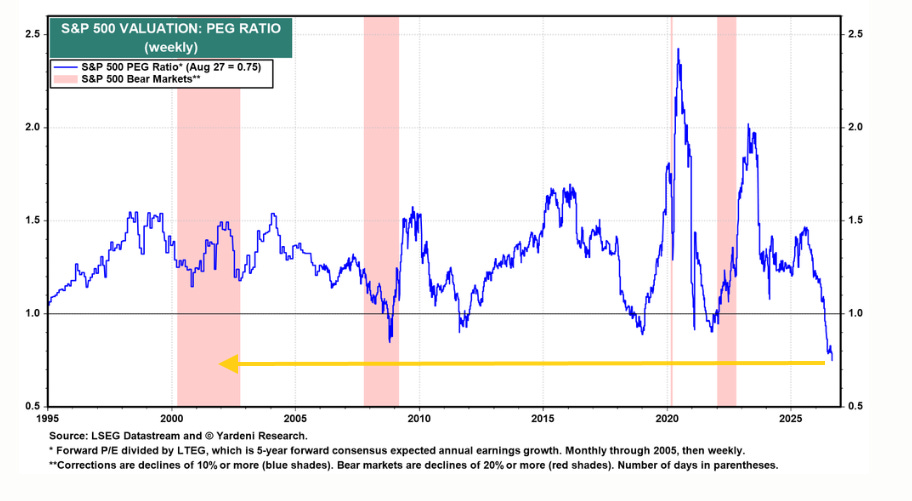
The PEG ratio tells the same story. It has fallen to 0.75, the lowest reading of its 30-year history (chart). Investors are skeptical of industry analysts’ heady earnings expectations.
Mixed Breadth
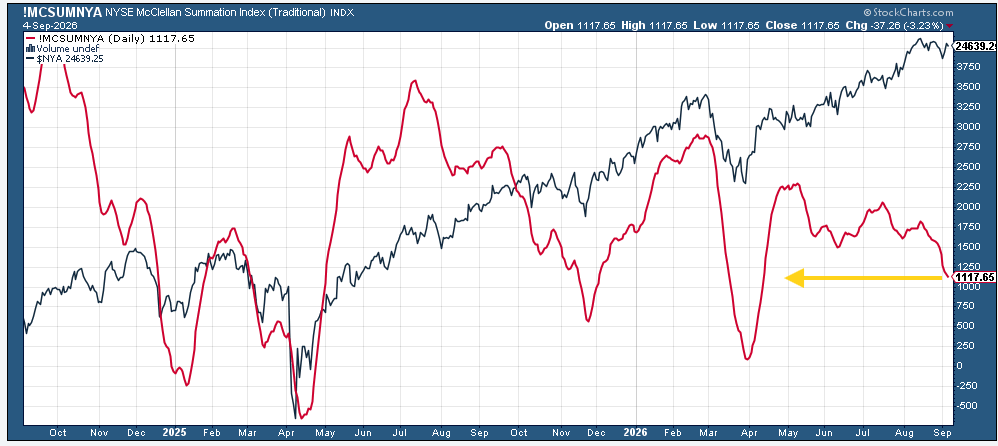
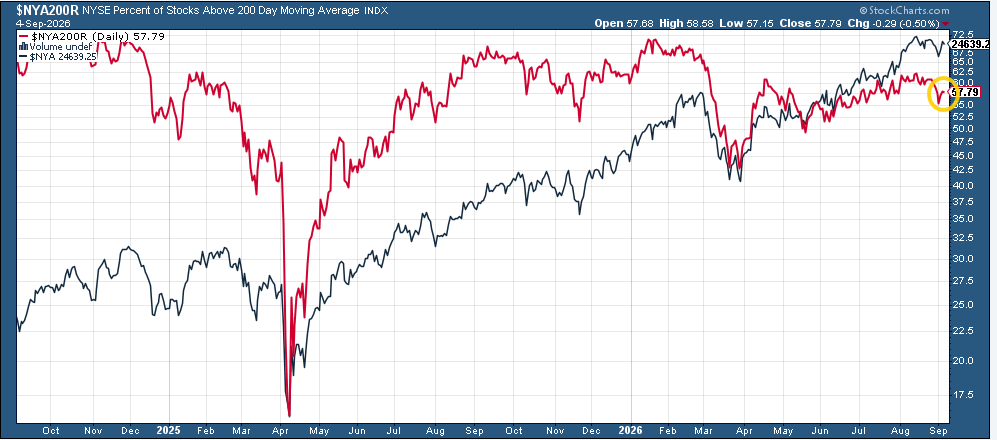
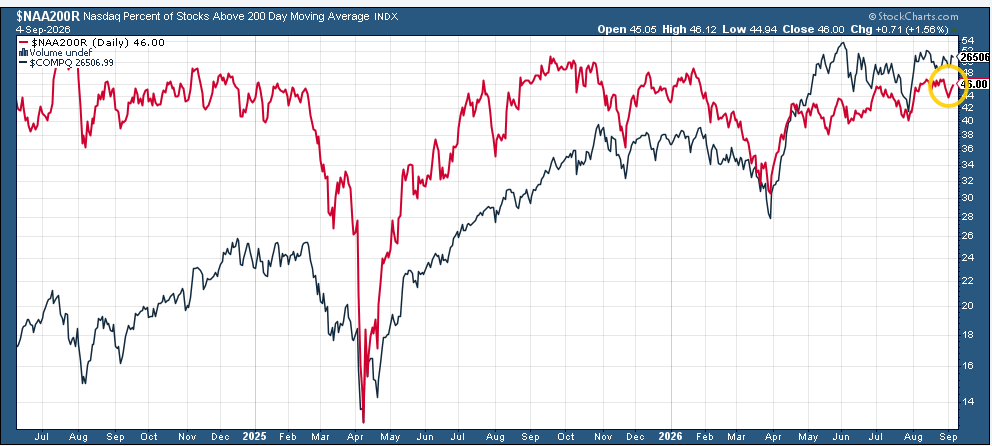
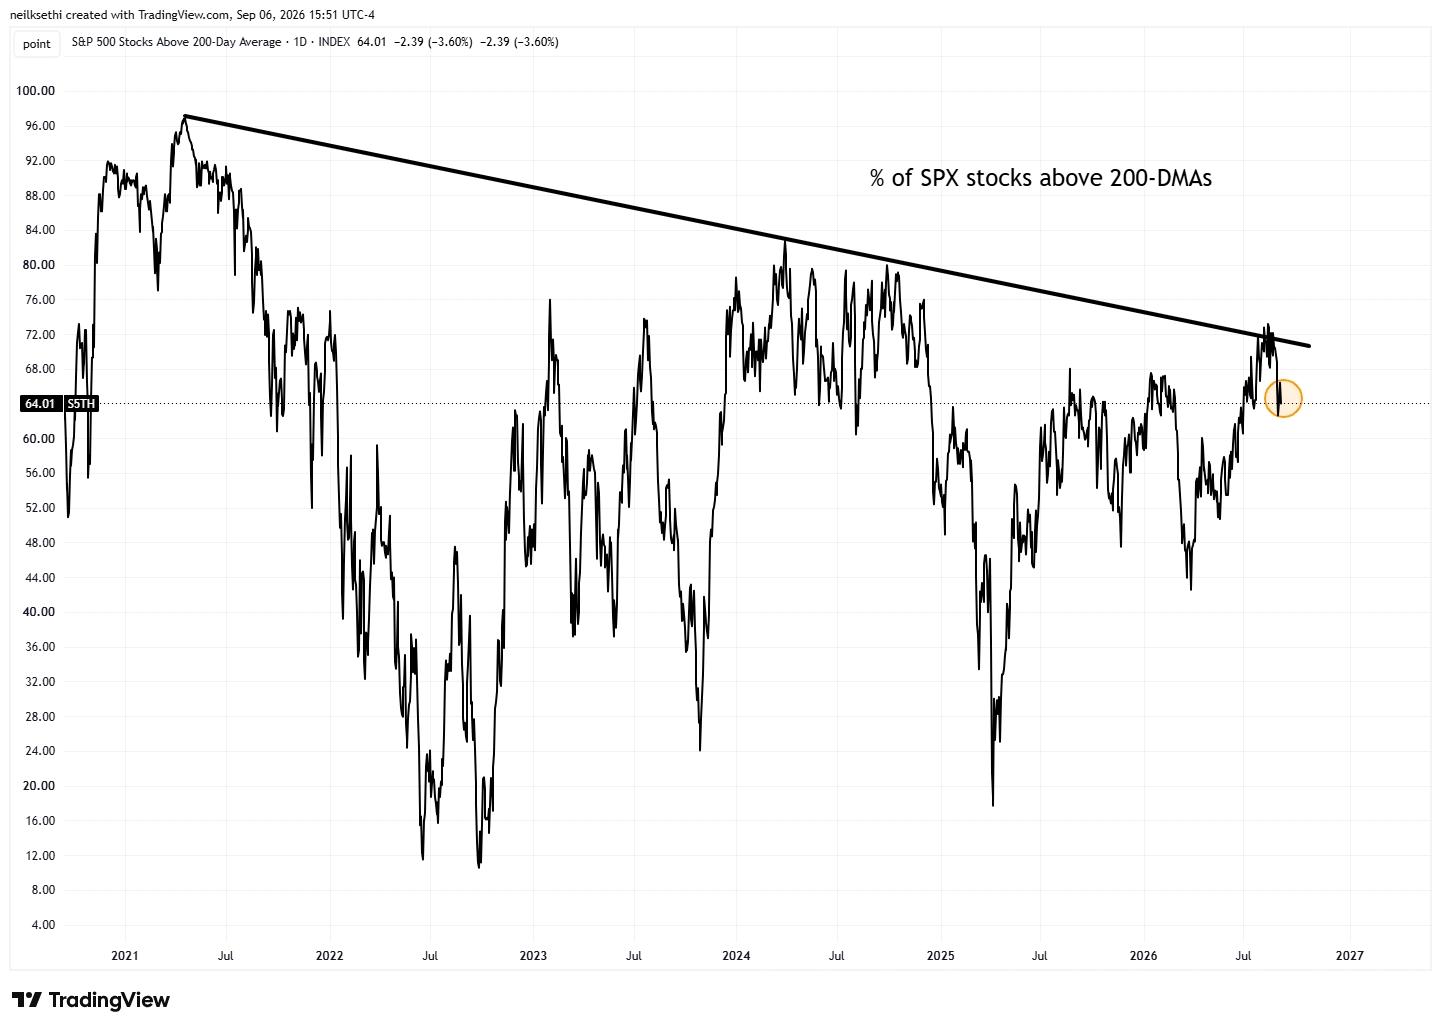
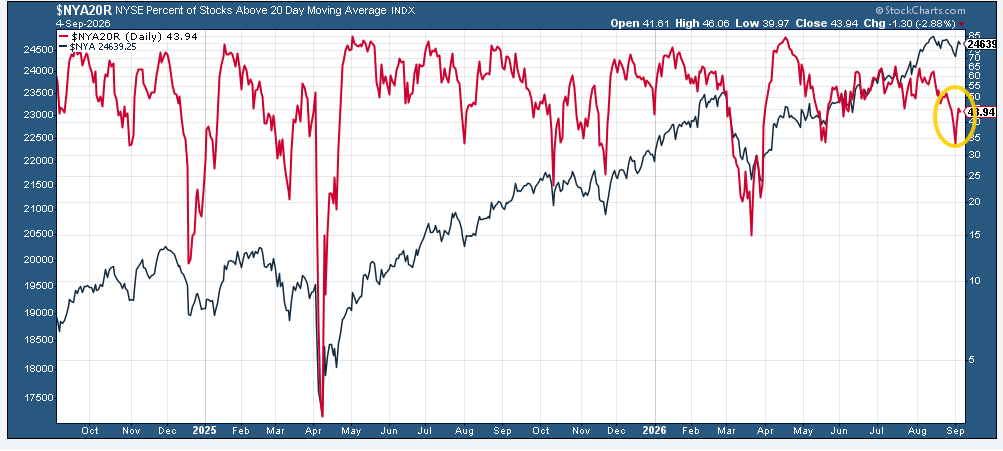
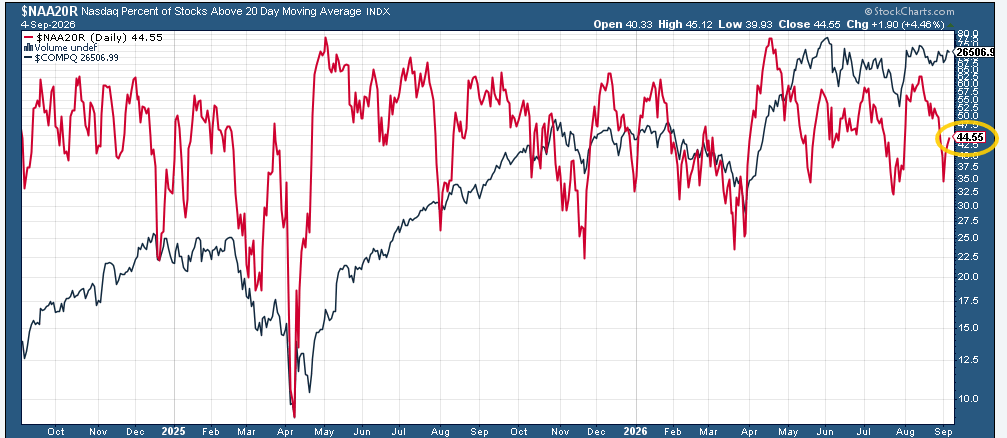
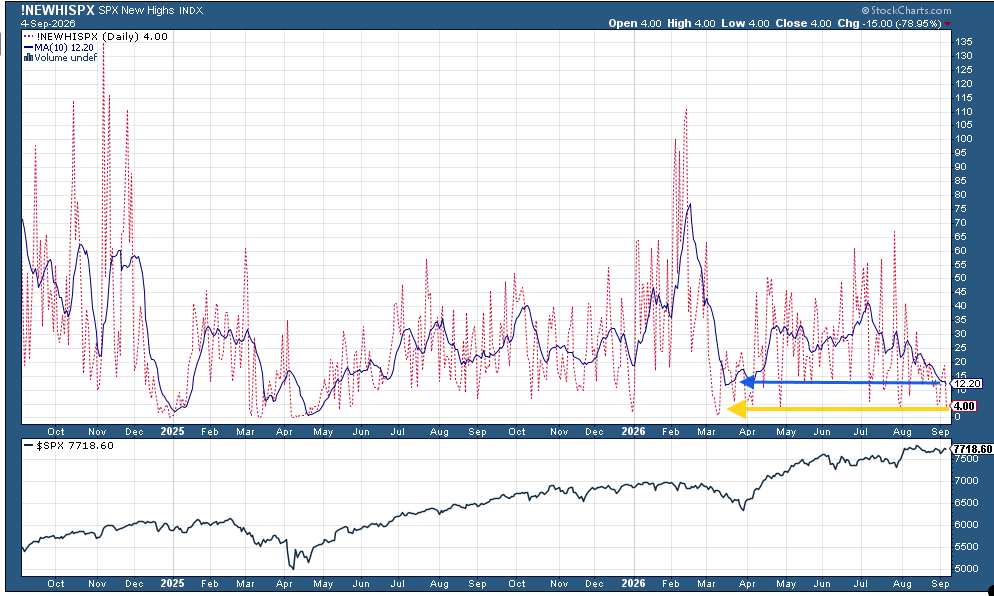
Breadth, which made incremental improvement at the beginning of August, but turned weaker since then saw a bounce in several indicators last week. It remains though significantly below the best of the year.
The McClellan Summation Index (“what the average stock is doing”) fell to the least since April.
Percentage of stocks over 200-DMAs (red lines) started the week the least since June but saw some rebound on the NYSE, and Nasdaq remains near the highest since the start of the year.
While SPX percent of components above their 200-DMAs bounced after falling to the least since July last week.
While shorter-term 20-DMAs saw a bigger bounce (after more deterioration).
SPX new 52-week new highs minus new lows deteriorated to just 4 Friday, the joint least since April with the 10-DMA (blue line) falling to the least since March.
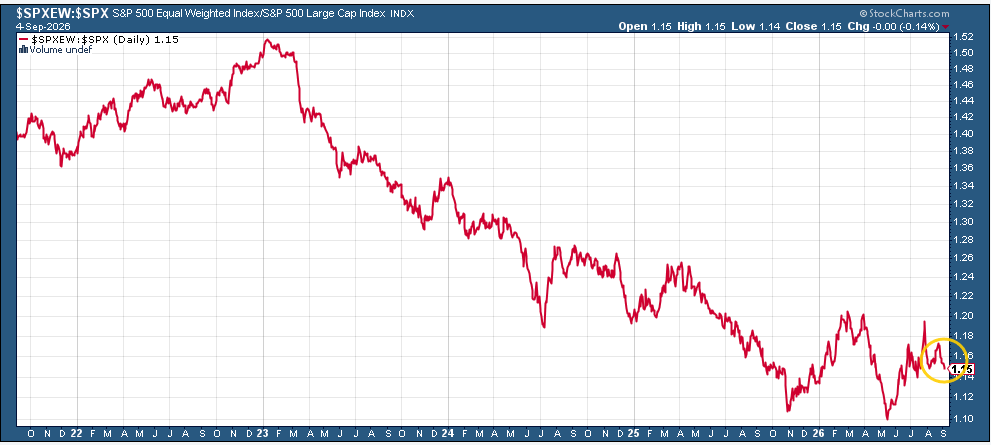
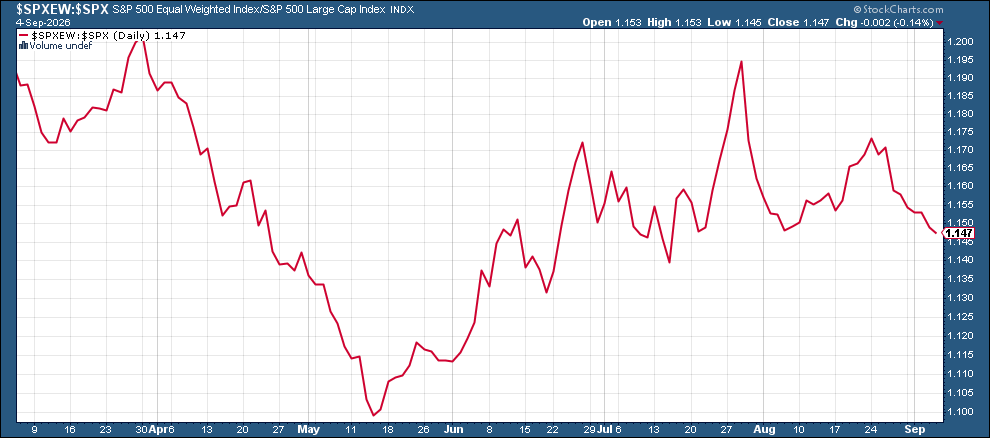
And the ratio of the equal-weight SPX to the cap-weighted eased back towards the least since July.
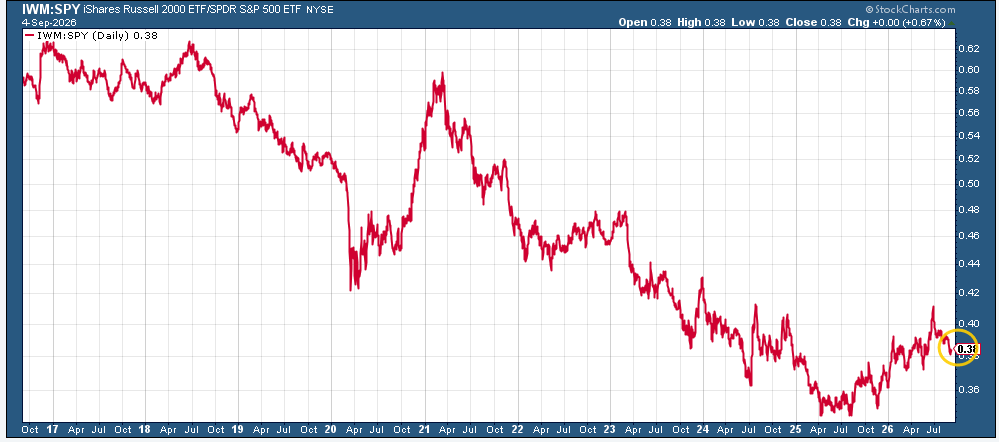
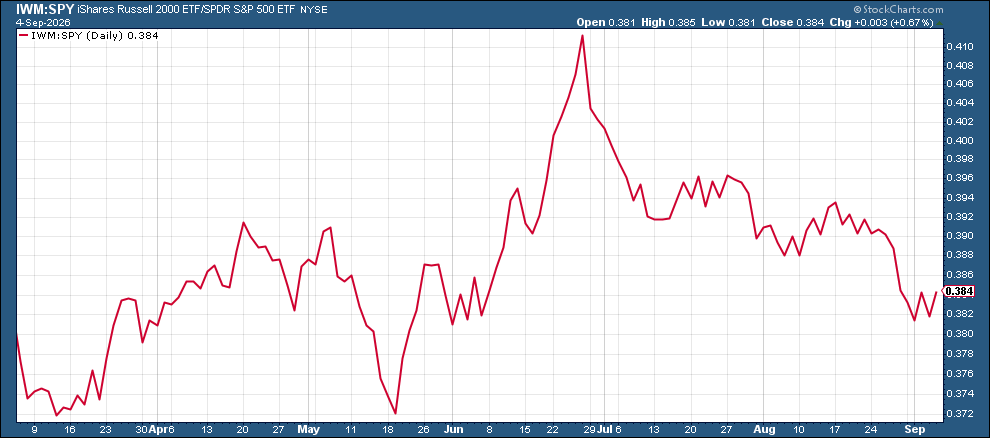
While the ratio of small caps to large caps (Russell 2000 to SPX) ended just off the least since May.
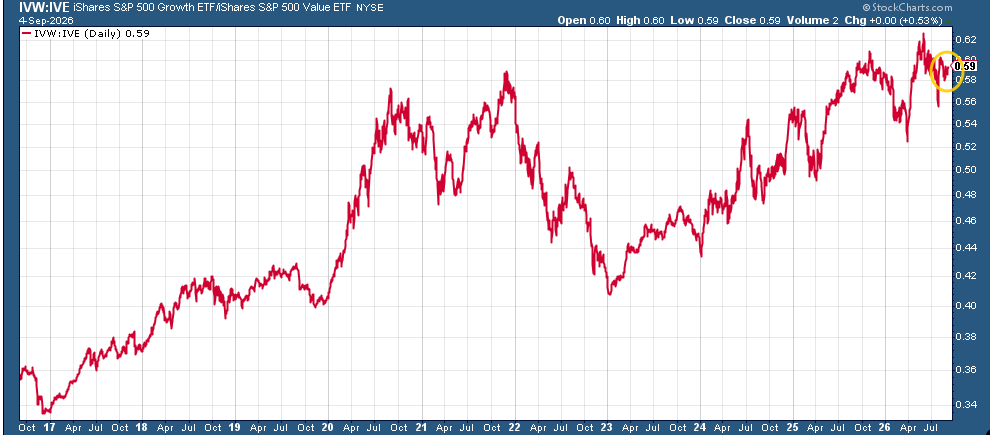
While S&P 500 growth/value remained just off its all-time high from May.
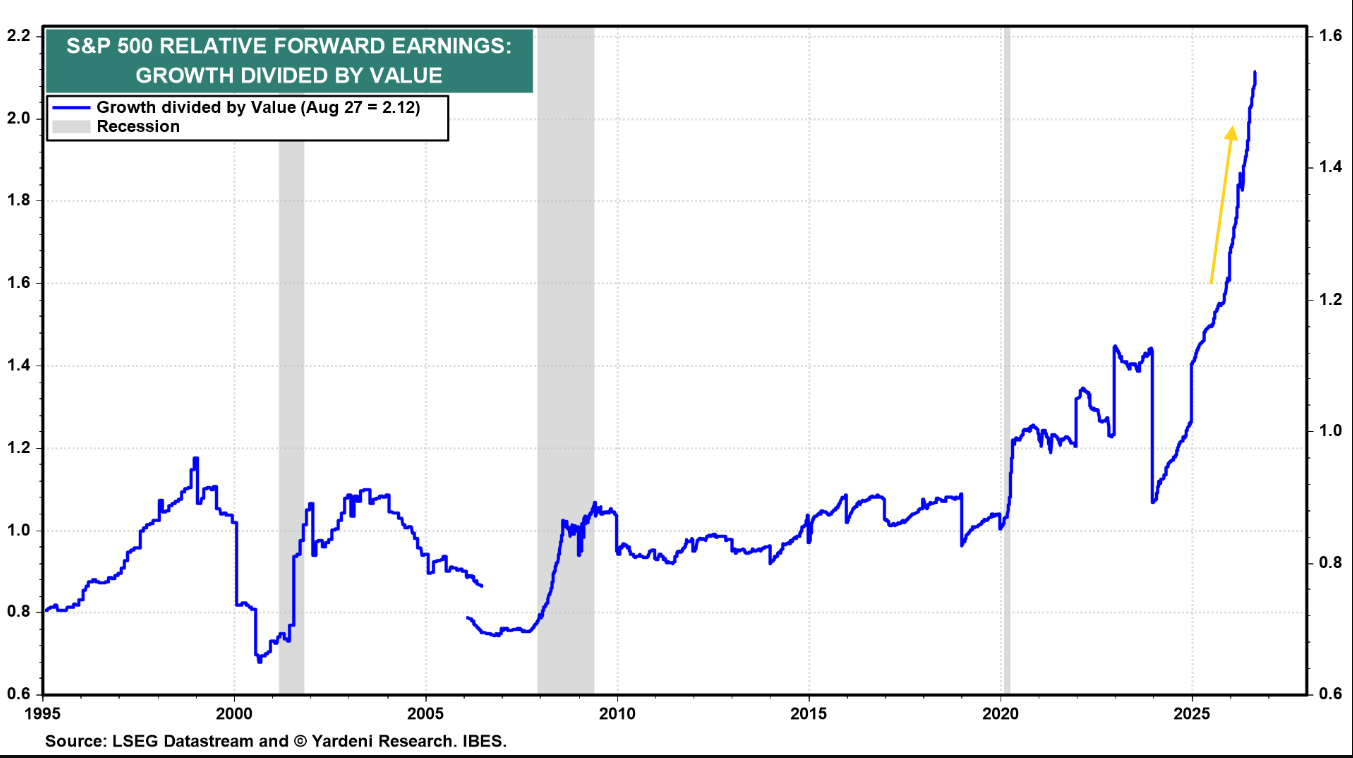
As the ratio of forward earnings for growth/value pushed to a new all-time high at 2.12.
Positioning Continues to Rebuild But Not Yet Broadly Extended
Turning to equity market positioning, after dropping back in July, positioning continues to rebuild.
Deutsche Bank:
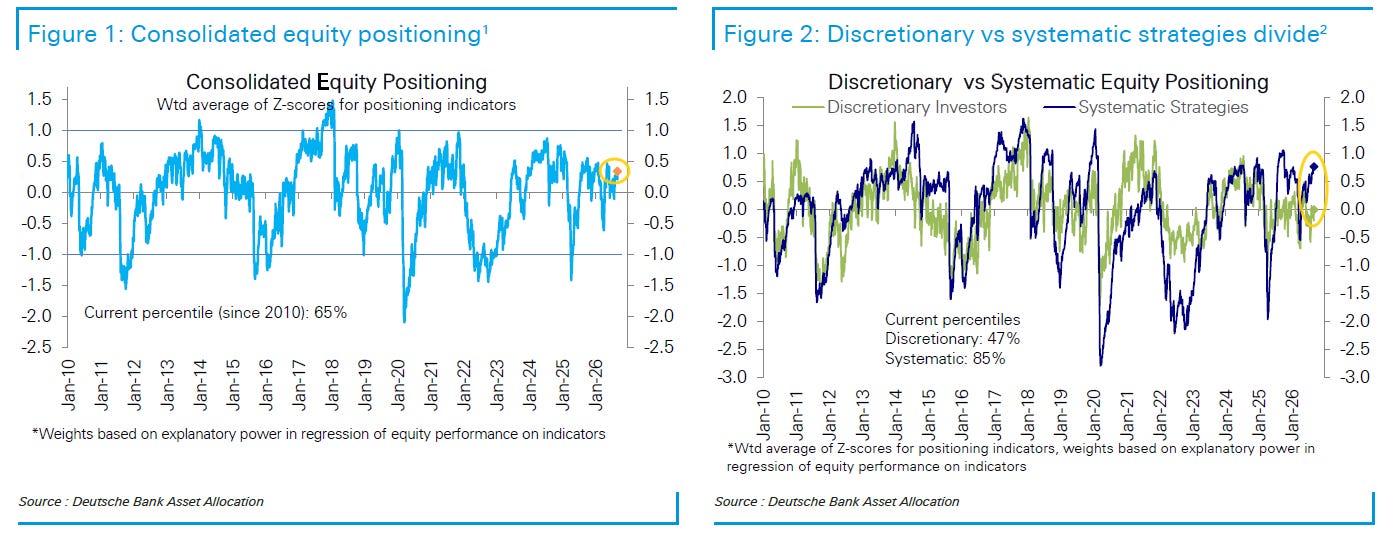
Our measure of aggregate equity positioning edged up and remained modestly overweight at 0.34 standard deviations, or the 65th percentile.
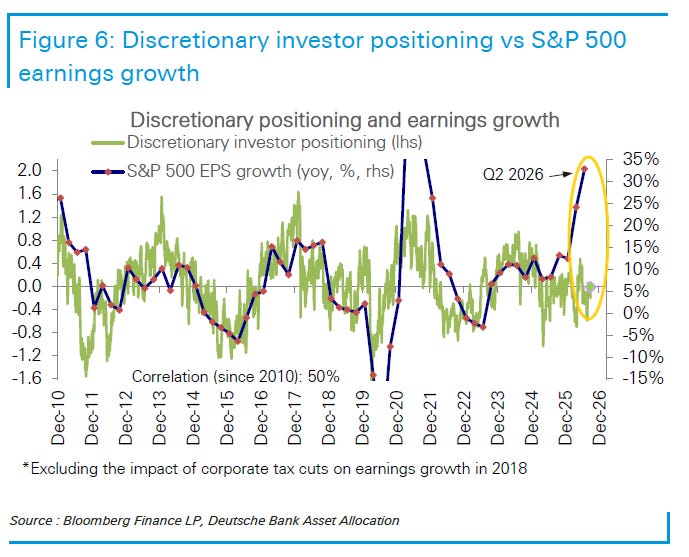
Discretionary investor positioning rose to neutral at -0.01 standard deviations, or the 47th percentile, while systematic strategies’ positioning edged higher and remained overweight at 0.76 standard deviations, or the 85th percentile.
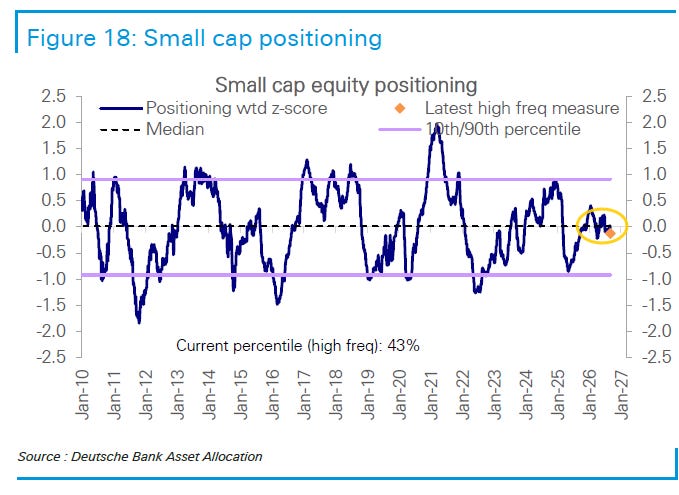
Large-cap positioning also rose modestly to 0.63 standard deviations, or the 87th percentile. It remains overweight but well below extreme levels. Small-cap positioning, however, slipped to slightly underweight at -0.13 standard deviations, or the 43rd percentile.
Overall, equity positioning has moved sideways and is still well below levels implied by earnings growth.
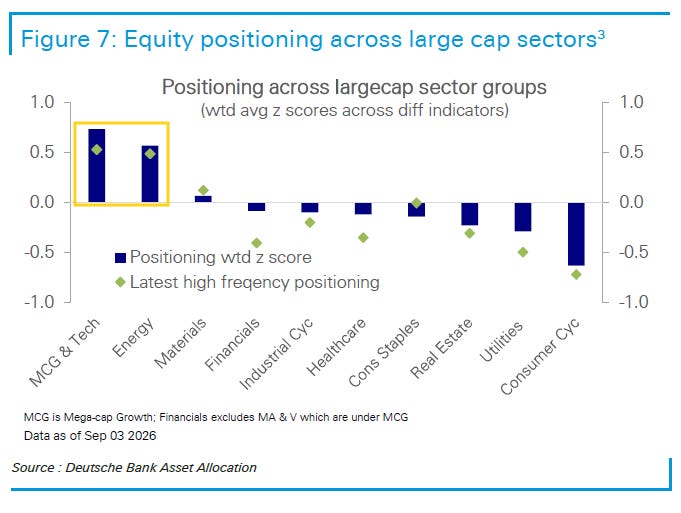
Across sectors, positioning is overweight in Tech and Energy, while it is neutral or underweight elsewhere.
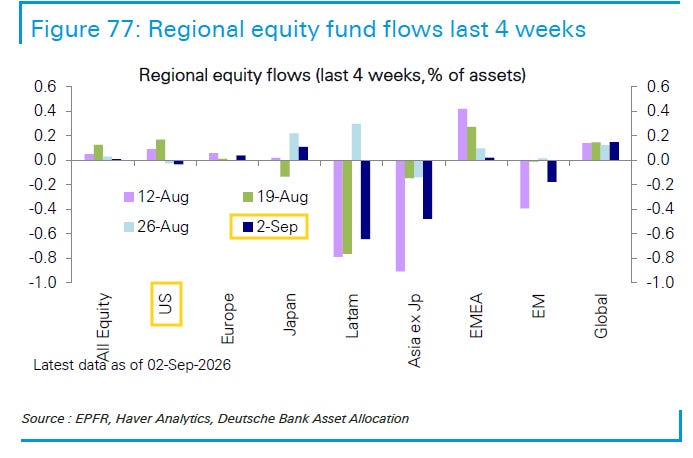
Inflows to equity funds totaled $2.8 billion this week, slowing sharply to the lowest level in two months. Inflows to broad-global funds ($11.8 billion), Japan ($1.4 billion), and Europe ($0.8 billion) were largely offset by outflows from the US (-$5.9 billion), China (-$5.2 billion), and Taiwan (-$1.7 billion).
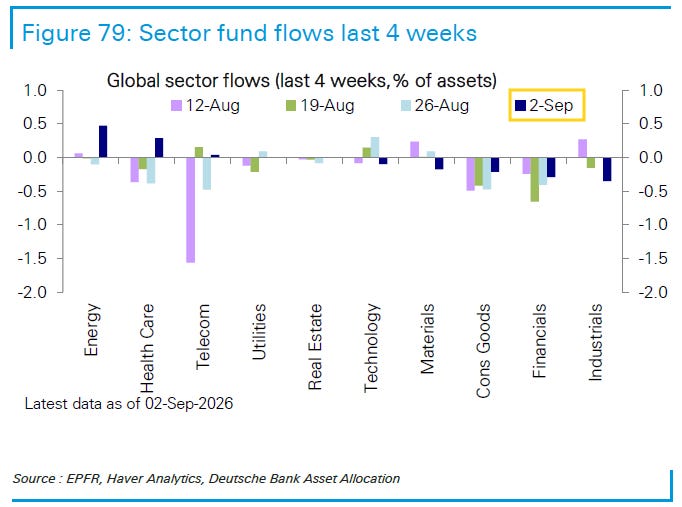
Most sectors saw outflows, led by Tech (-$1.5 billion), its first outflow in three weeks, and Financials (-$0.9 billion), which has now seen outflows for five consecutive weeks. Energy ($0.9 billion) and Health Care ($0.8 billion) were the exceptions, attracting inflows.
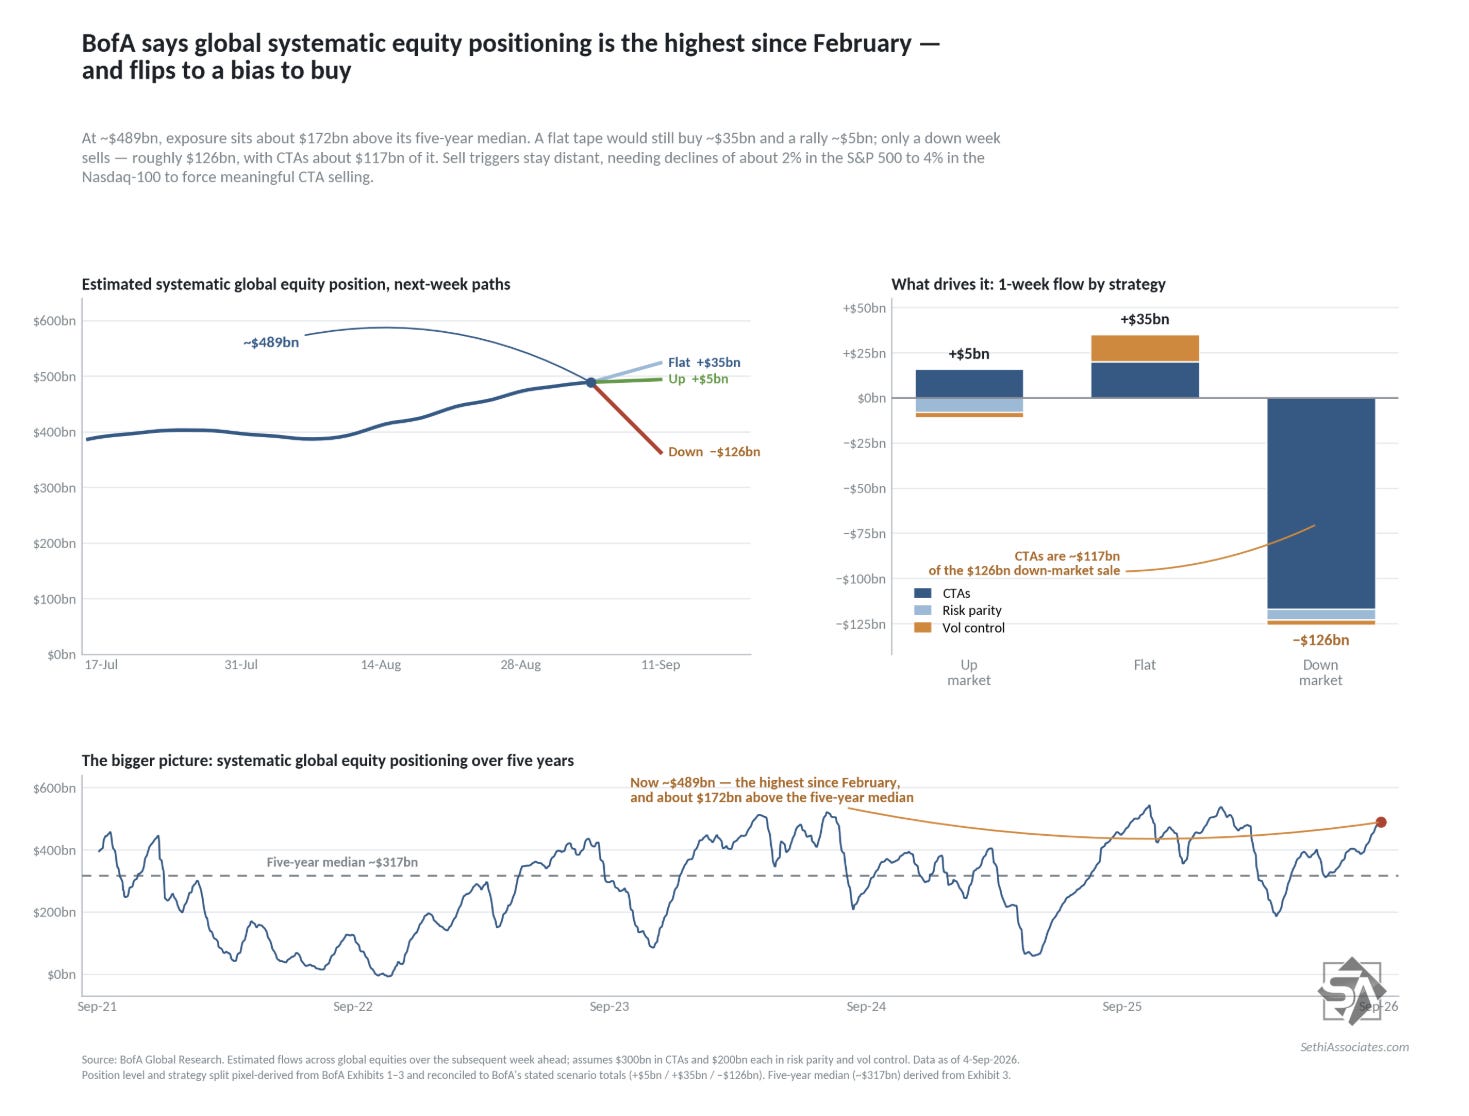
BofA sees overall systematic positioning in global equities as having extended positioning further, now nearing the top of its 5-year range (the highest since February). And after briefly flipping to a bias to sell across all scenarios last week — the first time in a month — they are back to a bias to buy, selling only in a significant move to the downside, where the bulk of the risk still sits though.
The first layer of sell triggers remain around 2% lower for the S&P 500 and Russell 2000 while the Nasdaq-100 has more cushion (~−4%).
Specifically they see:
+$35B of buying in a flat market (from −$1B of selling the prior week);
+$5B of buying in an “up” market (from −$9B; “up market” defined as the 97.5th percentile price path or ~+3.5%, similar to Goldman); and
−$126B of selling in a “down” market (from −$163B last week and −$114B the prior week; “down market” defined as the 2.5th percentile price path or ~−2.9%, different than Goldman who uses −4.5%).
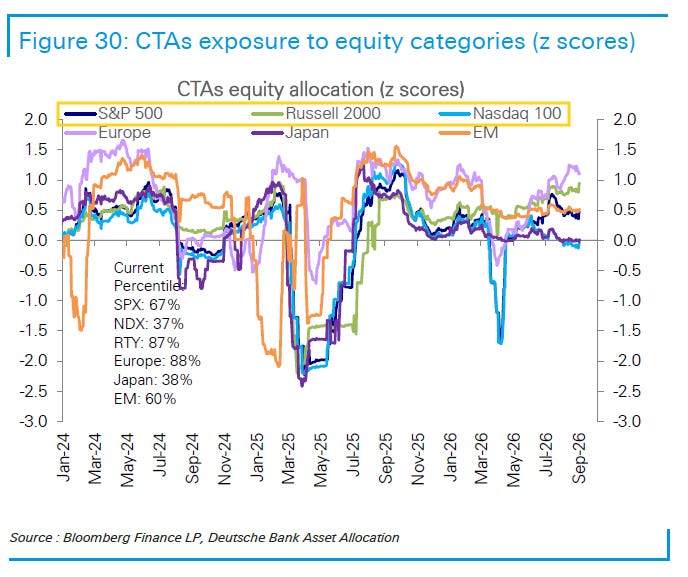
DB also sees global CTA positioning as “elevated” at the 83rd percentile to 2010 although weaker in the US at the 68th percentile, with the Nasdaq-100 continuing to remain at just the 37th while SPX and RUT are at the 67th and 87th respectively.
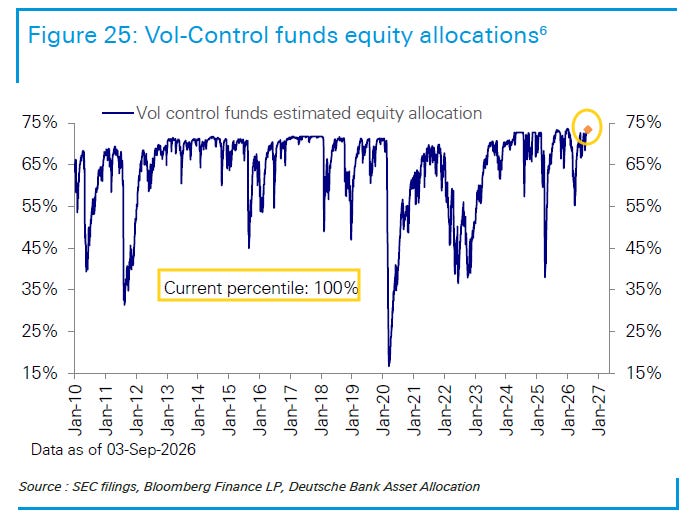
DB’s estimate of vol control* positioning remains, in contrast to their estimates on CTAs, at “historical maximums (100th percentile)” although they find “deleveraging risk remains contained”:
The sensitivity to sell-offs declined over the week, suggesting near-term deleveraging risk remains contained. With positioning at historical highs, funds have limited capacity to add further to equities, while downside flows could accelerate in larger drawdowns.
*vol control strategies enter and exit based on changes in volatility over past windows (mostly 1-month and 3-month).
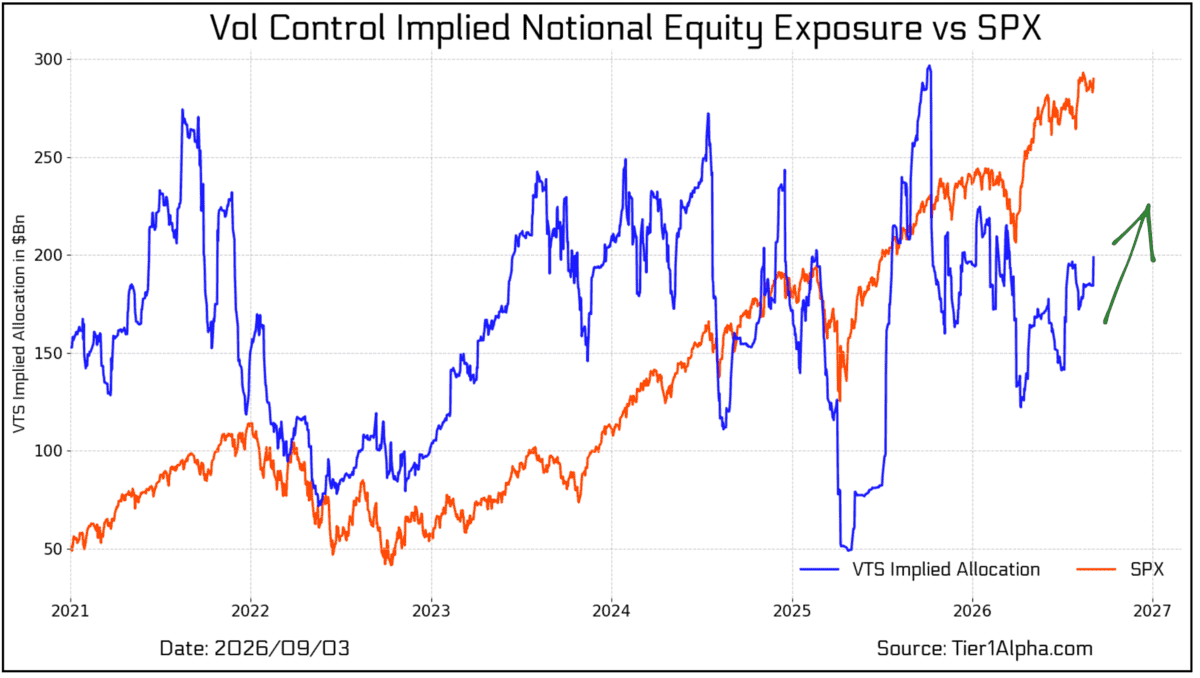
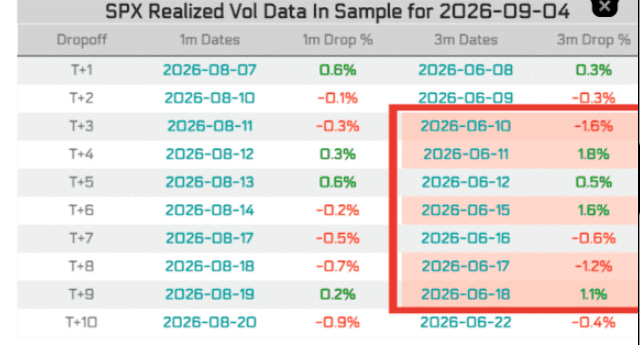
Tier1Alpha as a reminder sees vol control positioning as less extended and they also see scope for adding. FromFriday’s note(as a reminder from last week “1-month realized volatility has now fallen back below the 3-month measure, shifting the 3-month reading into the primary volatility input for funds that deploy volatility scaling as a way to manage risk.”):
systematic positioning remains favorable, particularly from the vol control space, which we estimate added $14 billion in notional buying requirements by the close. As we highlighted yesterday, this positive rebalancing was triggered by a meaningful decline in 3-month realized volatility, as a 2.6% return fell out of its trailing sample data, which is used to calculate the levels.
While we could see some residual buying pressure from that signal today, we expect to see more persistent flows come in later next week, which should continue to add a positive tailwind to the market.
Overall, the combination of positive gamma exposure with incoming systematic flows into next week leaves a favorable structural backdrop for the equity markets, less an exogenous event taking place over the long weekend.
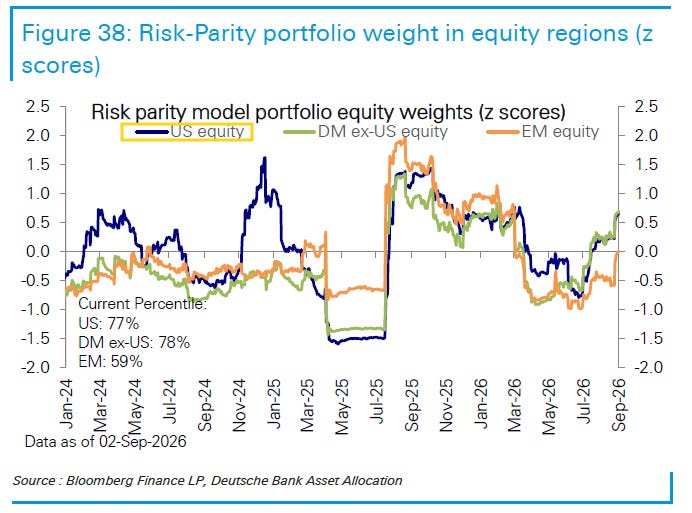
While for risk parity DB says equity positioning “increased this week” for a third week with the US rising to the 77th percentile from the 67th percentile two weeks ago. That leaves it overweight. Bond exposure edged up to the 32nd percentile while commodities remain elevated at the 91st though down from the 96th three weeks ago.
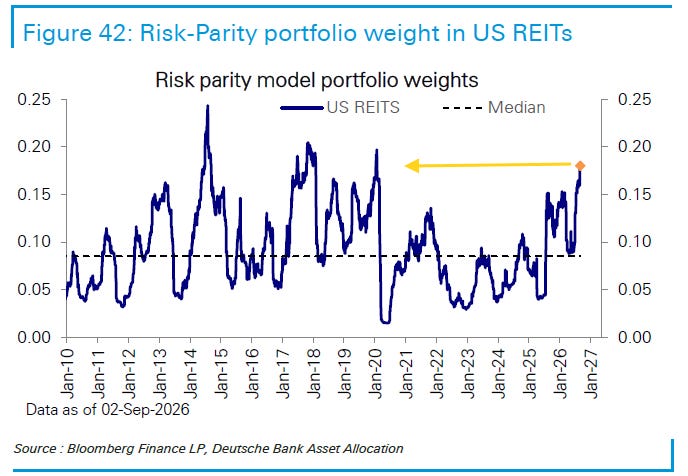
As a side note, risk parity positioning in Real Estate (REITs) is the highest since pre-pandemic (97th percentile).
And Citadel’s Scott Rubner provided one of his great updates:
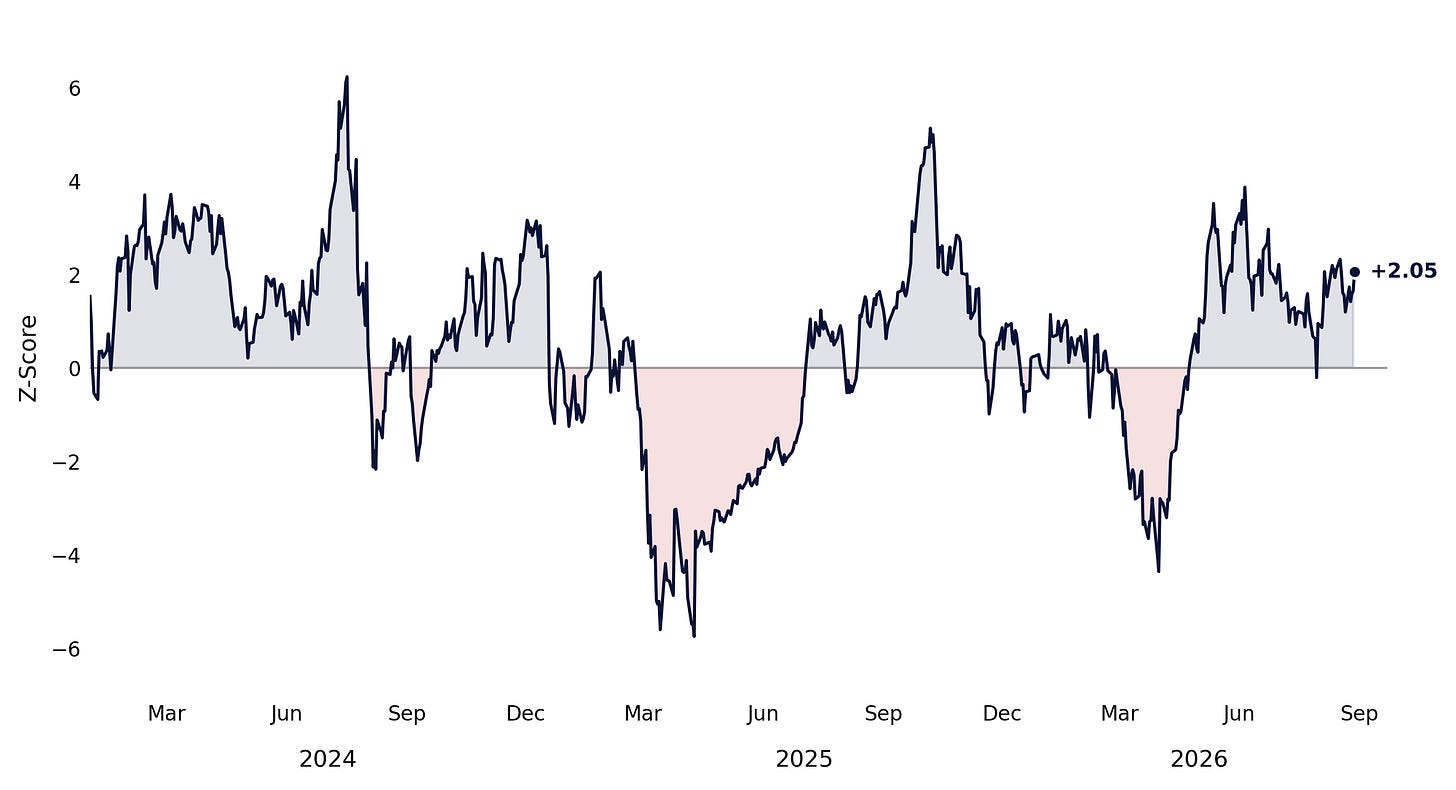
After a month of steady non-fundamental supply, systematic strategies have started to re-add exposure as realized volatility declined. CTA, Vol-Control and Risk-Parity strategies have all rebuilt exposure from the July lows, with the largest increases concentrated in the S&P 500 and Russell 2000, while Nasdaq exposure remains roughly flat.
US Equity Total – CTA Aggregate Positioning – Z-Score of Net Positioning, Since January 2024
Source: Citadel Securities as of August 28, 2026. Figures are for illustrative purposes only. Past performance figures do not guarantee future results.
This was exactly what we were looking for following the July reset. Lower volatility created capacity, and systematic investors began deploying it.
SPX Exposure of Vol-Targeting with 10% Risk – 1-Year Lookback
Source: Bloomberg as compiled by Citadel Securities, Global Market Intelligence, as of August 28, 2026. Figures are for illustrative purposes only. Past performance figures do not guarantee future results.
Positioning is not stretched. But the market no longer has the same reservoir of unused systematic buying capacity that existed immediately following the July reset.
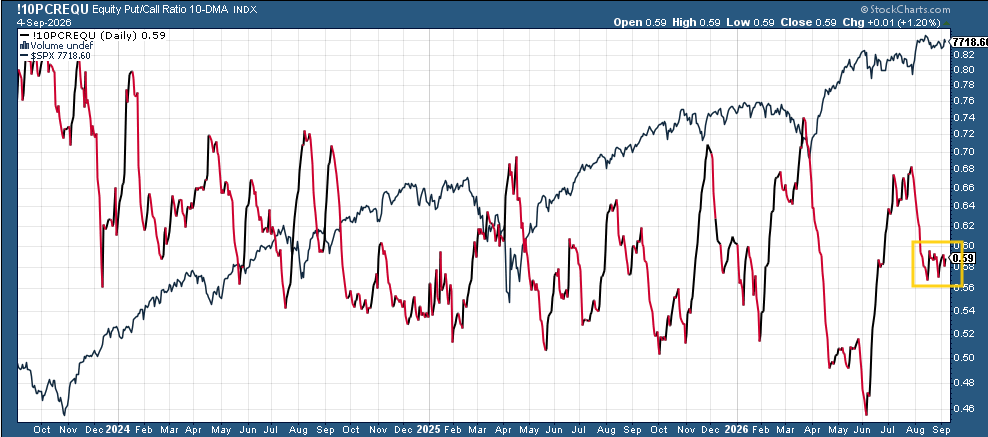
While call buying (which adds incremental upside pressure) remains in the middle of its range this year little changed over the past month.
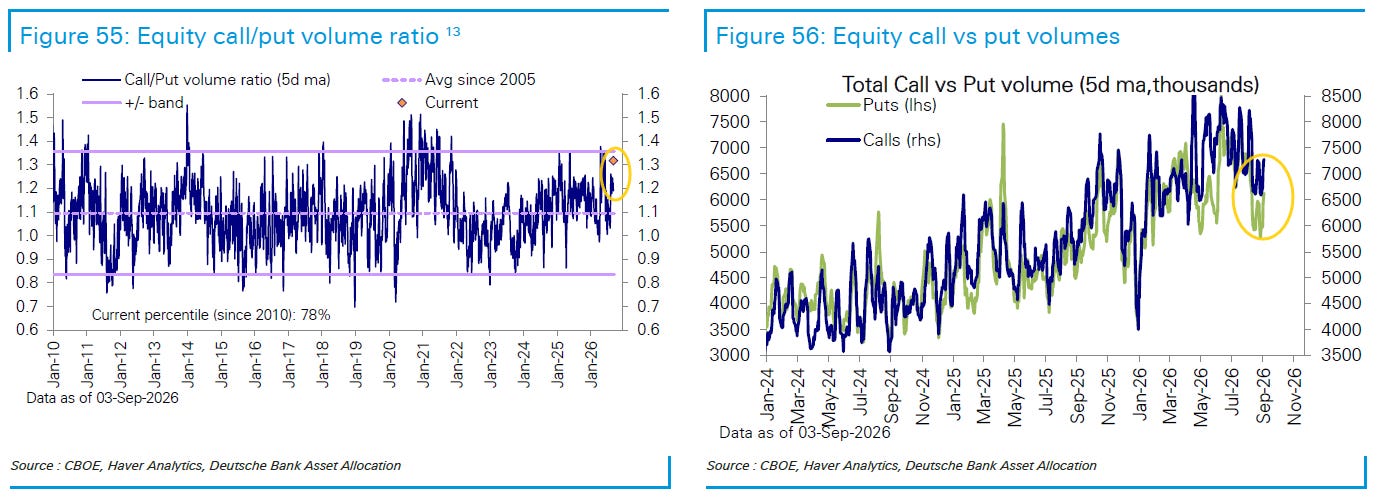
DB similarly said both call and put buying increased this week, but more from the latter seeing the ratio fall back from the 5-year high the previous week (78th percentile to 2010 from the 89th percentile):
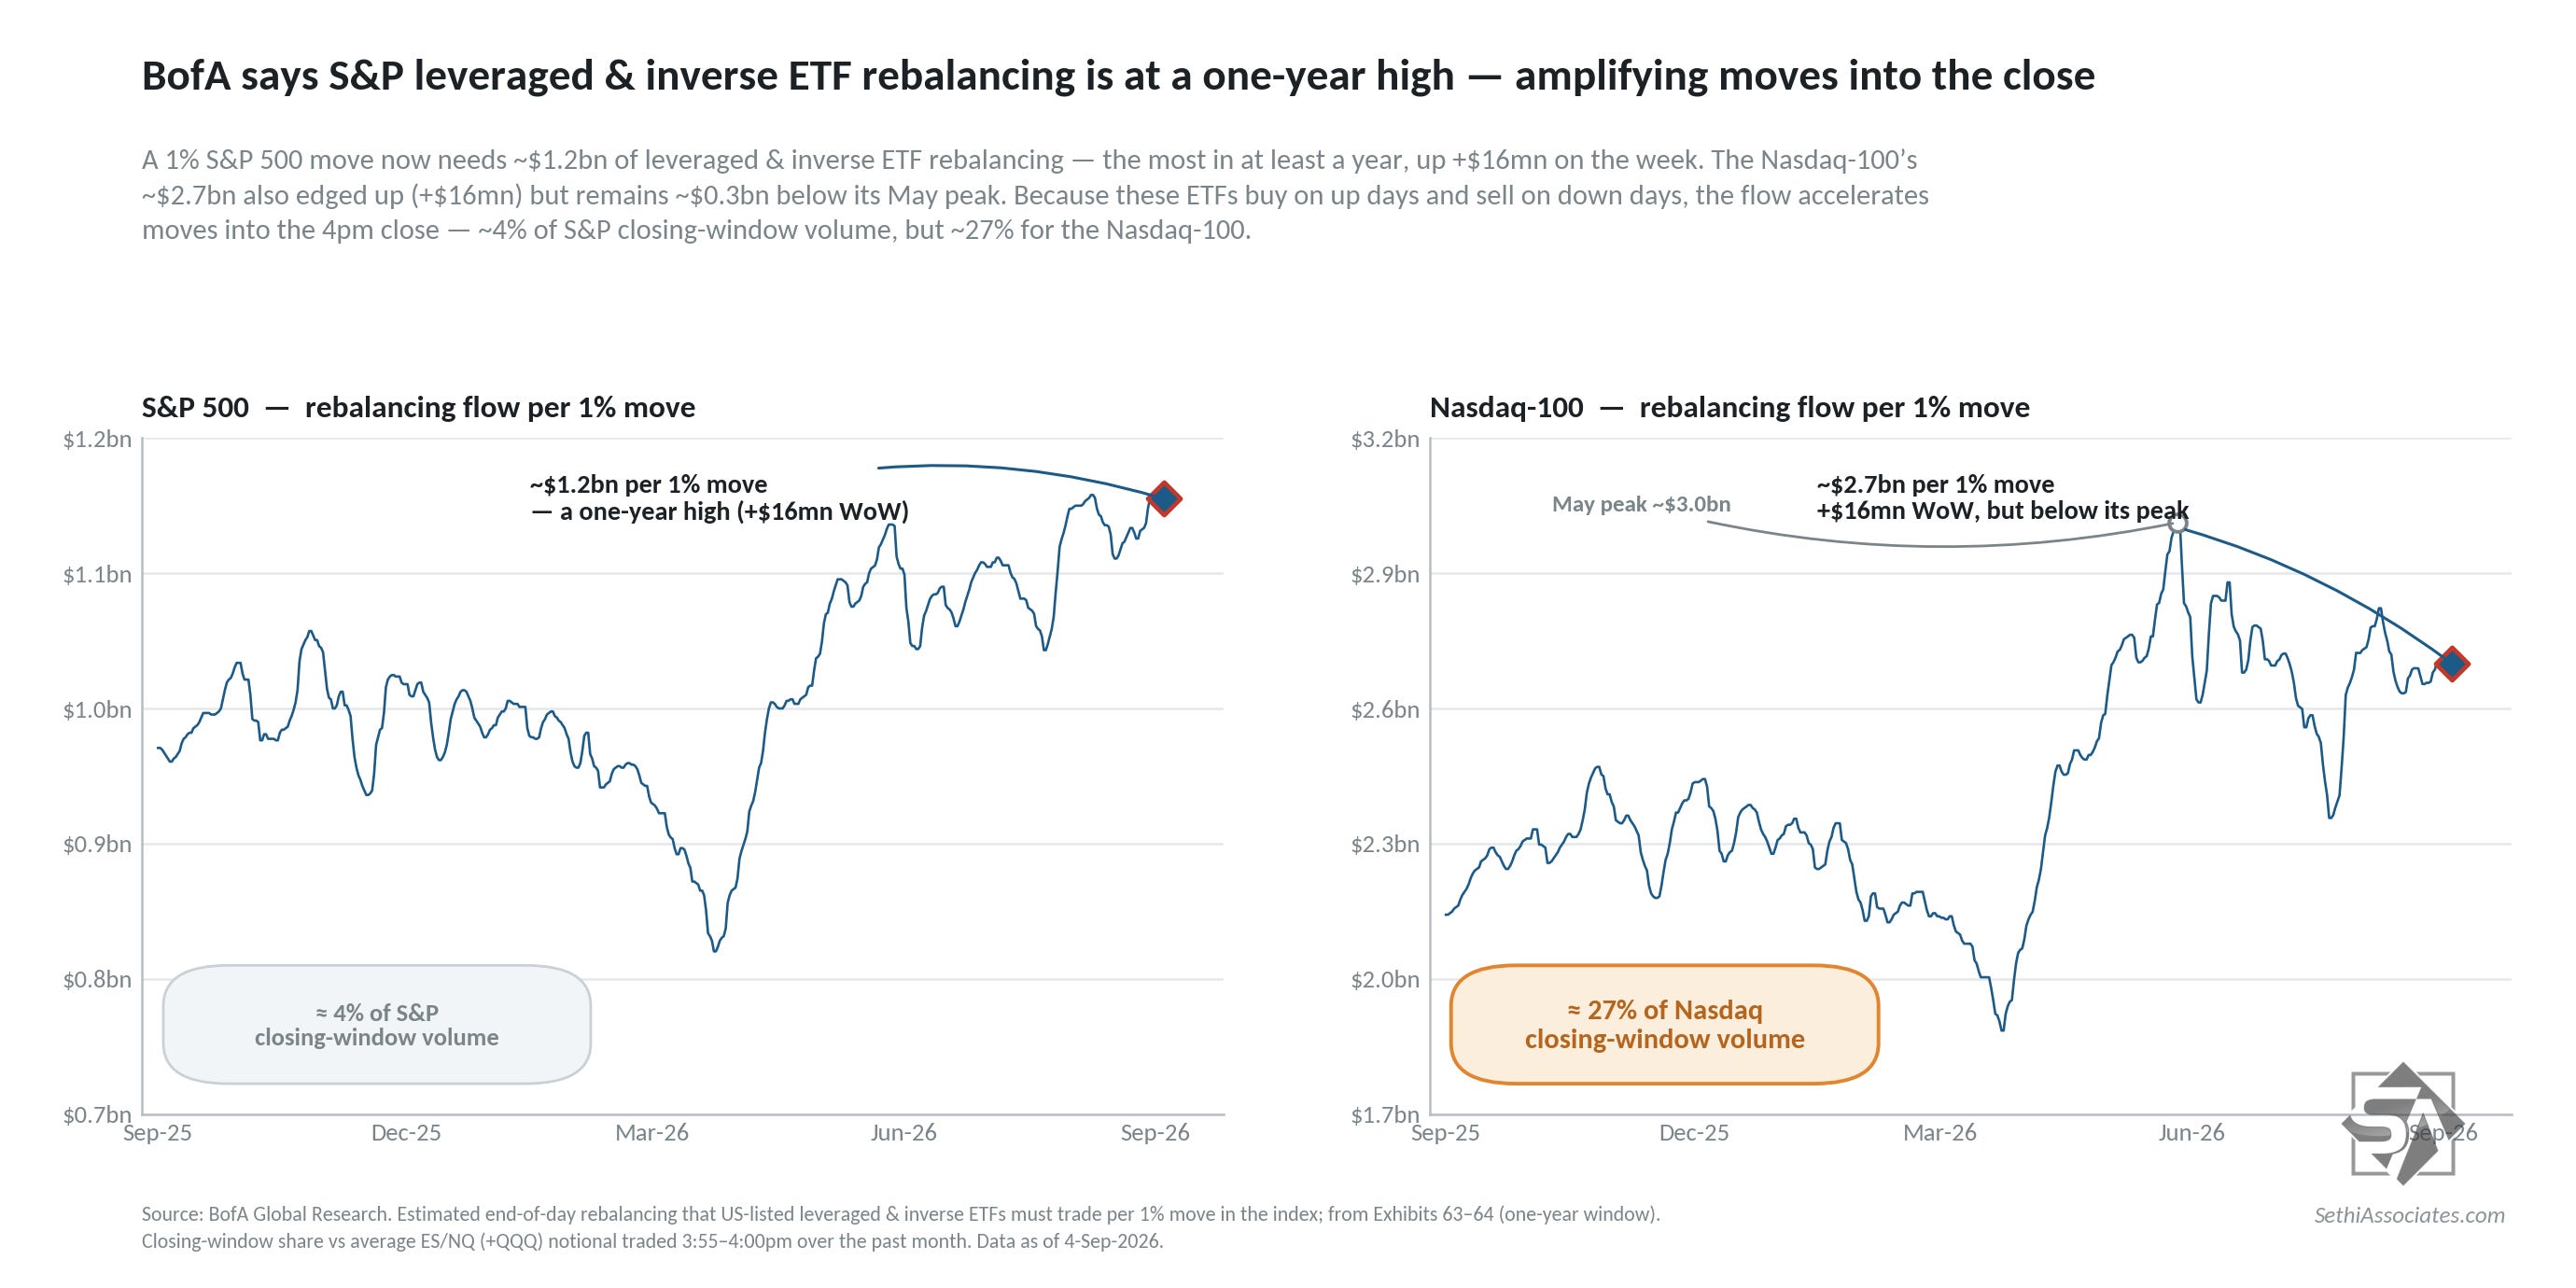
Like call buying,leveraged positioning acts as a “negative gamma source” as Charlie McElligott has put it (meaning that there is added buying/selling pressure from them in the direction of daily flows as they rebalance each day).
Rebalancing flows for Nasdaq-100 and SPX leveraged ETFs increased for a fourth week in five according to BofA after having dropped sharply at the start of August, with the S&P 500 now back to 52-week highs.
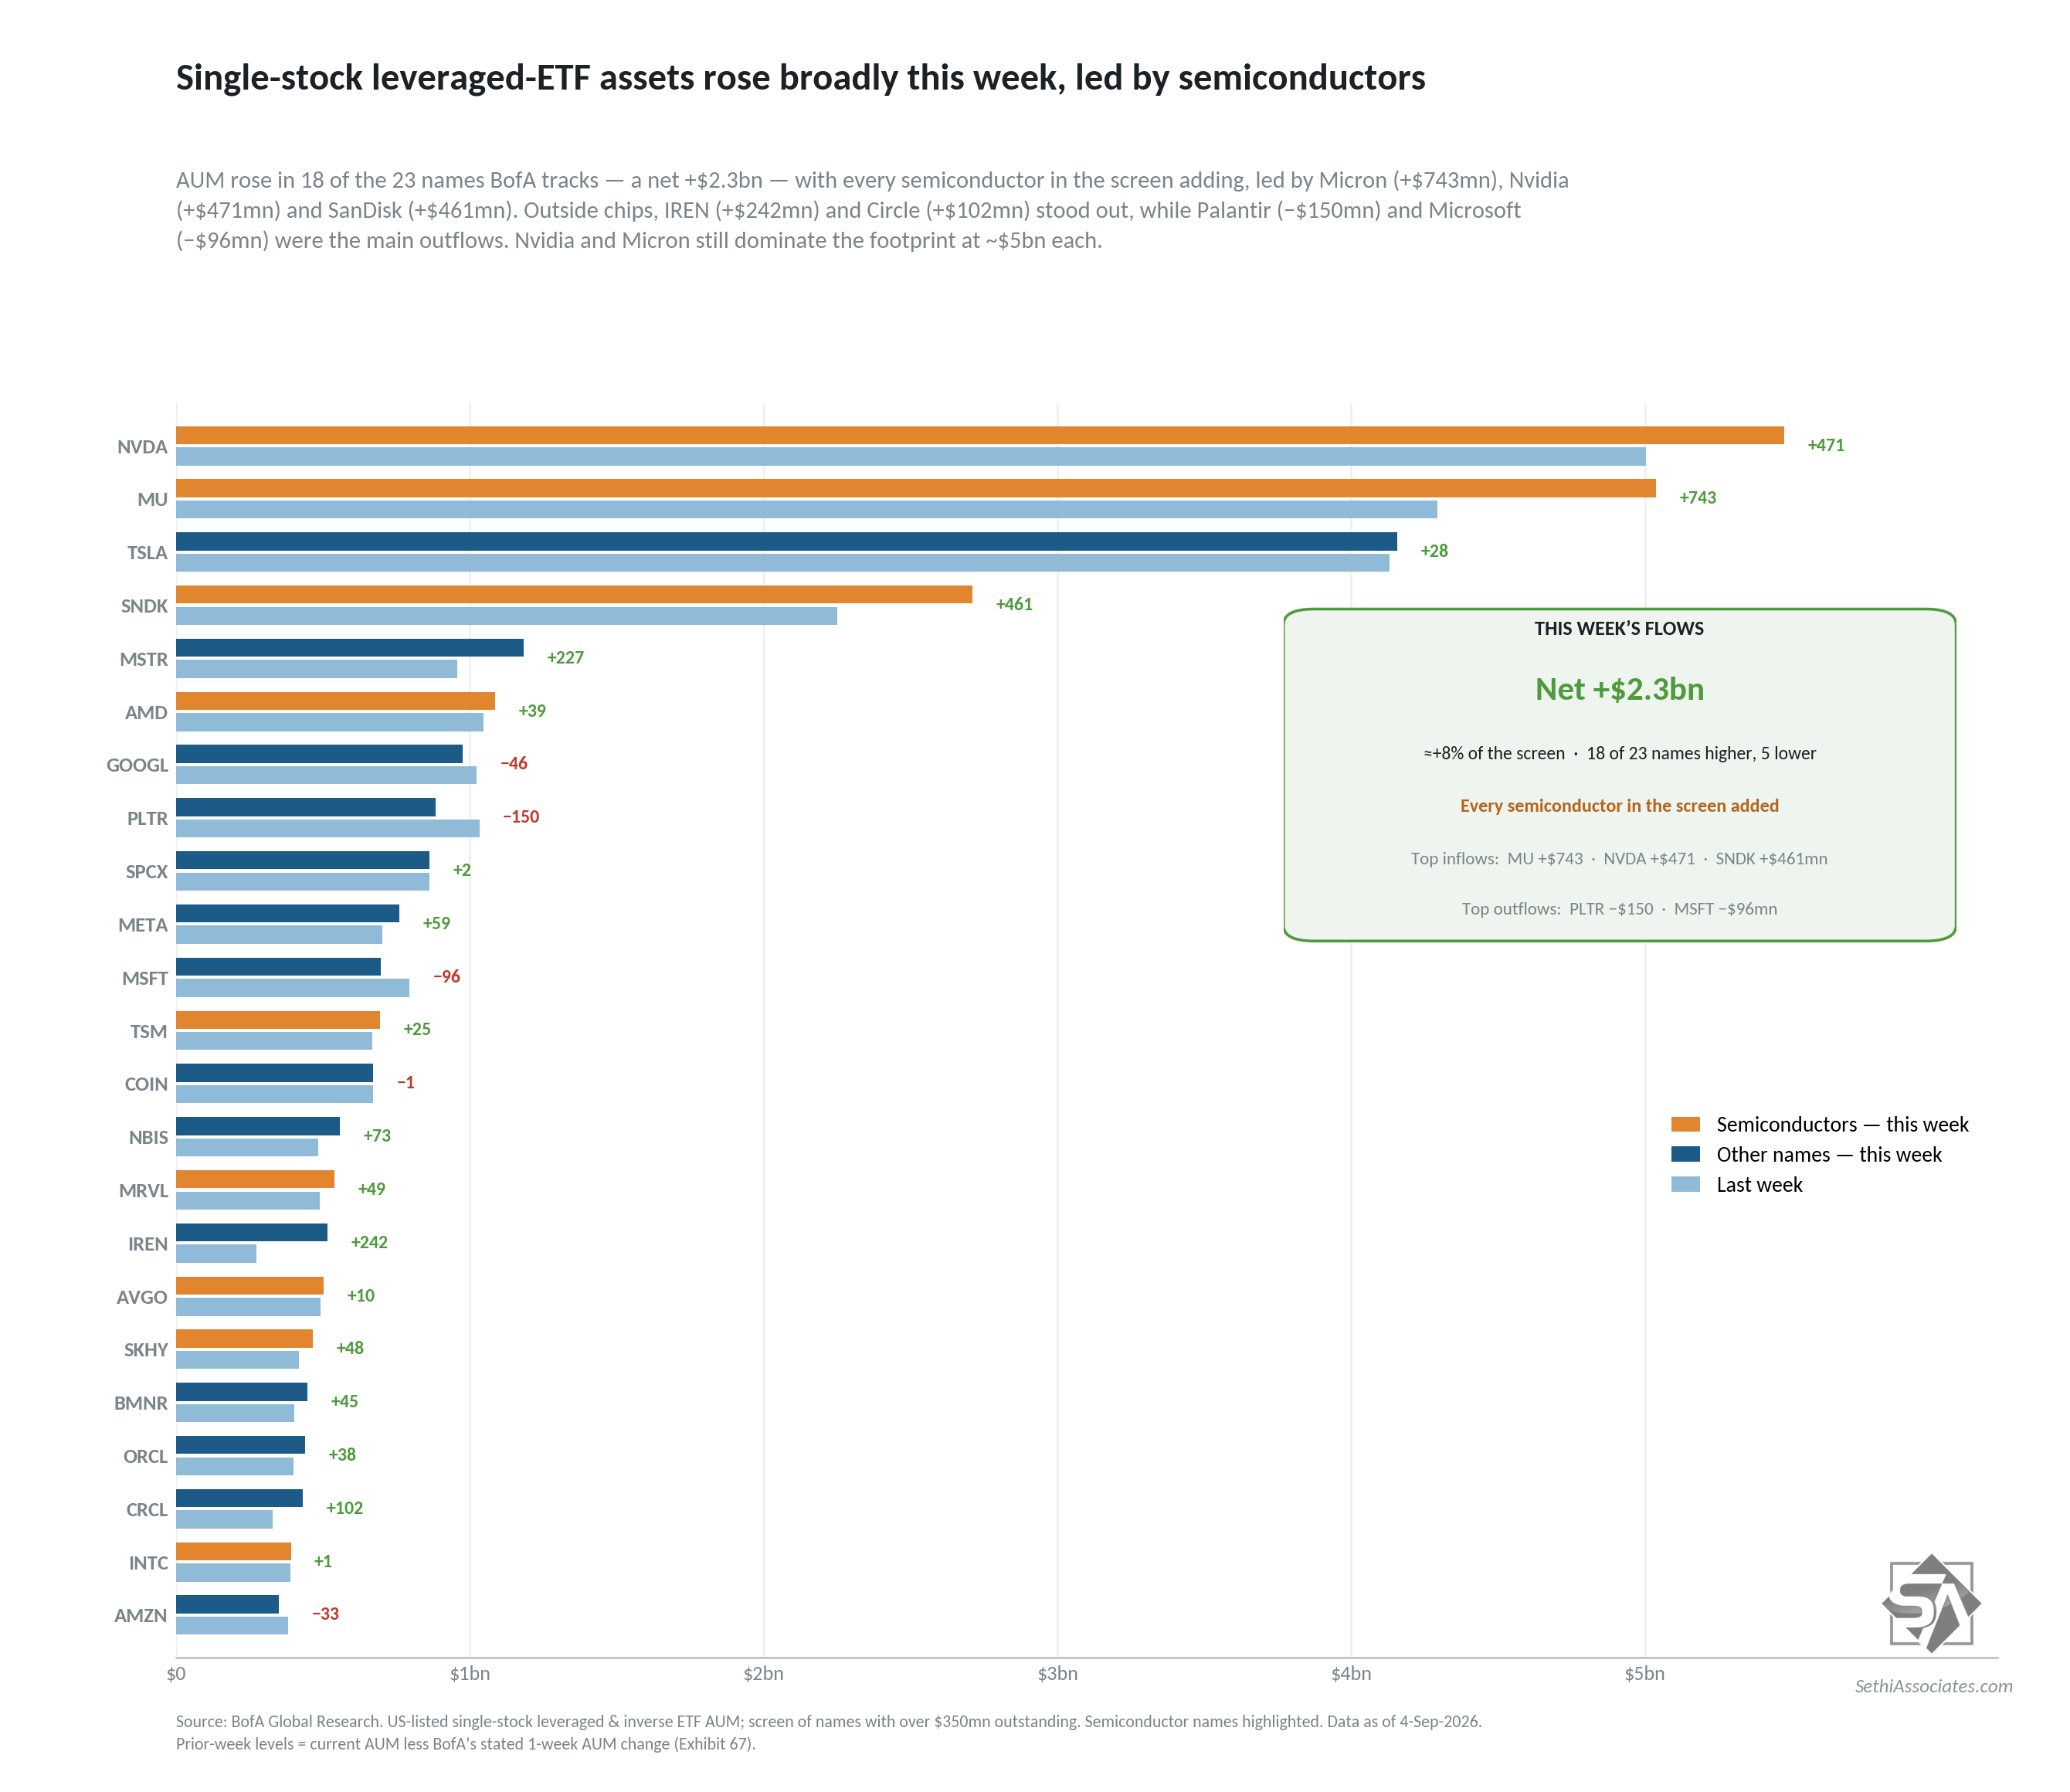
Single-stock leveraged ETF AUM also collectively increased led by a rebound in semiconductor names.
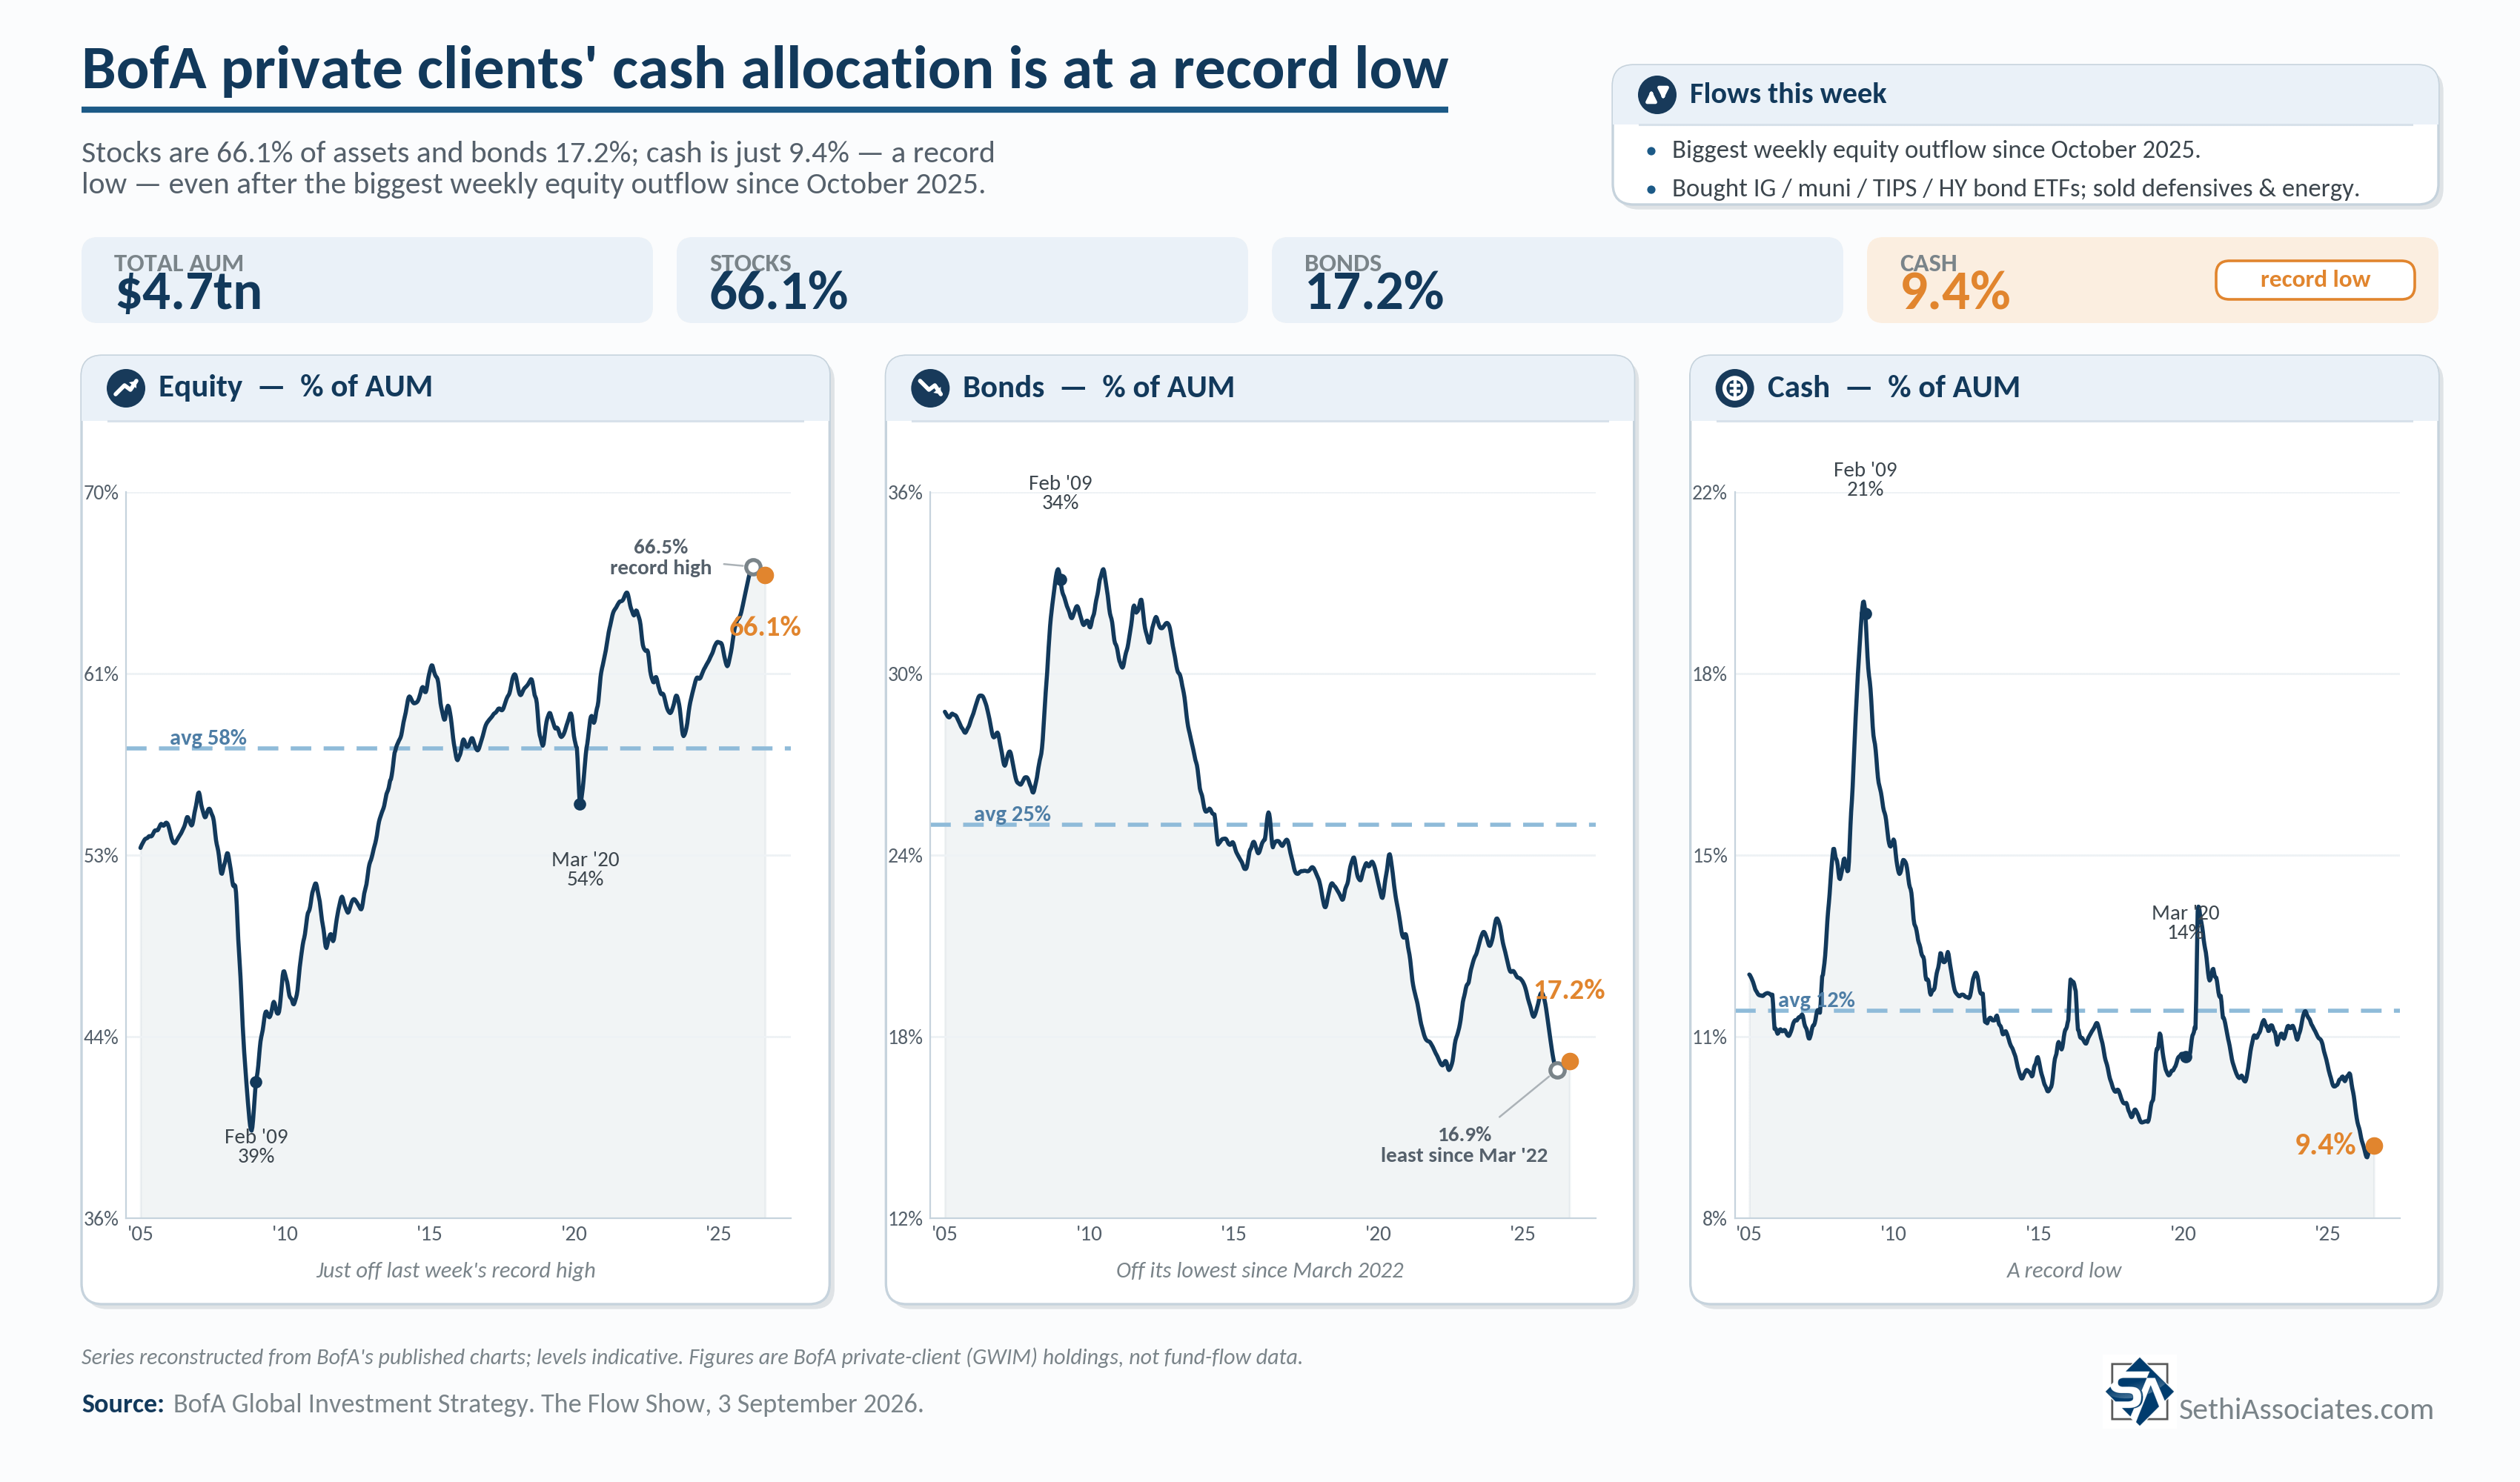
BofA client retail equity positioning though fell back with AUM in stocks down to 66.1% (-0.4% w/w from an all-time high) after the largest outflow since October 2025 (which follows the largest inflow since September 2022 two weeks ago), 17.2% in bonds (+0.3% w/w from the lowest since March 2022), while cash remained at 9.4%, a record low.
Turning to gamma:
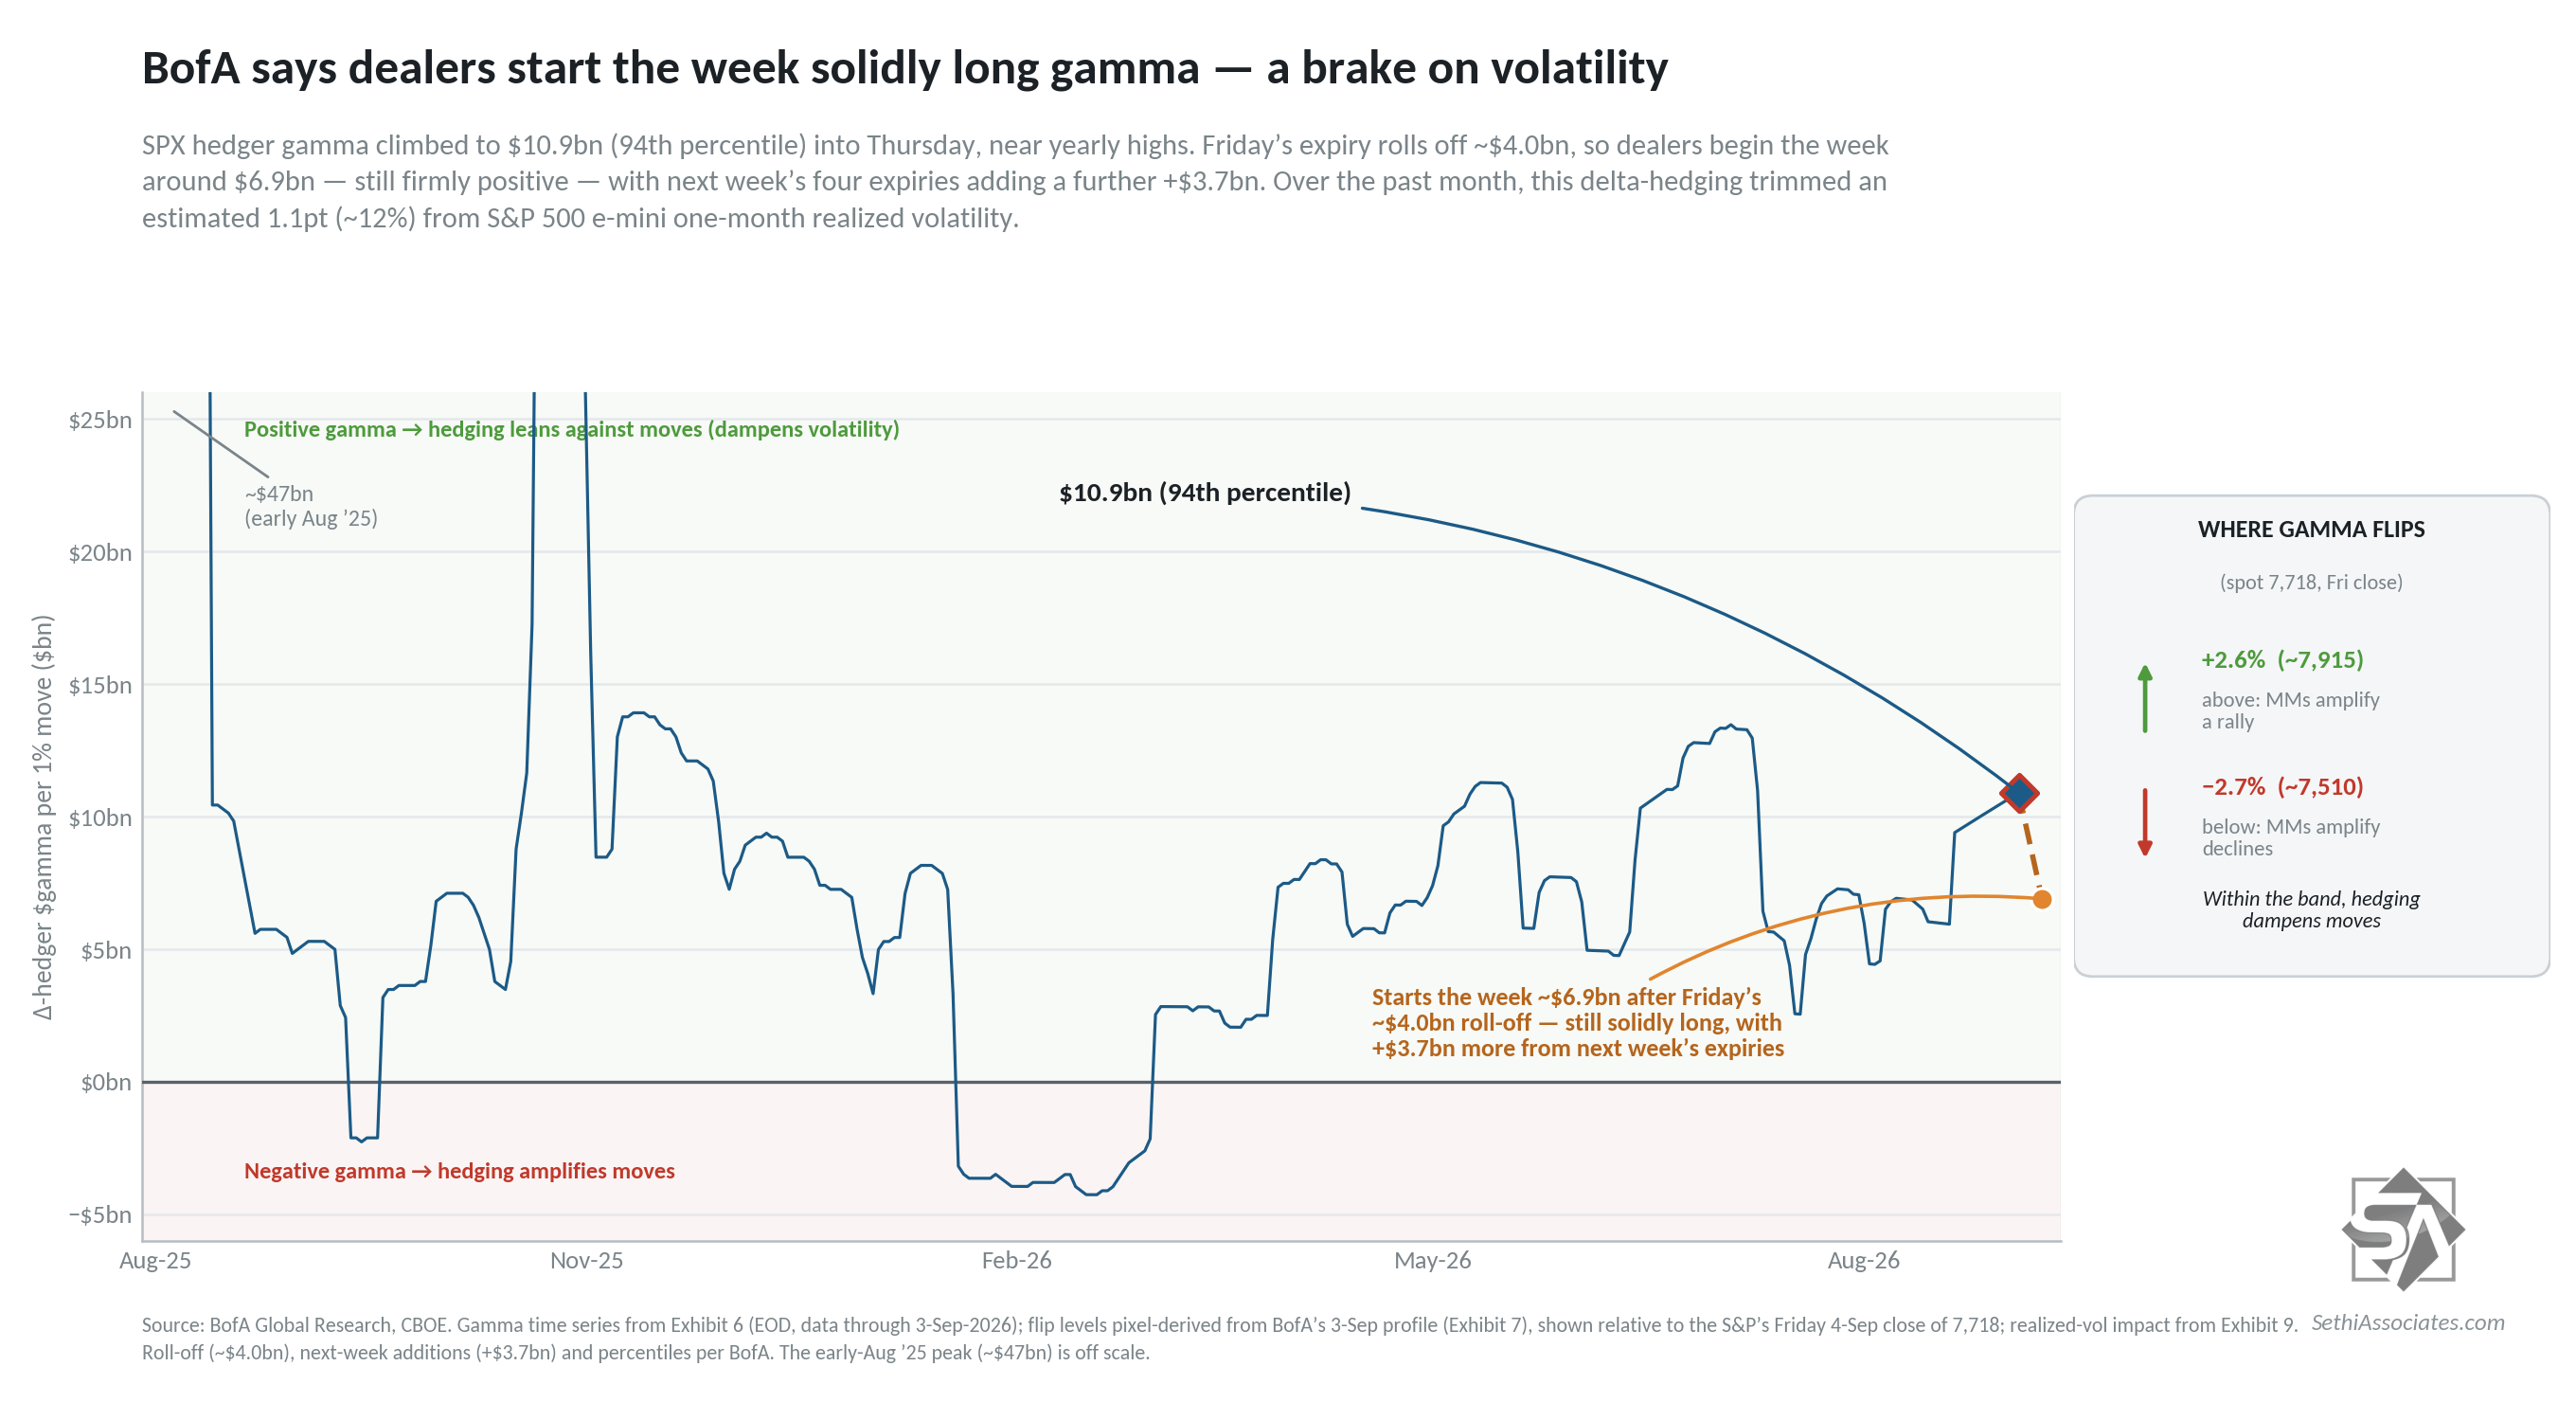
BofA saw SPX gamma as of Thursday climbing to $10.9bn (94th %ile) after “having briefly dipped below median levels to $3.3bn (42nd %ile) earlier in the week as Tuesday’s high gamma expiry rolled off.” They note though “Friday’s expiry (4-Sep) made up a sizable share of current positioning, with roughly $4.0bn of gamma set to roll off,” still leaving though a healthy $6.9bn to start the week which should help to dampen volatility.
As a reminder, positive gamma means that options market makers will buy/sell in the opposite direction of moves (while negative gamma means they inverse and market makers accelerate rallies/sell-offs). Currently they see a cushion of around 2.5% in either direction before gamma would flip negative.
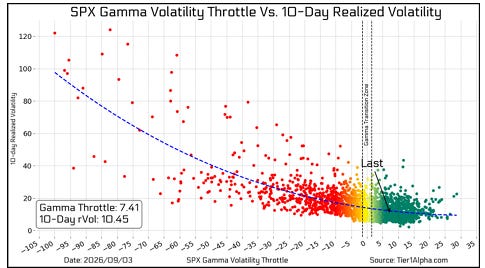
Tier1Alpha’s update was also as of Thursday night and they also say “SPX pushed back into positive gamma, which means the conditions for lower volatility are back in play.”
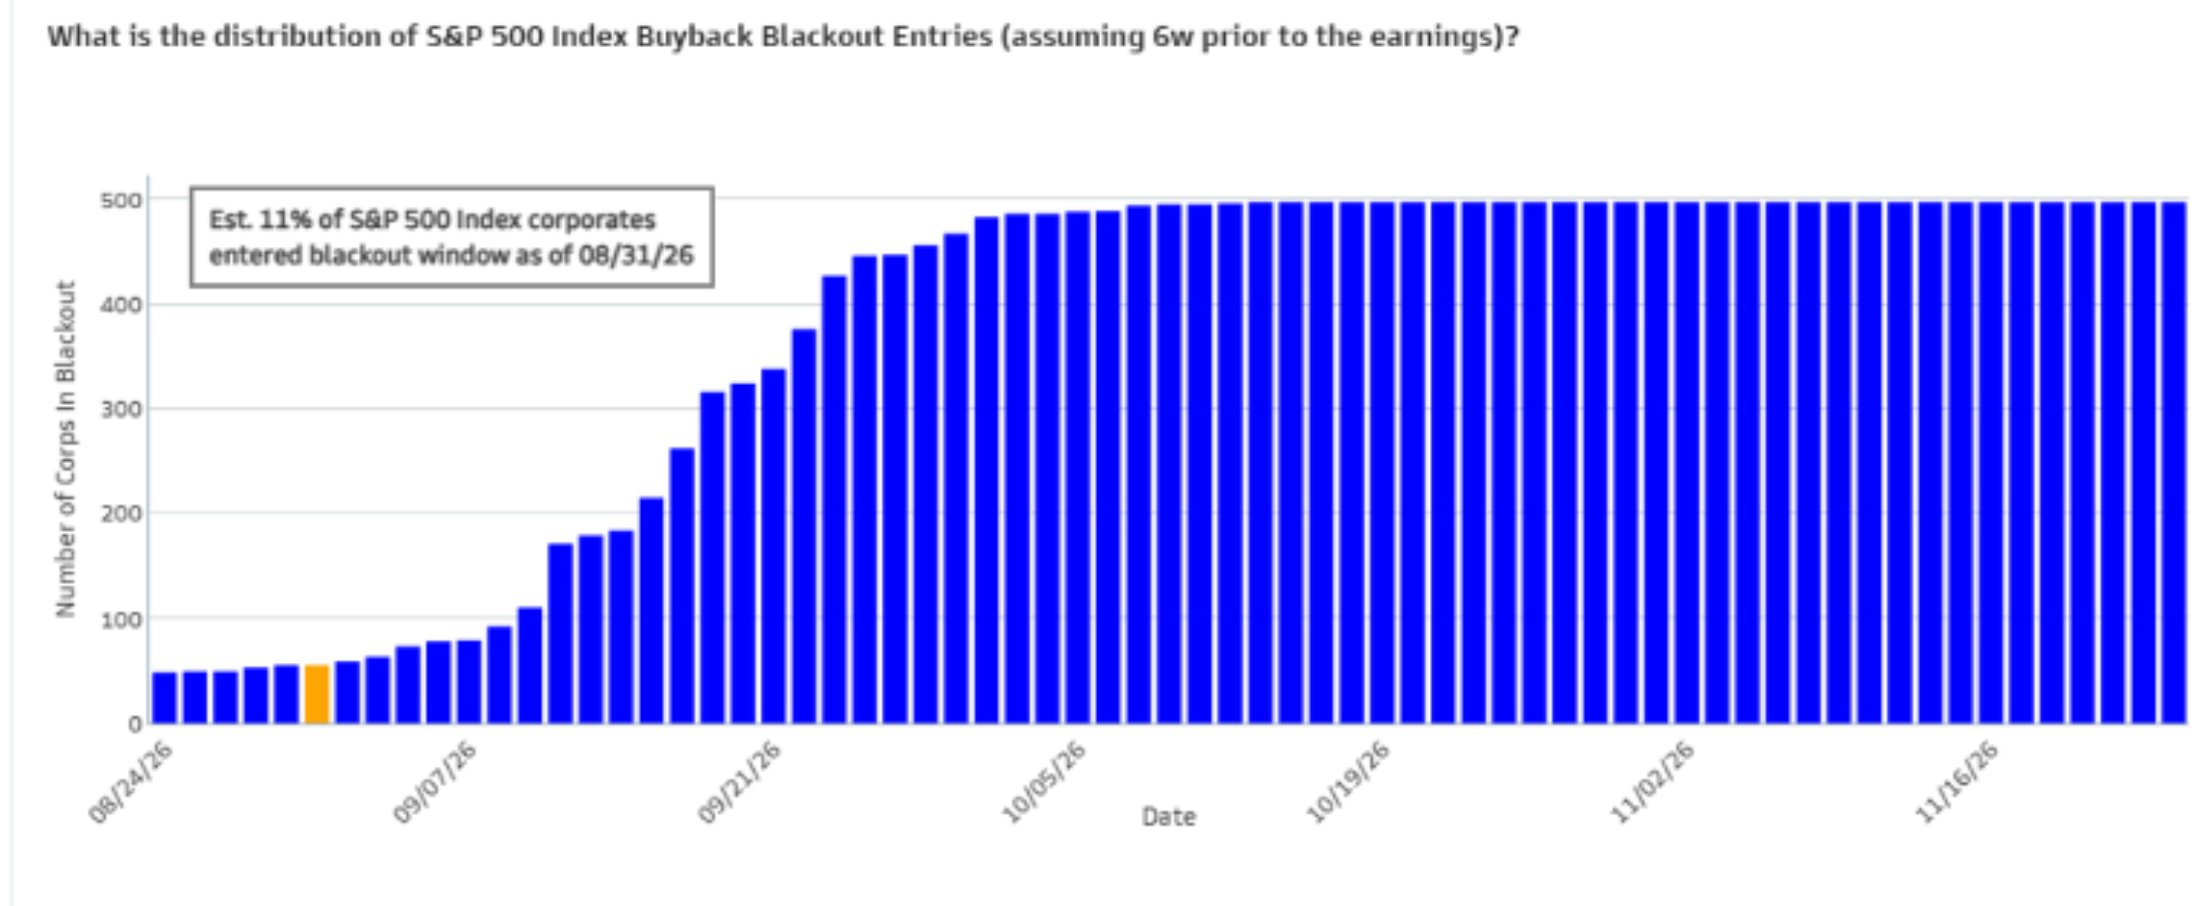
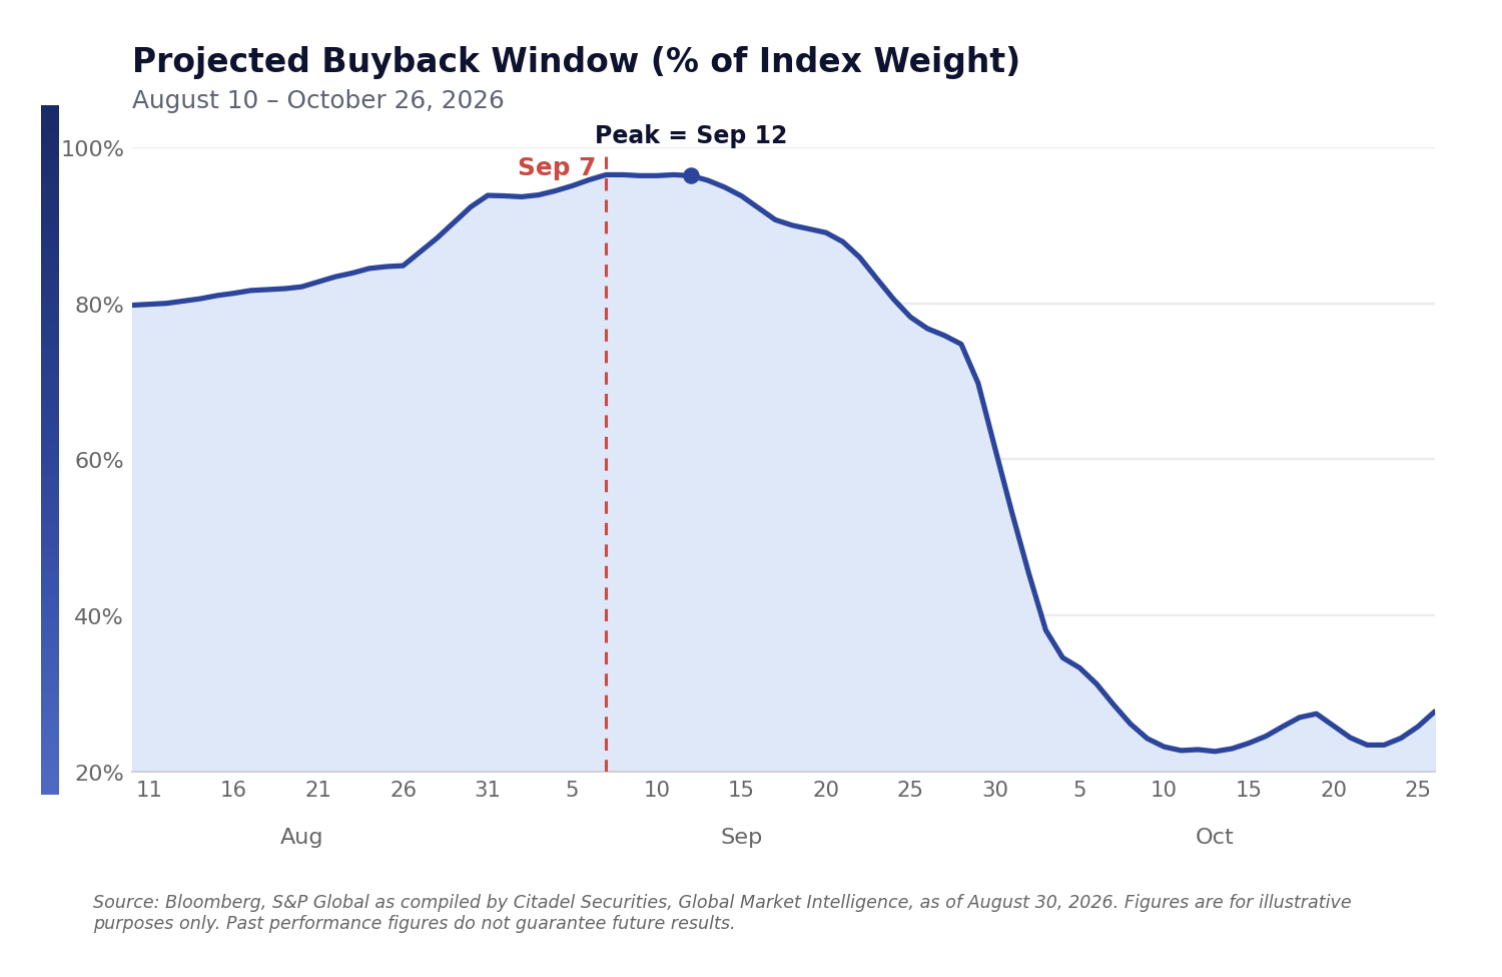
Turning to buybacks, we are now in the fully open buyback window with just under 100% of discretionary buybacks by index weight for S&P 500 companies active this week (discretionary buybacks represent ~30% of all buybacks).
From Goldman this week on buybacks:
Activity across our desk slightly moderated last week, reflecting a natural deceleration as we move toward the Labor Day holiday in the US. We anticipate volumes will remain at this pace over the next week.
Against the macro backdrop of typical late-August thin volumes, even a moderated corporate bid is thought to provide a cushion to broader markets.
Looking ahead, we estimate the Q3 blackout window will begin ~9/15, when roughly ~40% of the S&P 500 is estimated to enter their quiet period ahead of earnings.
And Citadel’s Rubner has a similar start date (9/12) for the peak in discretionary buybacks which will fall quickly though as we move through the month (another reason that September is seasonally weak).
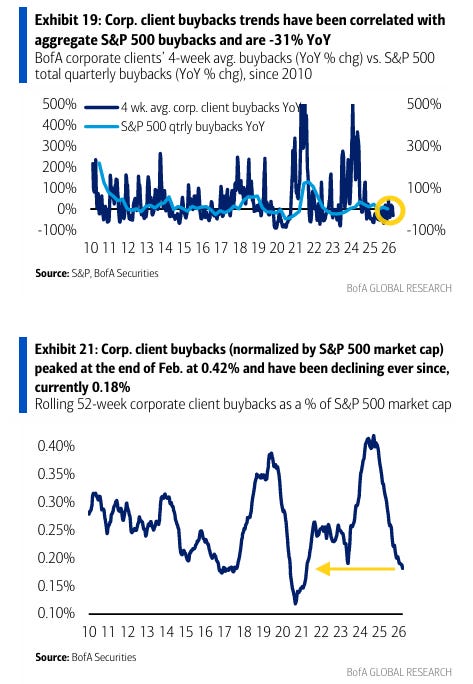
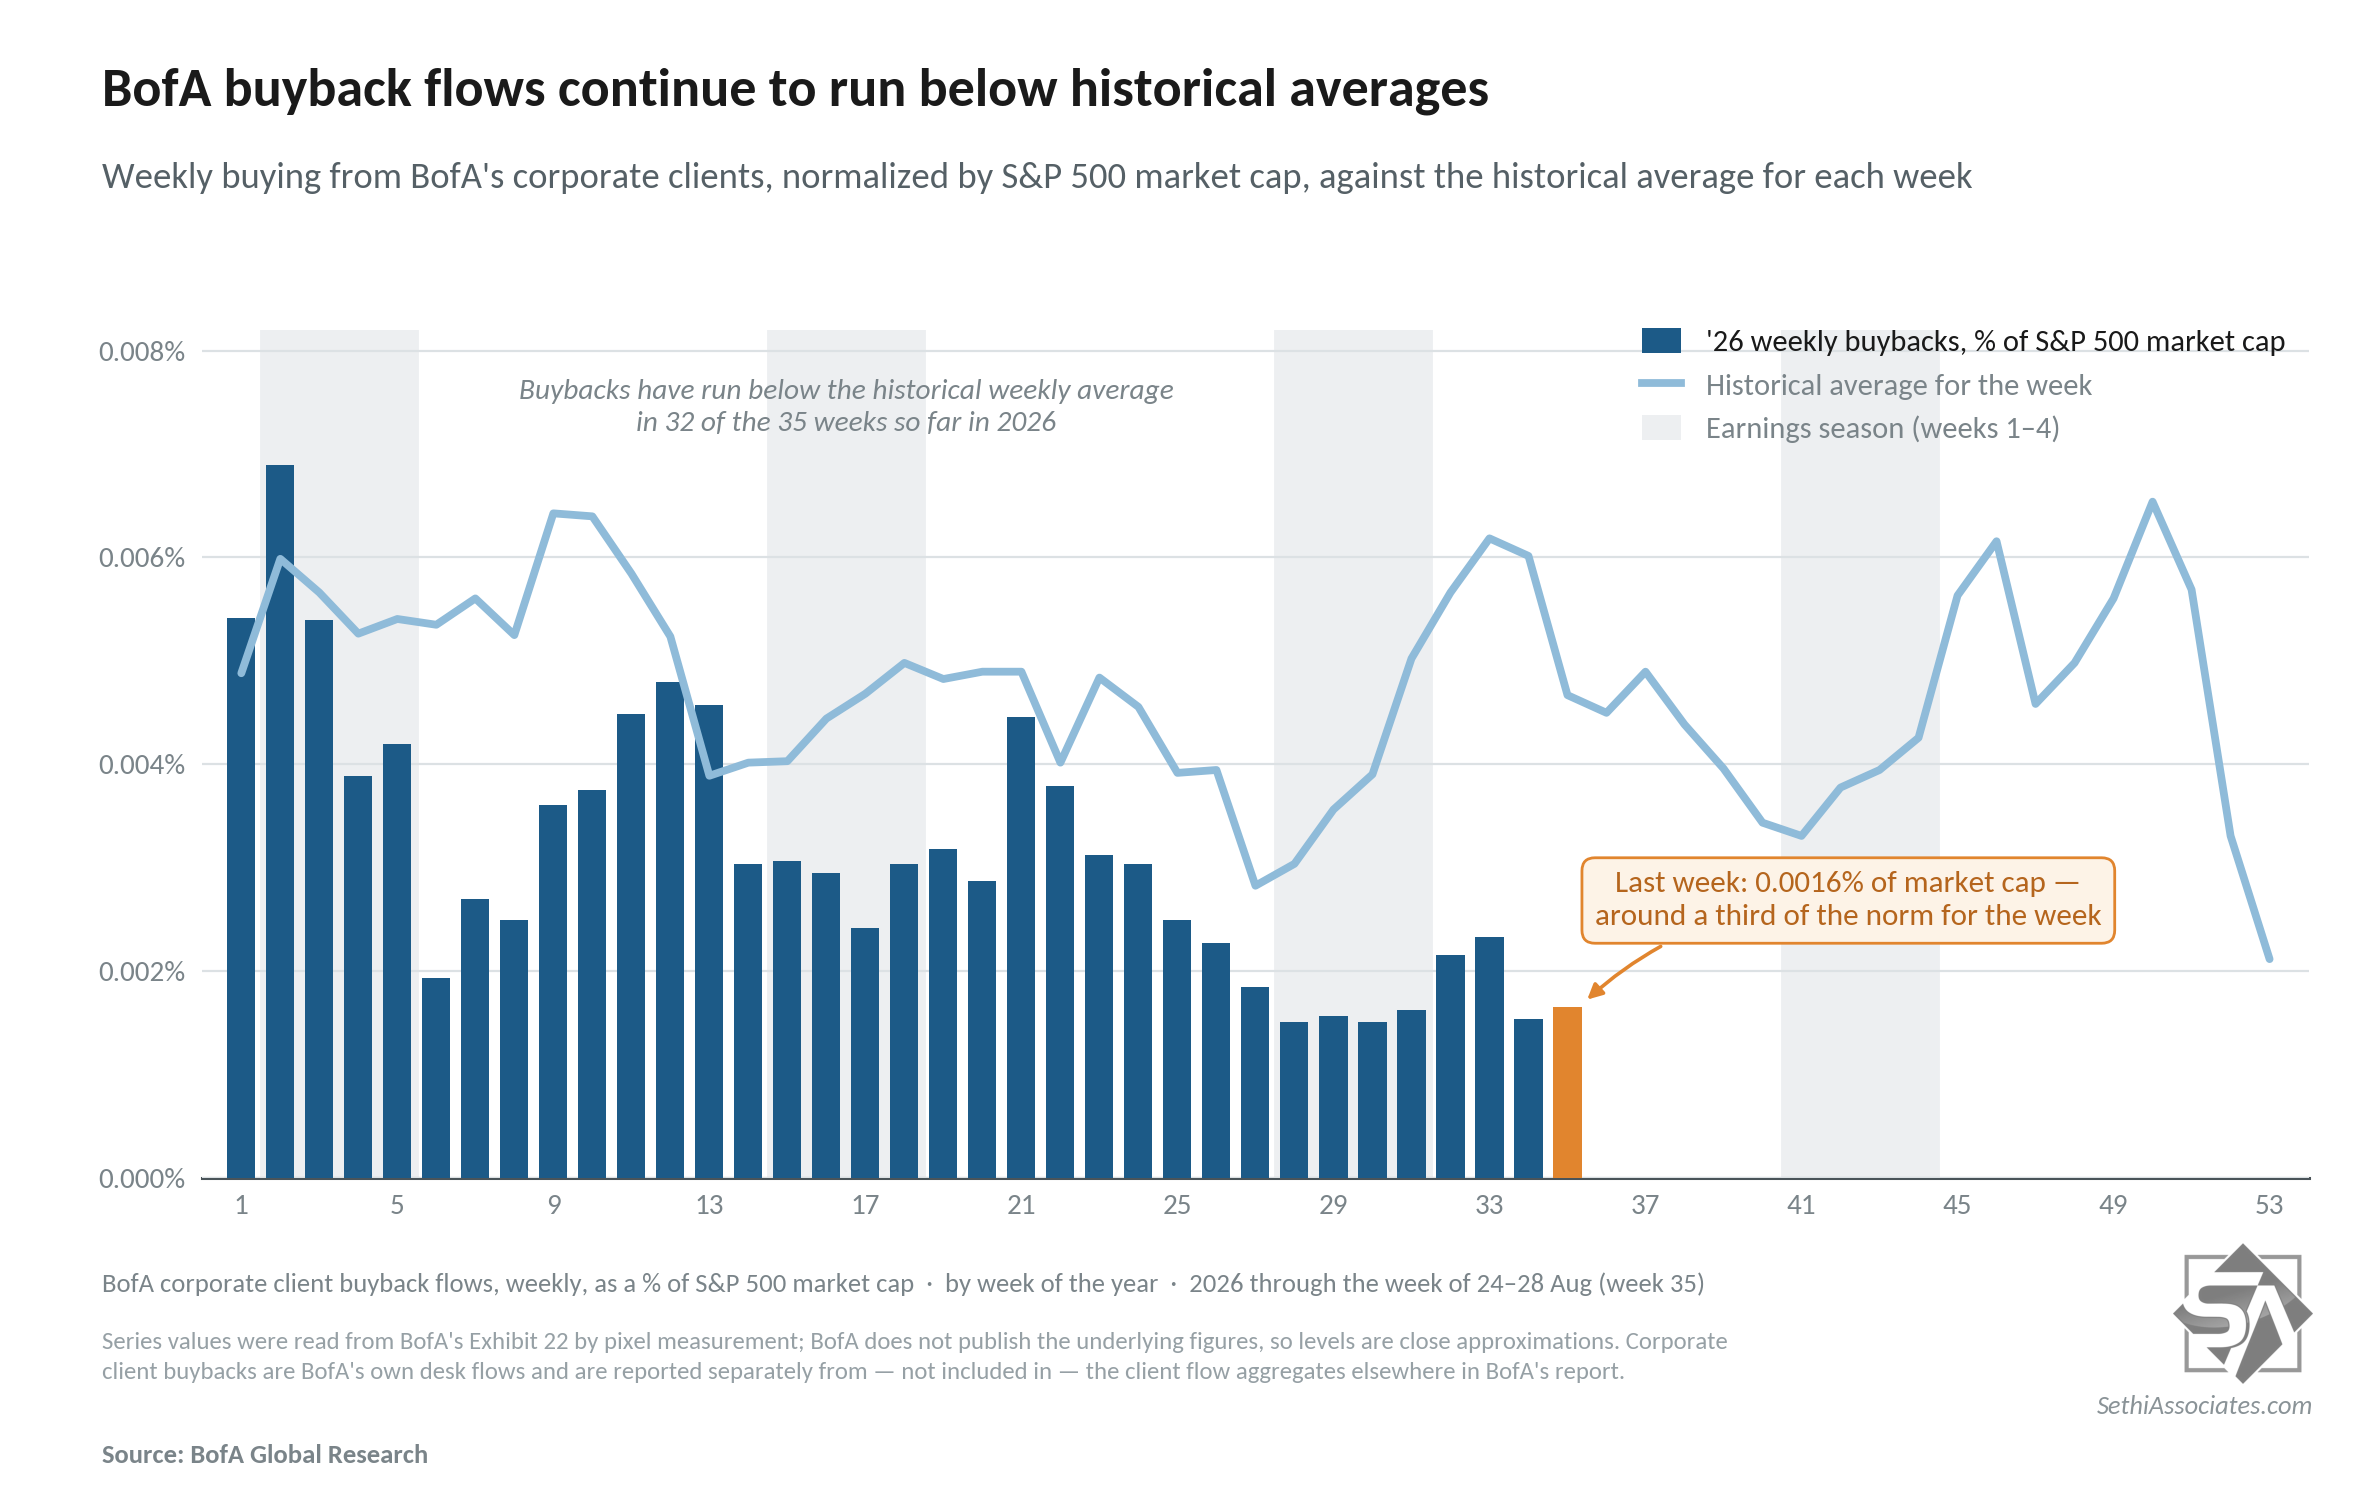
While BofA says buybacks “accelerated last week, driven by Financials,” the fourth week of acceleration in five (consistent with the reopening of the buyback window) although on a 4-week average basis they fell to -30% y/y from -21%, and they remain well below the historical average for this week when normalized by market cap.
YTD they say annualized buybacks are “slightly below full-year ‘25 levels and below ‘24 records, but above 2016-23 levels,” but as a % of market cap are now the least since 2021 (on a rolling 52-week basis).
Sentiment Remains Mixed, A Good Thing
Sentiment (which I treat separately from positioning) is one of those things that is generally positive for equities when it’s above average but not extreme (“it takes bulls to have a bull market”, etc.), although it can stay at extreme levels for longer than people think, so really it’s most helpful when it’s at extreme lows (“washed out”).
Currently we are not near either extreme:
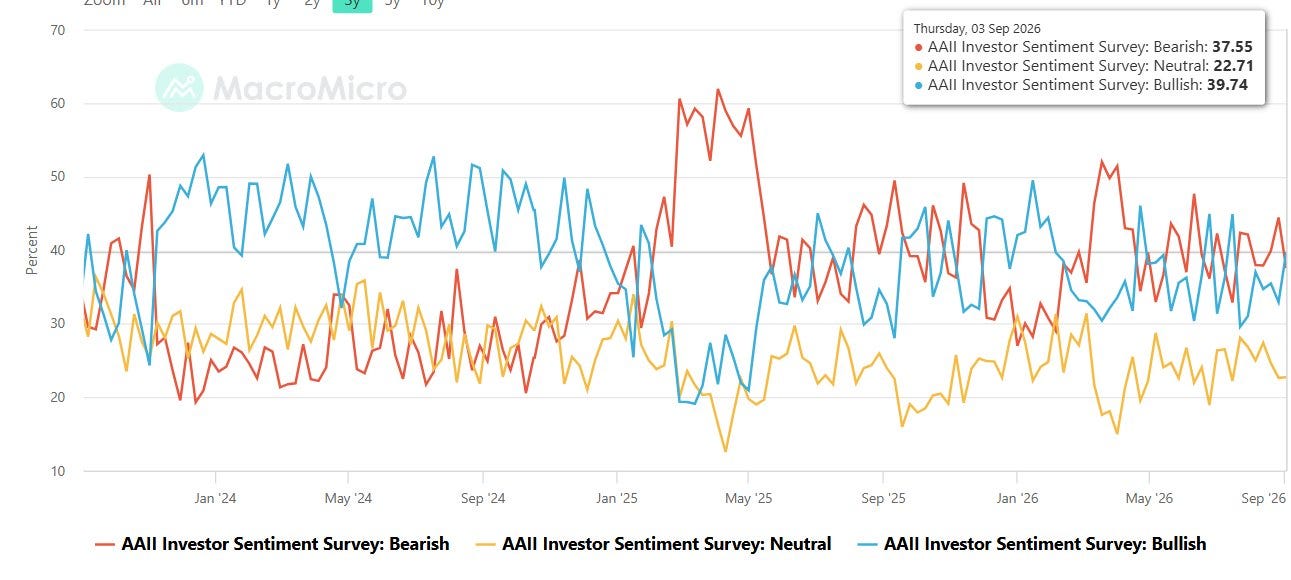
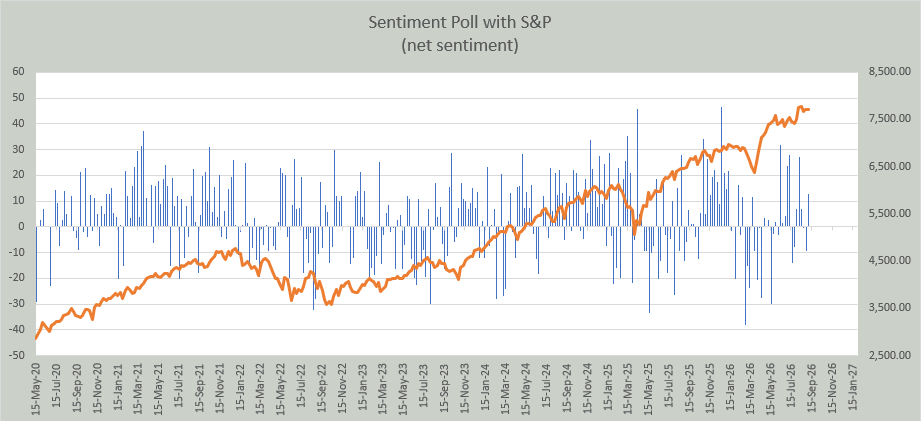
American Association of Individual Investors (AAII) sees bulls fall and bears push higher, with bulls remaining below the level of the bears for a sixth week (and 21st in 26):
AAII bulls (those who see higher stock prices in 6 mths, blue line) fell to 32.9% from 35.5% the prior week (still though above the 29.6% five weeks ago, the least since September), but remaining below the long-term historic average of 37.5% for a sixth week.
Bulls also remained below the level of the bears (who see lower stock prices in 6 mths, red line) for a sixth week (and the 21st week in the last 26) with the bears up to 44.4%, the most since June 11th, from 39.9%. Bears also remain above the long-term average of 31.0% for a 28th straight week (and they’ve only been below it 9 weeks since Dec 12, 2024).
The Neutral camp (yellow line) dropped to 22.6% from 24.6% . It remains under the long-run average of 31.5% and has been over that only twice since July 2024.
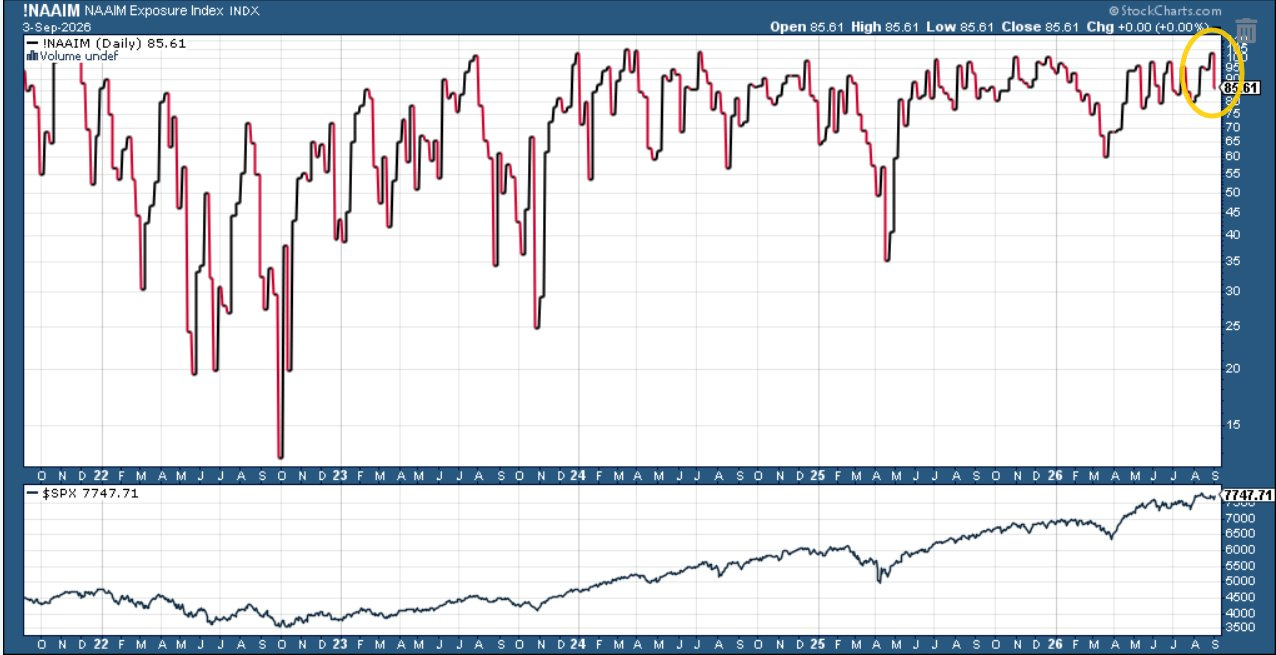
NAAIM’s survey of investment professionals* fell back to 85.6 from 102.66 the prior week (meaning they were on margin) which was the highest since July of 2024.
*The index according to NAAIM “represents the average exposure to US Equity markets reported by our members” and which ranges from -200% (2x short) to +200% (2x long).
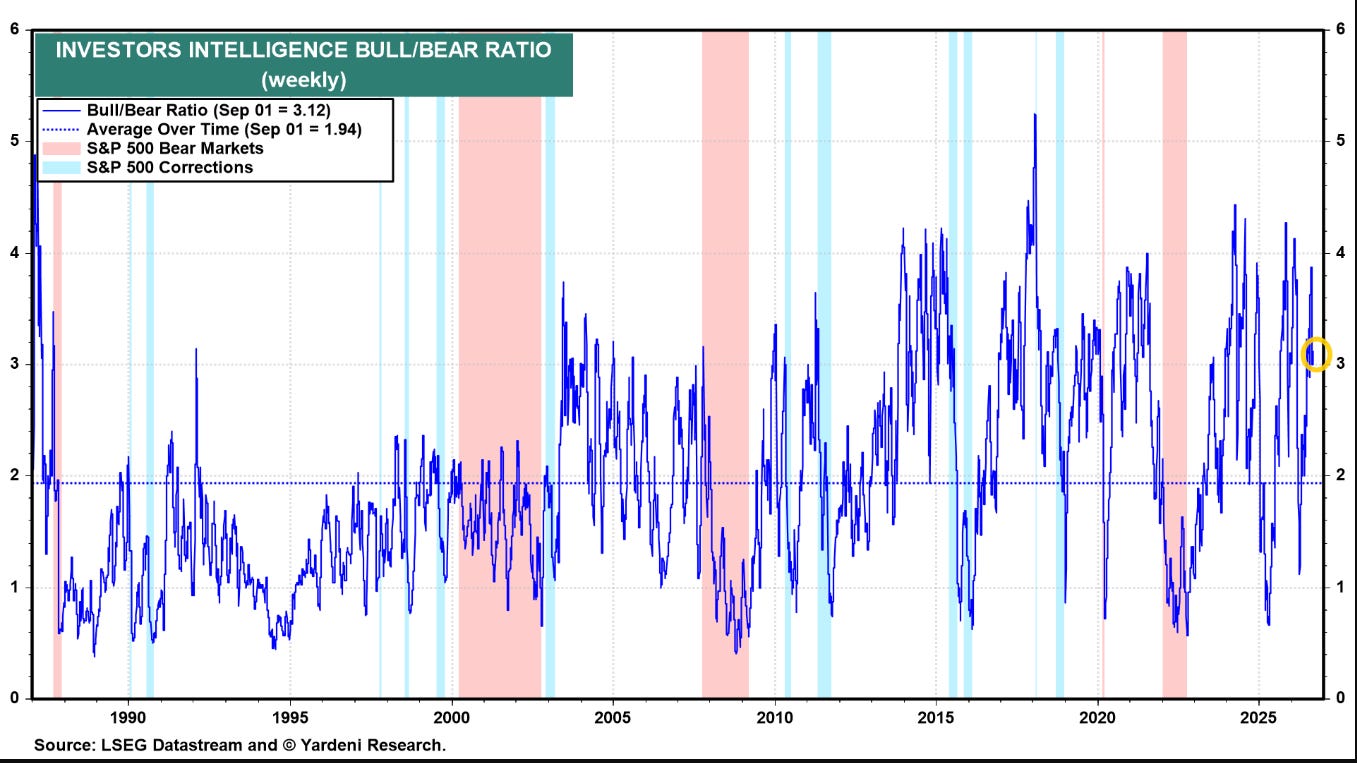
While the Investors Intelligence (independent investment-newsletter writers) survey saw the bull/bear ratio little changed at a moderately bullish 3.12.
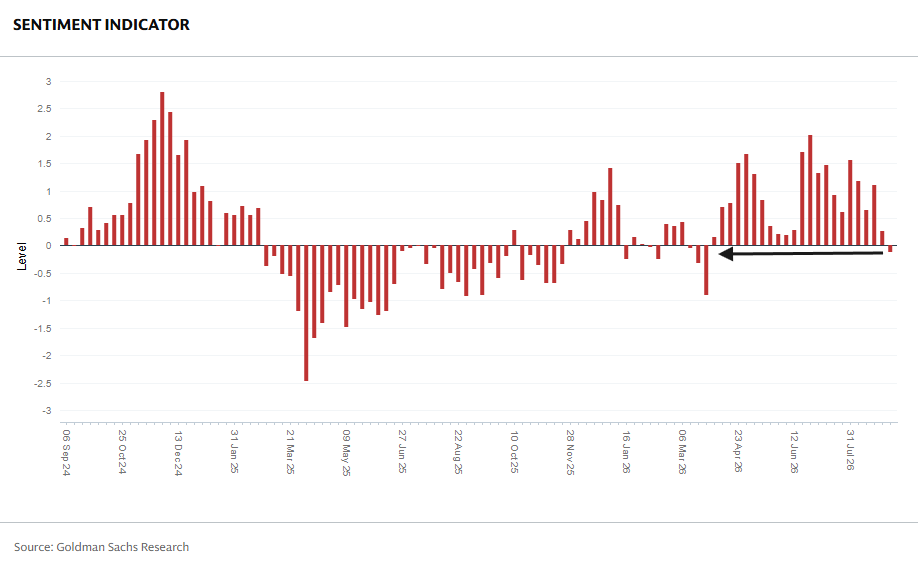
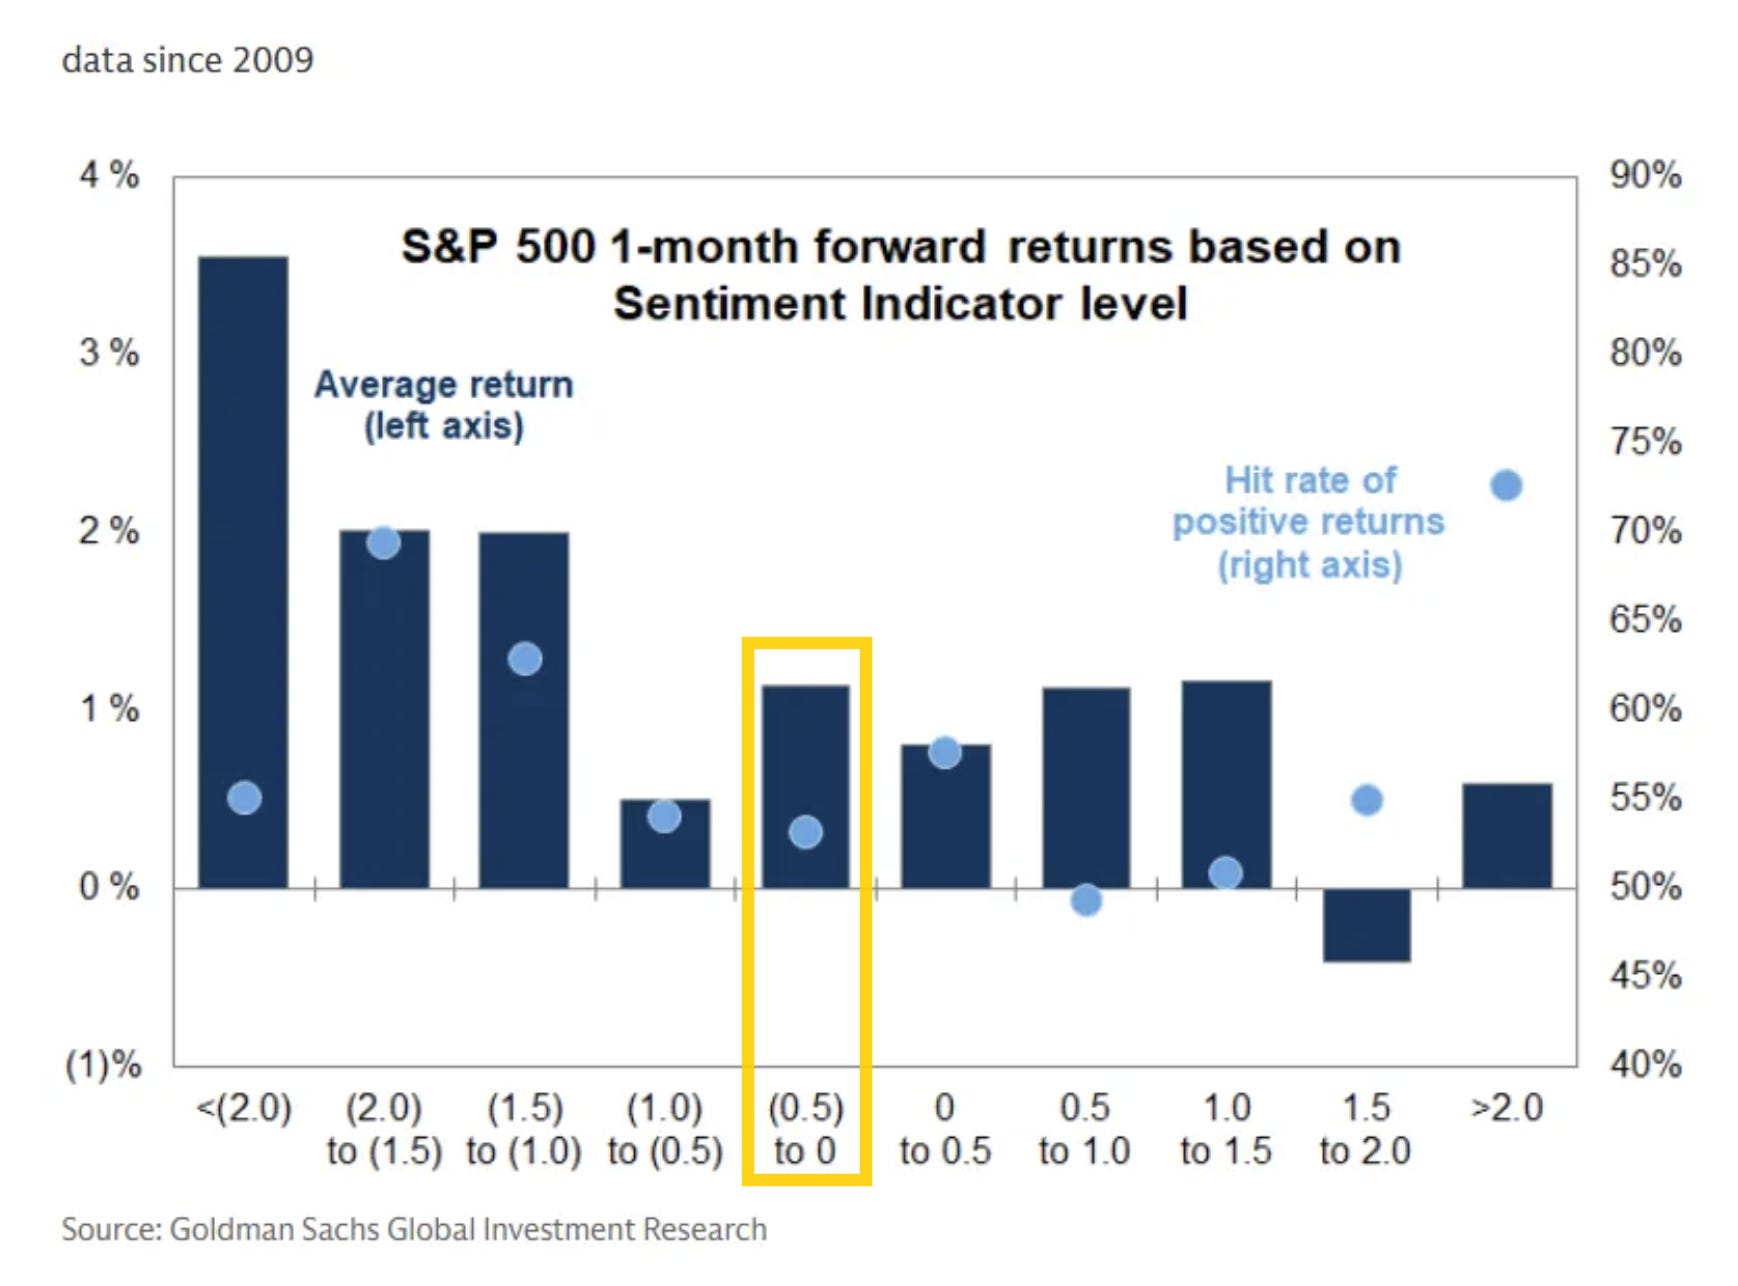
And Goldman’s US Equity Sentiment Indicator*, fell for the fourth week in five now into negative territory at -0.13, the least since late March.
The current reading is consistent though with a 1-month average return of around 1% since 2009 with a positive rate over 50%.
*The indicator combines “six weekly and three monthly indicators that span [across the more than 80% of the US equity market that is owned by institutional, retail and foreign investors]. Readings of +1.0 or higher have historically signaled stretched equity positioning. Readings of -1.0 or lower have signaled very light positioning and have historically been a statistically significant signal for subsequent S&P 500 performance”.
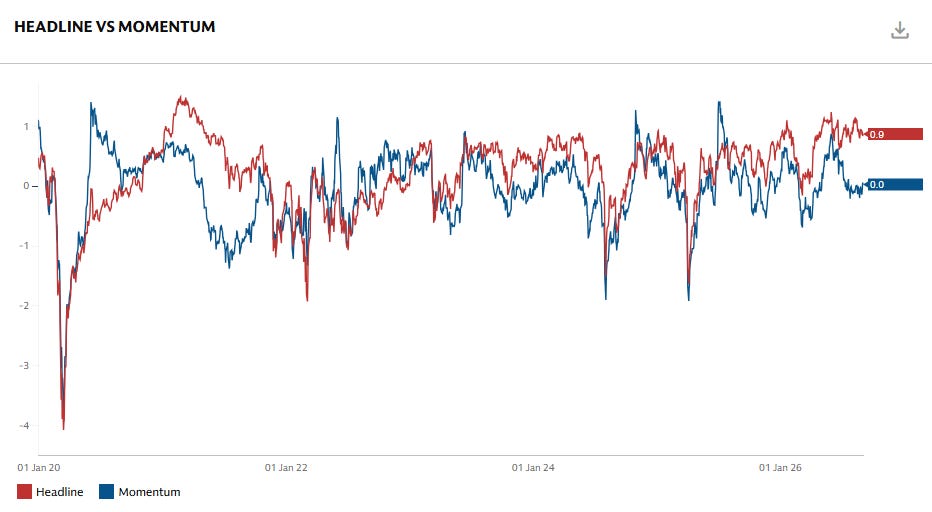
But Goldman’s Risk Appetite Indicator* remains more elevated at 0.9, associated with below-average returns over the next 1, 3, 6, and 12 months although still positive 62, 67, 87, and 71% of the time respectively.
*”Goldman Sachs Risk Appetite Indicator (RAI) aims to track the level of global market risk appetite and risk aversion based on various market variables. A sharp rise in the index can send a warning signal that investors have more risk appetite and are potentially exposed to a correction if consensus views are tested. Similarly, a sharp decline indicates a reduction in risk appetite, and at extreme levels it can indicate that markets may have overshot. RAI signals are most powerful when the level of risk appetite is very low below -1.5, with levels closer to -2.0 giving the clearest signal over longer time horizons, as at such levels the asymmetry of subsequent medium term equity return becomes very positively skewed. RAI momentum is designed to track short term shifts of market risk appetite, and subcomponents of the RAI.”
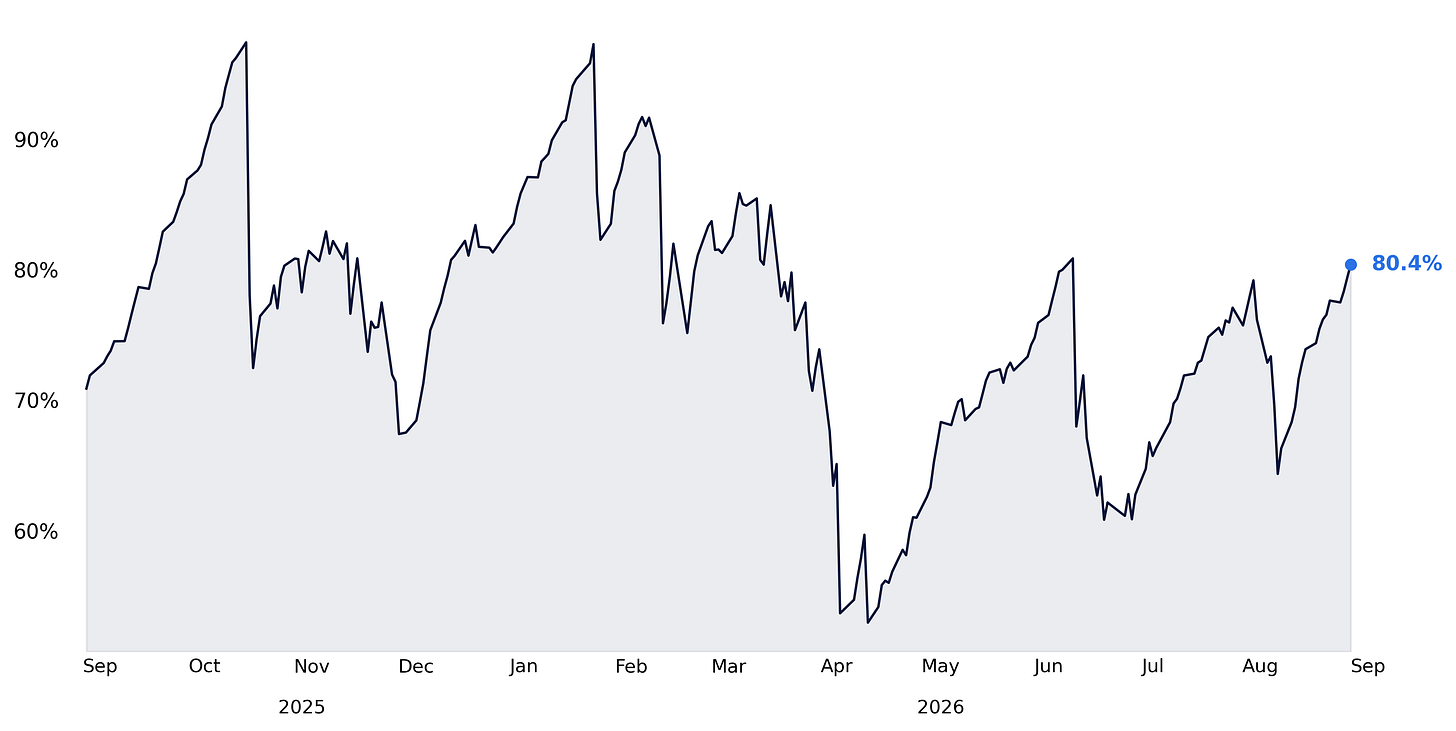
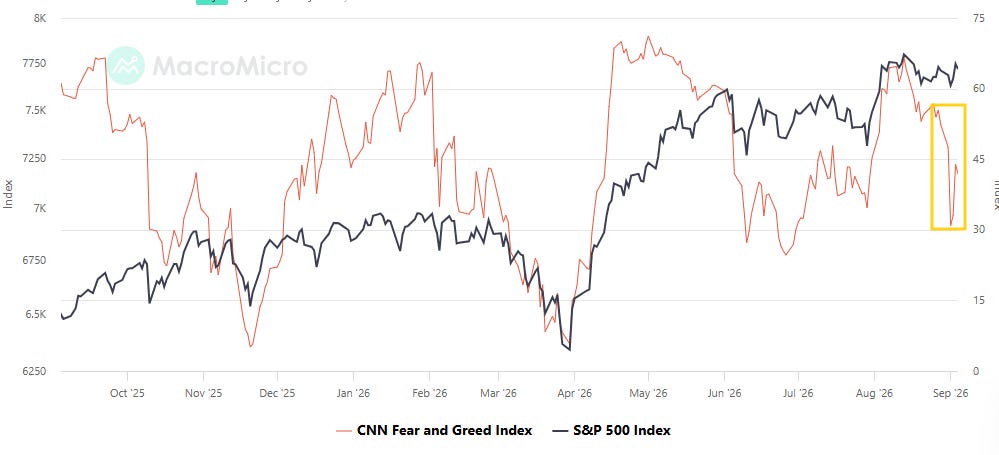
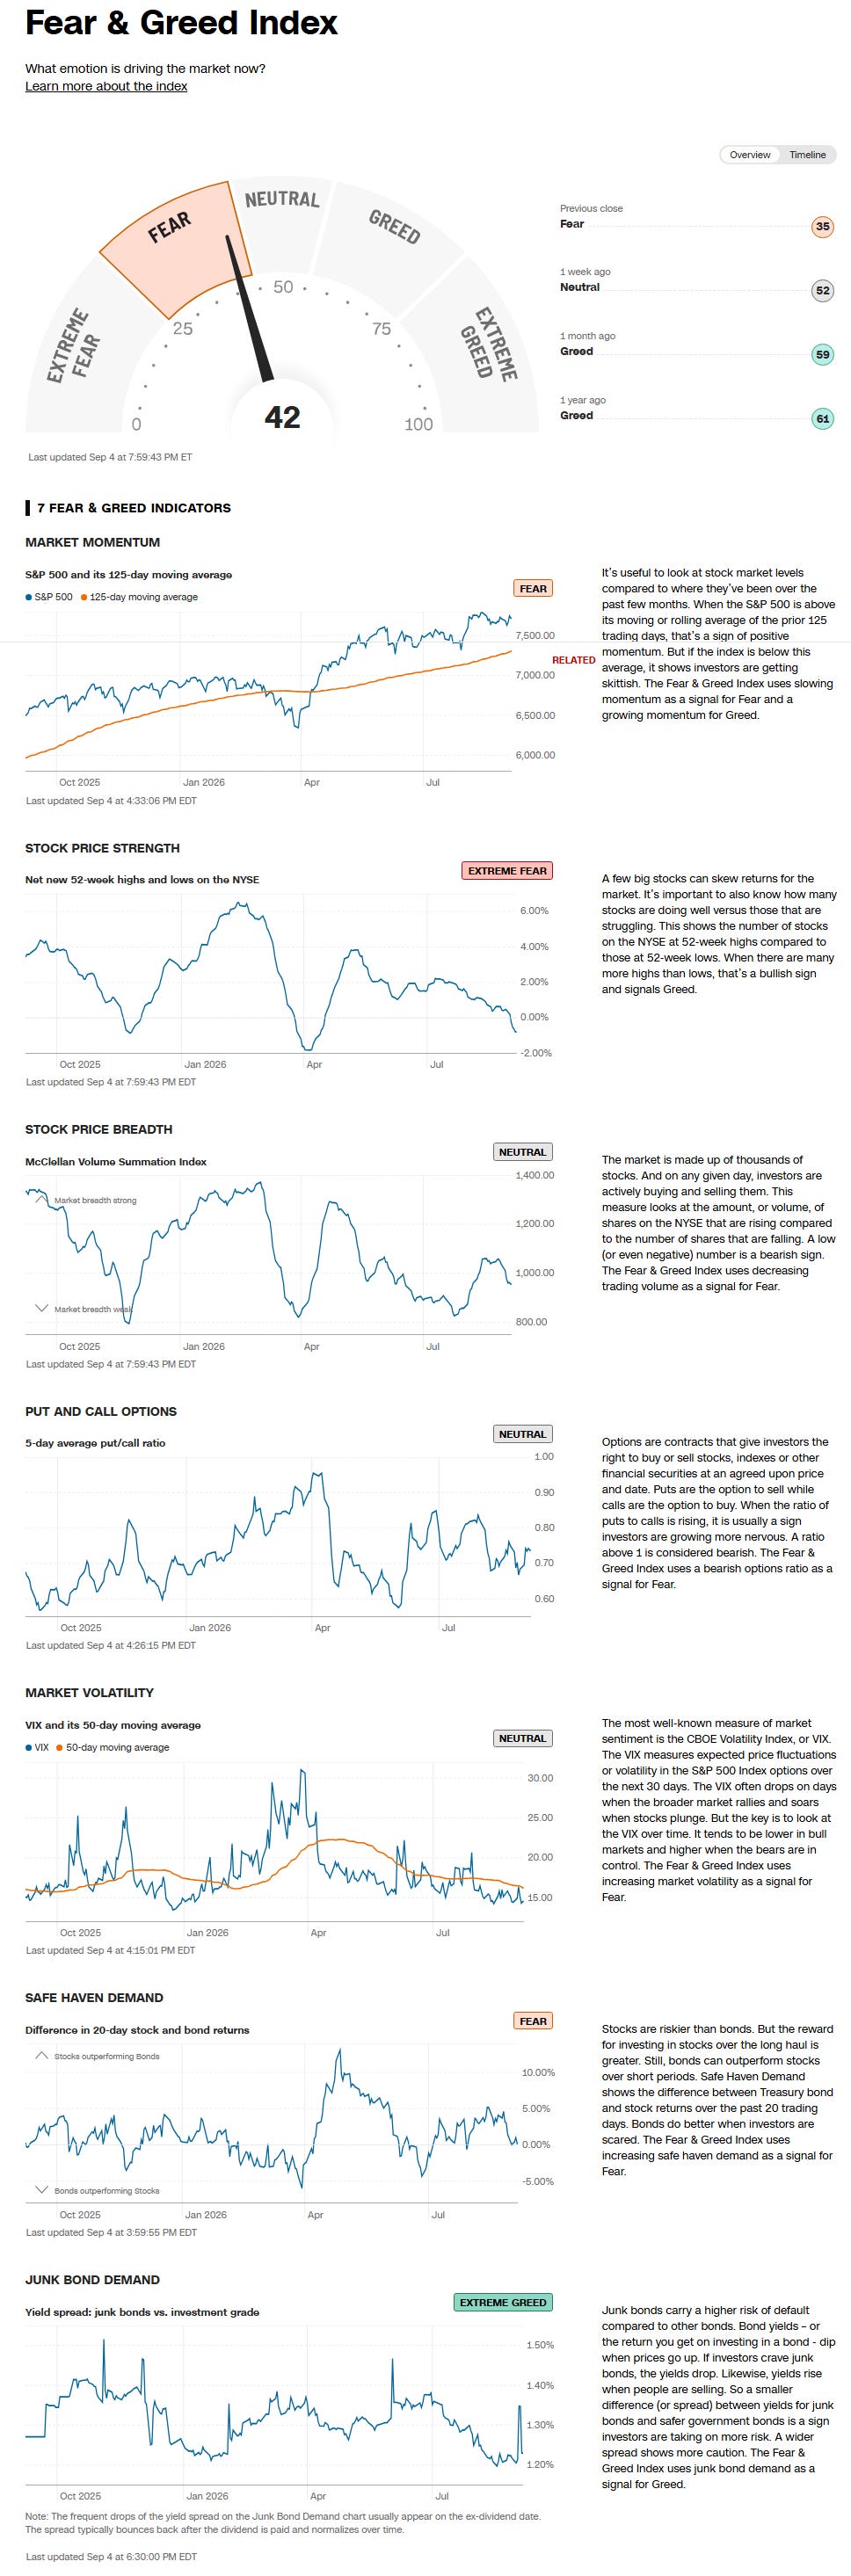
While the CNN Fear & Greed Index (red line) dropped sharply from last Friday’s reading of 54.4 to 30.9 as of Tuesday before rebounding to finish at 41.9, not though getting out of “Fear”.
In that regard, after the past few weeks seeing three indicators above Neutral and three below, we’re down to just one above and three below.
As a side note, if you have any questions on the indicator, TheStreet Pro’s own Jason Meshnick is your guy, as he created it.
Extreme Greed = junk bond demand (vs investment grade)
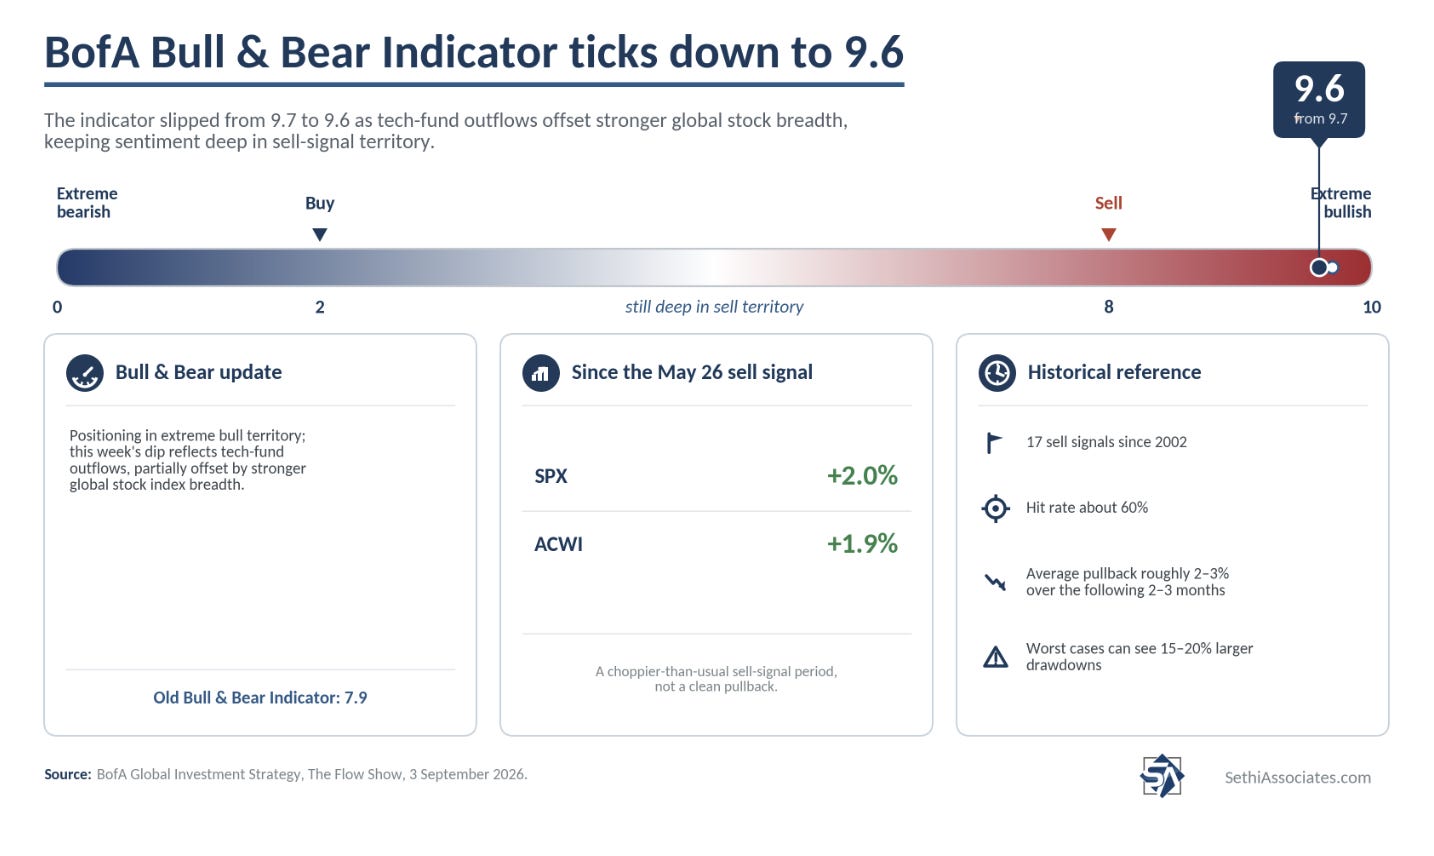
And BofA’s Bull & Bear Indicator eased back a tenth to 9.6 from the joint highest since 2021, still remaining well above its sell signal (8.0) which it crossed back above the week of May 22nd:
down to 9.6 from 9.7 on tech outflows partially offset by stronger global stock market breadth; positioning in extreme bull territory; “sell signal” triggered May 26th; since then, SPX +2.0%, ACWI +1.9%; “old” Bull & Bear Indicator at 7.9
[From prior weeks]:
BofA Bull & Bear “sell signal” remains in place, extreme bull positioning says markets “toppy”, reduce equity exposure, retreat or rotate much smarter summer tactic for risk assets than reload.
17 “sell signals” since ‘02, average loss for global stocks over 2-3 months is 2-3% (hit ratio of ~60%), with max drawdowns of 15-20% (caveats always “tops are a process, lows are a moment”, i.e. greed harder to reverse than fear).
And Helene Meisler’s X followers flipped over to the most bullish in a month from bearish the prior week.
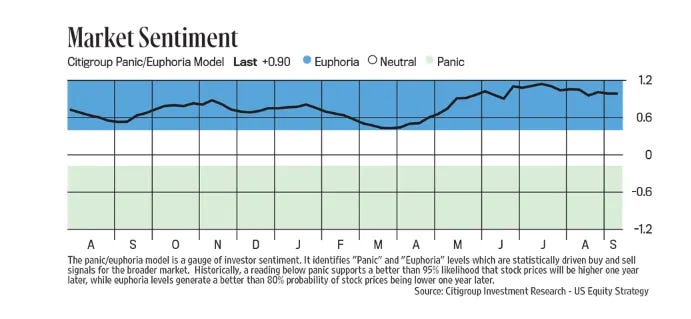
While the Citi panic/euphoria index remains squarely in Euphoria just a little off the highs. I should note it has had a fairly poor track record over the past couple of years:
While the fine print says “[h]istorically…euphoria levels generate a better than 80% probability of stock prices being lower one year later,” it has seen a mixed track since the start of 2024:
-It entered euphoria in late March 2024 (when the SPX was around 5200). We didn’t get to 5200 by the end of March 2025, but we got closer than I would have thought at 5500 (and we did fall under for one day in April 2025).
-The next entry into Euphoria was in late October 2024 w/the SPX around 5800. The closest we got in October 2025 was 6550.
-The most recent entry was in July (2025) w/SPX at 6200. The lowest we got in July 2026 was 7316 (again failing the lower in one-year test). It’s been in Euphoria ever since.
September Seasonality Is Weak
For overall September seasonality (and the positive flip in October and November) see last week’s post.
This week BBG had this factoid:
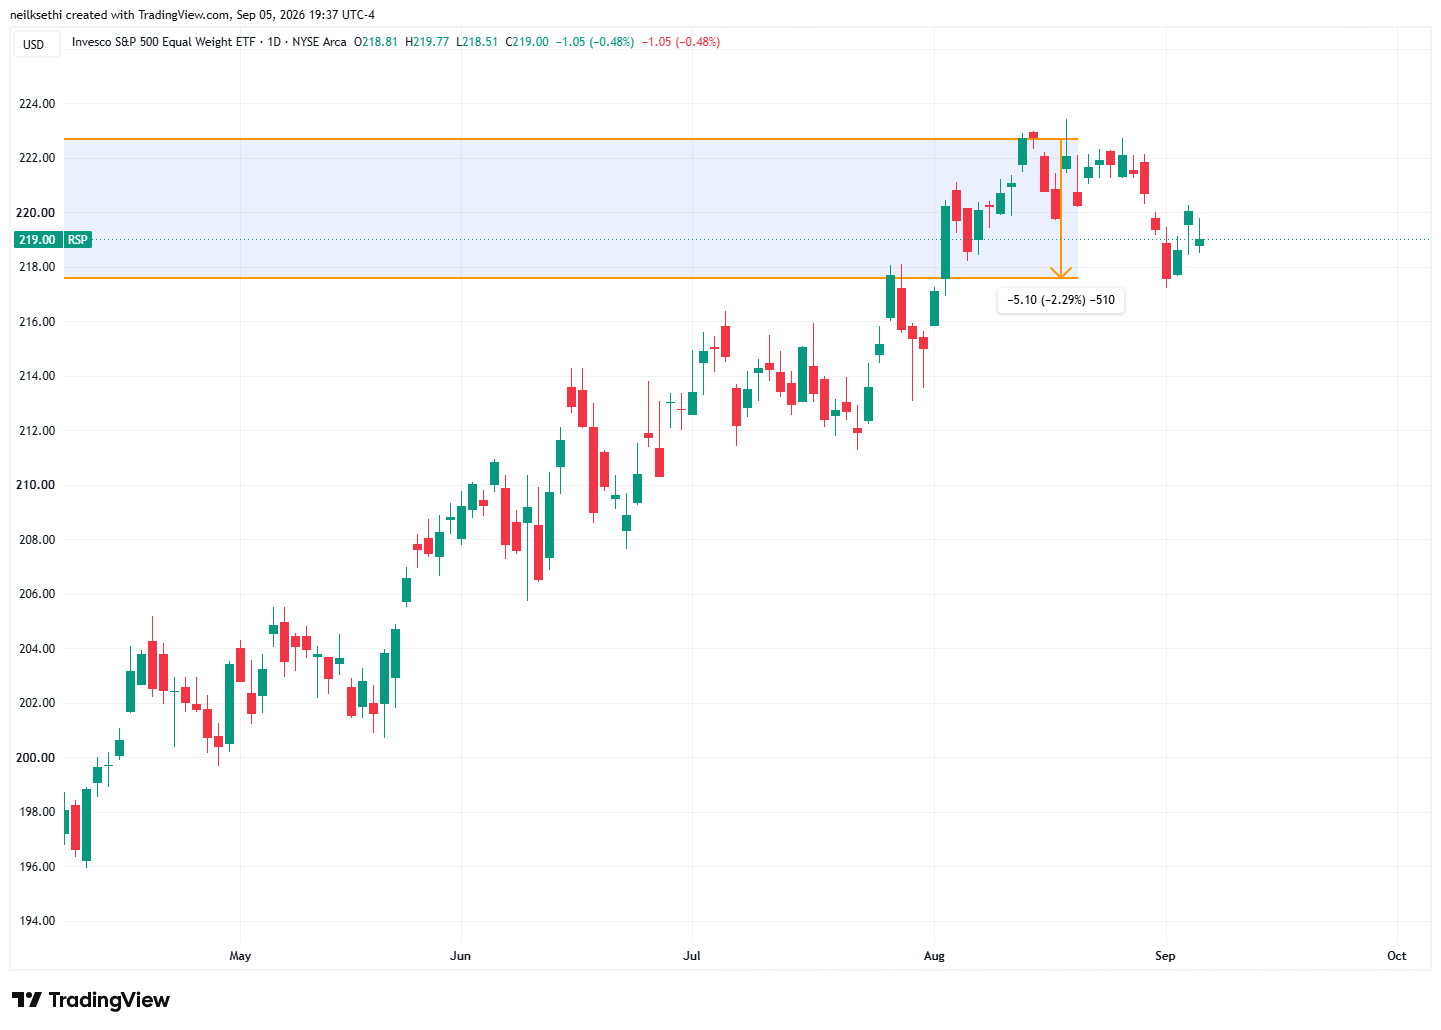
Since 1990 (n=9), the equal-weighted S&P 500 has suffered at least a 7% pullback in the August-October period of a midterm year every time except 2006, when the gauge saw a 9% drop from May to July according to data compiled by BTIG.
So far the largest pullback since May has been -2.3%.
Interest Rates and the Fed Remain Headwinds
Turning to interest rates and the Fed, I removed the “how we got here” over the past couple of months as it was getting fairly lengthy, so if you want to review any of that you can look back to last week’s note.
As I noted,
But there’s little question that the September meeting is not only “in play” but expectations have tipped to better than 50/50 that there’s a hike [currently 60%], while two hikes now are fully priced by March… we very much remain data dependentwith the key inputs the August employment and CPI/PPI reports, although after Warsh’s speech it seems more so the latter – a hot CPI likely seals a hike regardless of the employment report.
And with the hot August employment report, it comes down to the inflation prints this week. For a Fed that has said too many times to count that they don’t want to overemphasize any one data point, the fact that a September rate hike perhaps comes down to whether core CPI prints above or below 0.25% is more than a little strange, but that’s the world we live in.
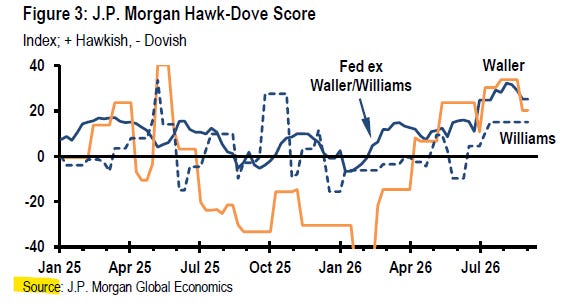
This razor edge was confirmed by Governor Waller this week:
Waller: “The short version is that, while inflation remains meaningfully above the Federal Open Market Committee’s (FOMC) 2 percent goal, recent data suggest we are finally seeing some signs of disinflation. If this continues in the data due over the next two weeks, I would be inclined to support holding the target for the federal funds rate at its current setting…. If the incoming data for August show this improvement has been fleeting, then it may be appropriate to raise the policy rate when the FOMC meets on September 15 and 16.”
But Goldman, JPM, Morgan Stanley, and BMO all continue to look for a hold in September even after the hot jobs report (in contrast to BofA who continues to look for a hike):
Goldman (this was from before the jobs report): “We continue to expect that core PCE inflation will print at around 0.2% month-over-month in August and that the FOMC will remain on hold. The bond market read Waller’s speech as dovish, with a roughly 6bp decline in the 2-year Treasury yield in response to its release and the subsequent interview. Markets now price the probability of a September rate hike at slightly below 50%, down from around 60% before the speech [which rose back above 60% following the jobs report Friday].”
MS (Gapen): Chairman Warsh was hawkish at Jackson Hole, but we are not convinced it means the Fed is ready to start a hiking cycle.
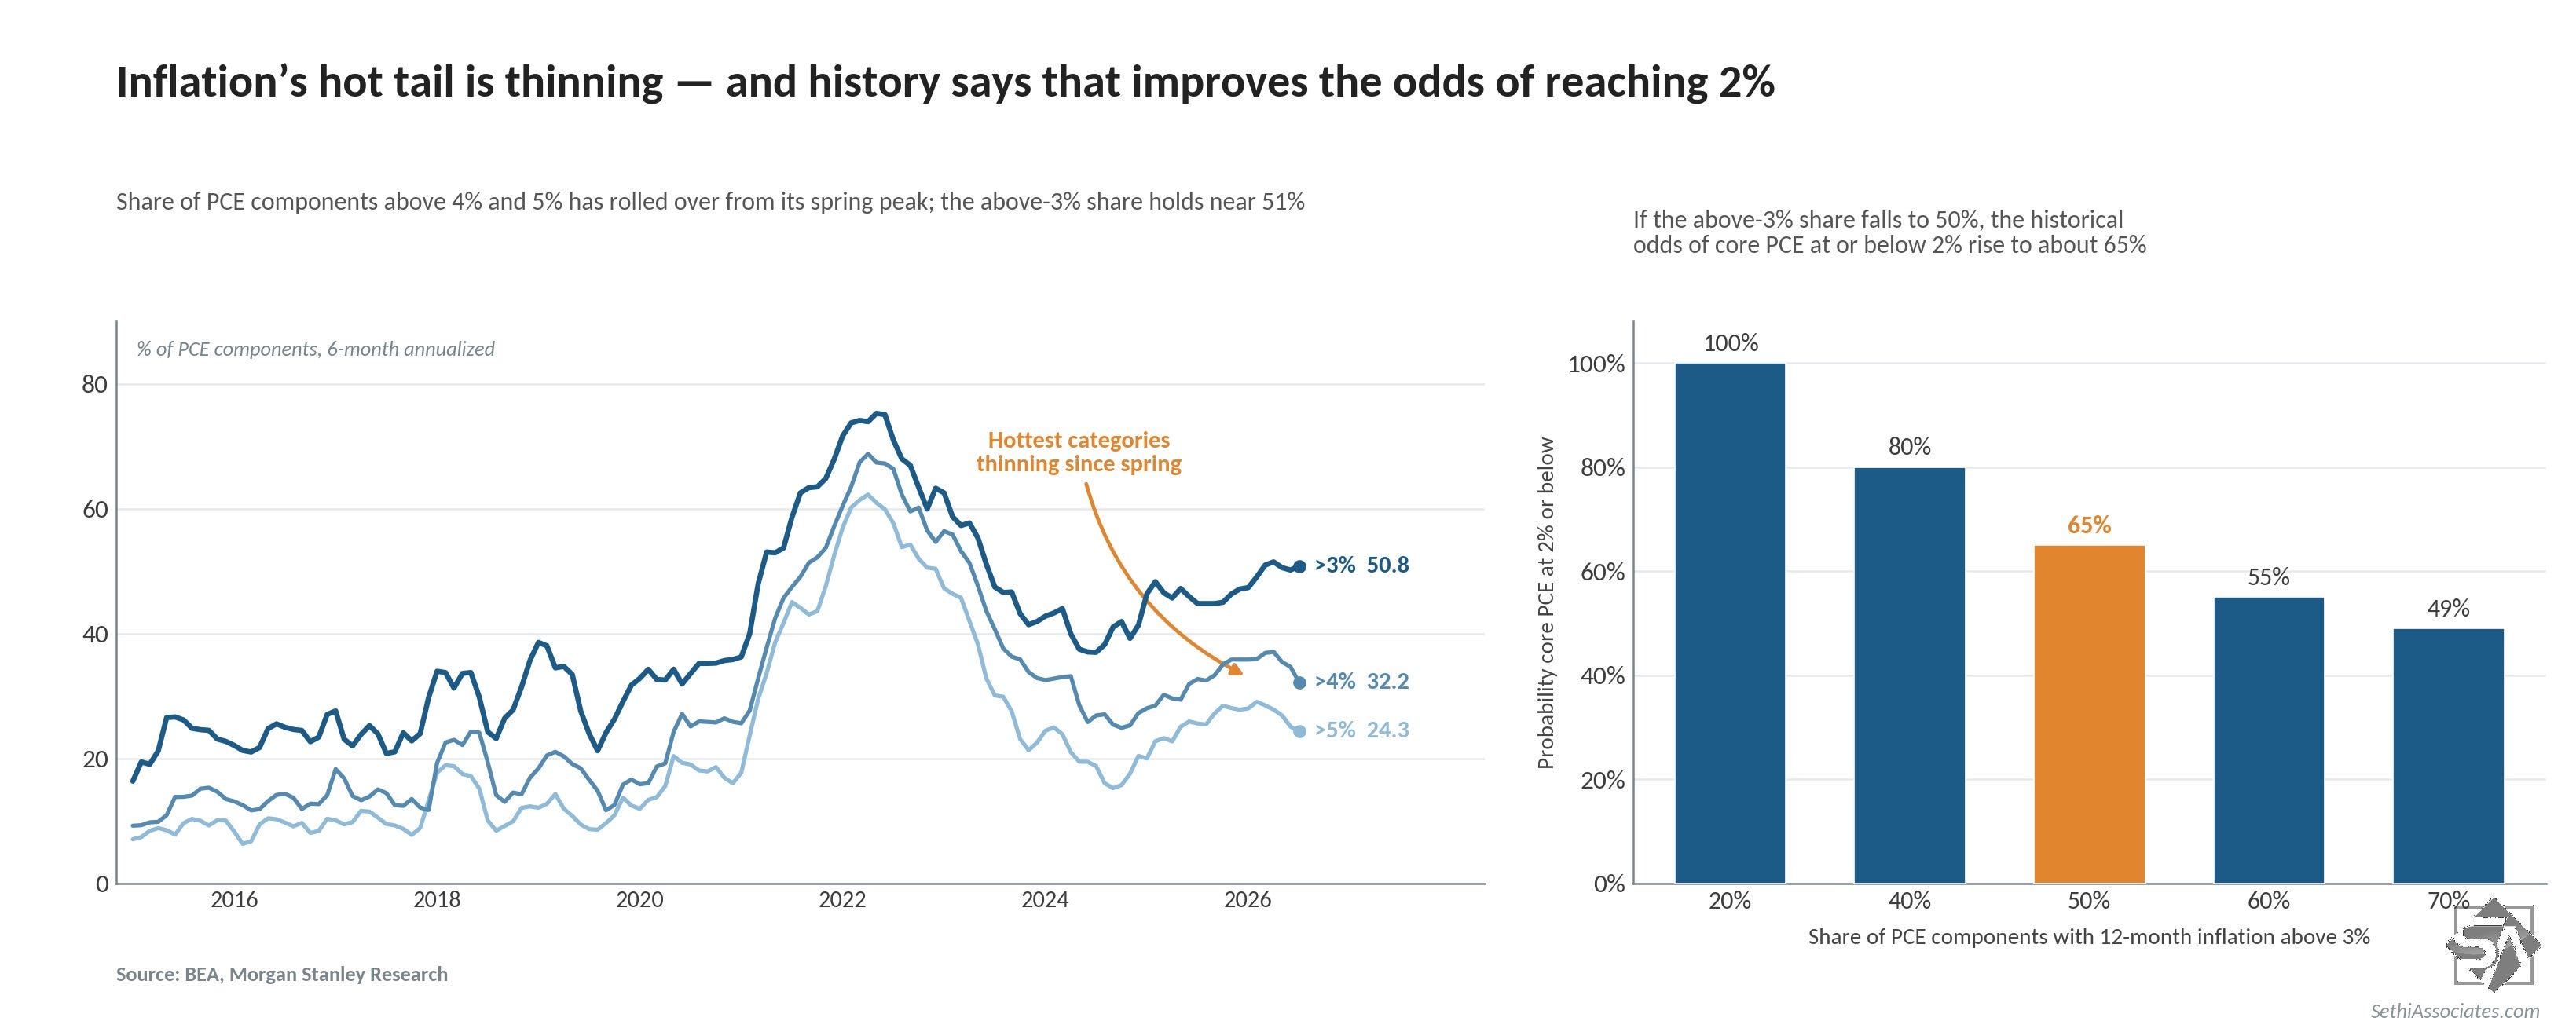
We would not take the chairman’s comments at face value as forward guidance… Chairman Warsh has made clear that he dislikes forward guidance. Instead, we think the speech was intentionally hawkish, potentially aimed at preserving FOMC optionality… Warsh focused on measures of inflation breadth, particularly the share of goods and services categories running above 3%, arguing that there has been little progress on that front.
We make two observations on inflation breadth. First, it is not necessarily a measure of the underlying inflation trend. The elevated share of categories running above 3% year over year largely reflects the recent increase in headline inflation… In other words, once actual inflation is known, breadth provides limited additional information.
Second, there has been some recent progress. On a six-month annualized basis, the share of categories running above 3%, 4%, and 5% has declined in recent months, pointing to further improvement ahead… historical data imply that the probability of core PCE inflation reaching 2% or below rises to roughly 65% once the share of categories with inflation above 3% falls to 50%, compared with 54% currently. The recent decline in the six-month annualized measure suggests that the breadth indicator is moving in that direction.
JPM (Feroli): A broad hawkish shift has been evident at the Fed in recent months, but recent communications highlight divergent biases heading into September. Governor Waller, who likely represents the patient majority that favored holding rates steady in July, argued that underlying inflation is moving lower and that proper risk management would be to “give disinflation a chance.”
His view contrasts with Chair Warsh’s assessment that underlying inflation has not improved, as well as with the arguments from hawkish dissenters that risk management warrants an immediate rate hike to limit the need for more disruptive action later. Next week’s inflation readings will play a key role in resolving this internal debate over the September decision. Our forecast for a 0.21% month-over-month increase in core CPI is consistent with the Fed remaining on hold. However, a stronger inflation outcome could shift the decision.
Uncertainty around Chair Warsh’s position also remains high. We believe that if he advocates for a hike to build credibility and establish his leadership, that stance would likely be received positively and deliver the votes needed for action.
BMO (Lyngen): “At this stage, we see a low bar for the inflation data to favor a rate increase, even as a hawkish hold on the 16th remains our base case scenario.”
“A third consecutive month of tame underlying inflation that implies a further decline in the three-month annualized pace of core PCE would provide a credible fundamental backdrop for a hold,” the bank said, adding that “as long as August [CPI] inflation isn’t hot, [FOMC] swing voters may have an incentive to stay on hold for another meeting to digest the PCE methodology changes.”
“if short-term annualized measures of underlying inflation cease to signal progress toward 2%, it would be difficult for the Fed to leave rates unchanged in September without risking its inflation-fighting credibility.”
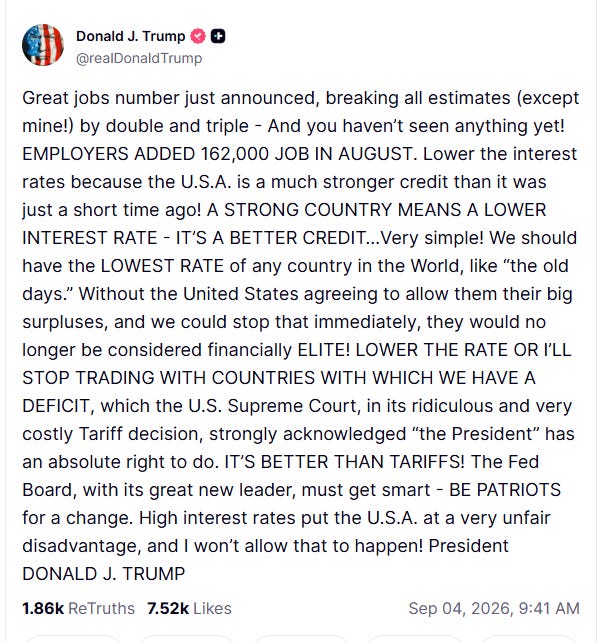
And if there was any question about how the President feels about a potential rate hike, he made it pretty clear with a social media post this week, not really helping Warsh’s cause (if he raises (or I guess doesn’t cut) he irritates the President, if he holds or cuts, he’s pandering).
As noted in previous weeks, if they don’t go in September it seems there’s little chance they go in October just a handful of days before the mid-term elections. That would push a first rate hike to December which stands at a 90% chance currently. But if they do go in September it likely means they go at least one more time this year.
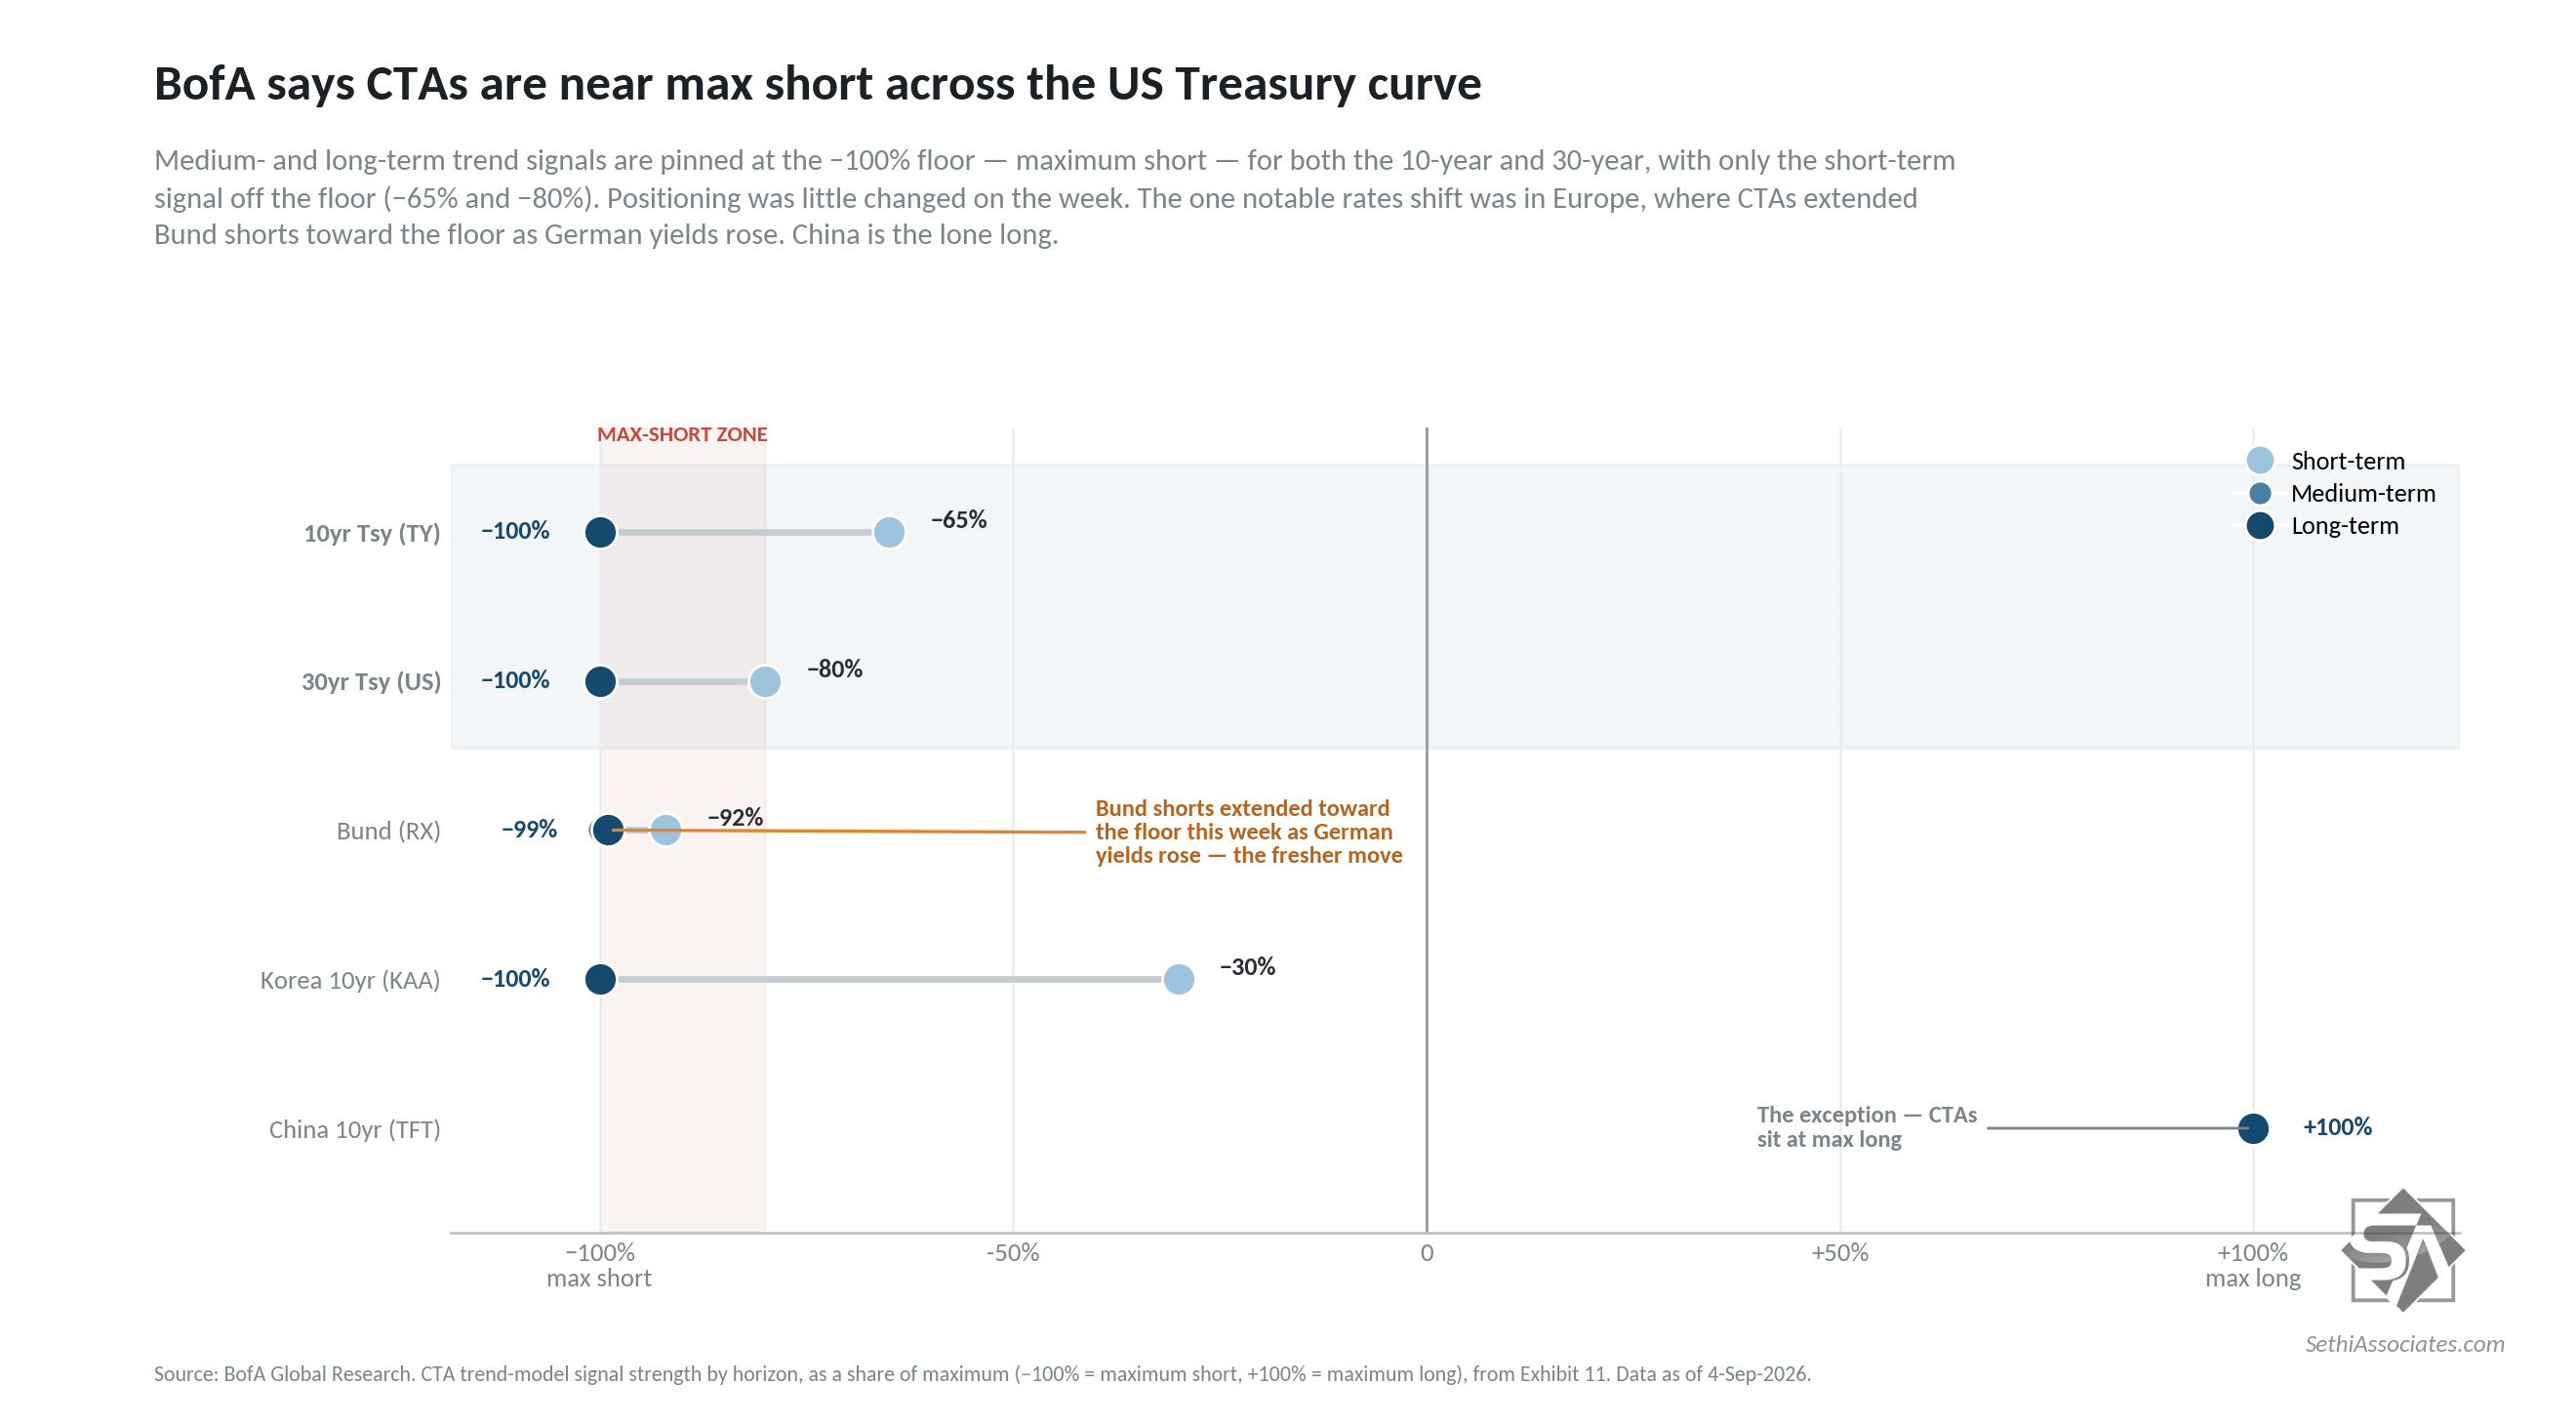
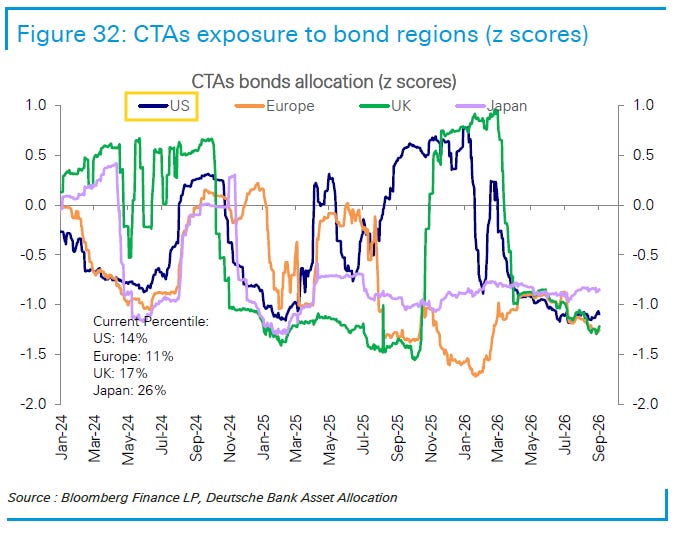
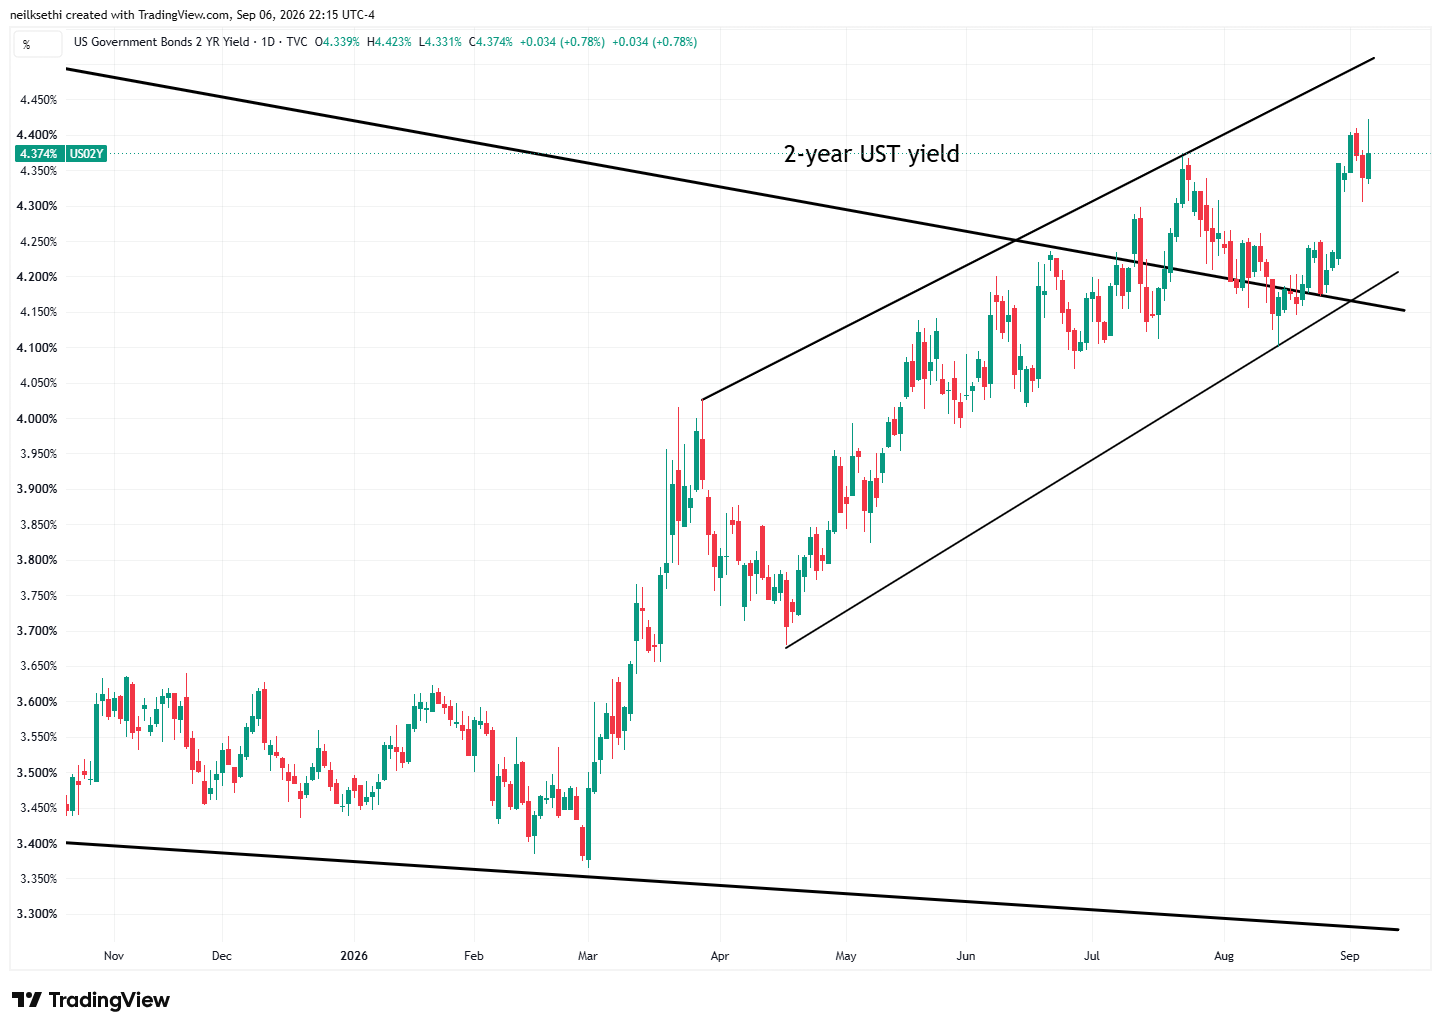
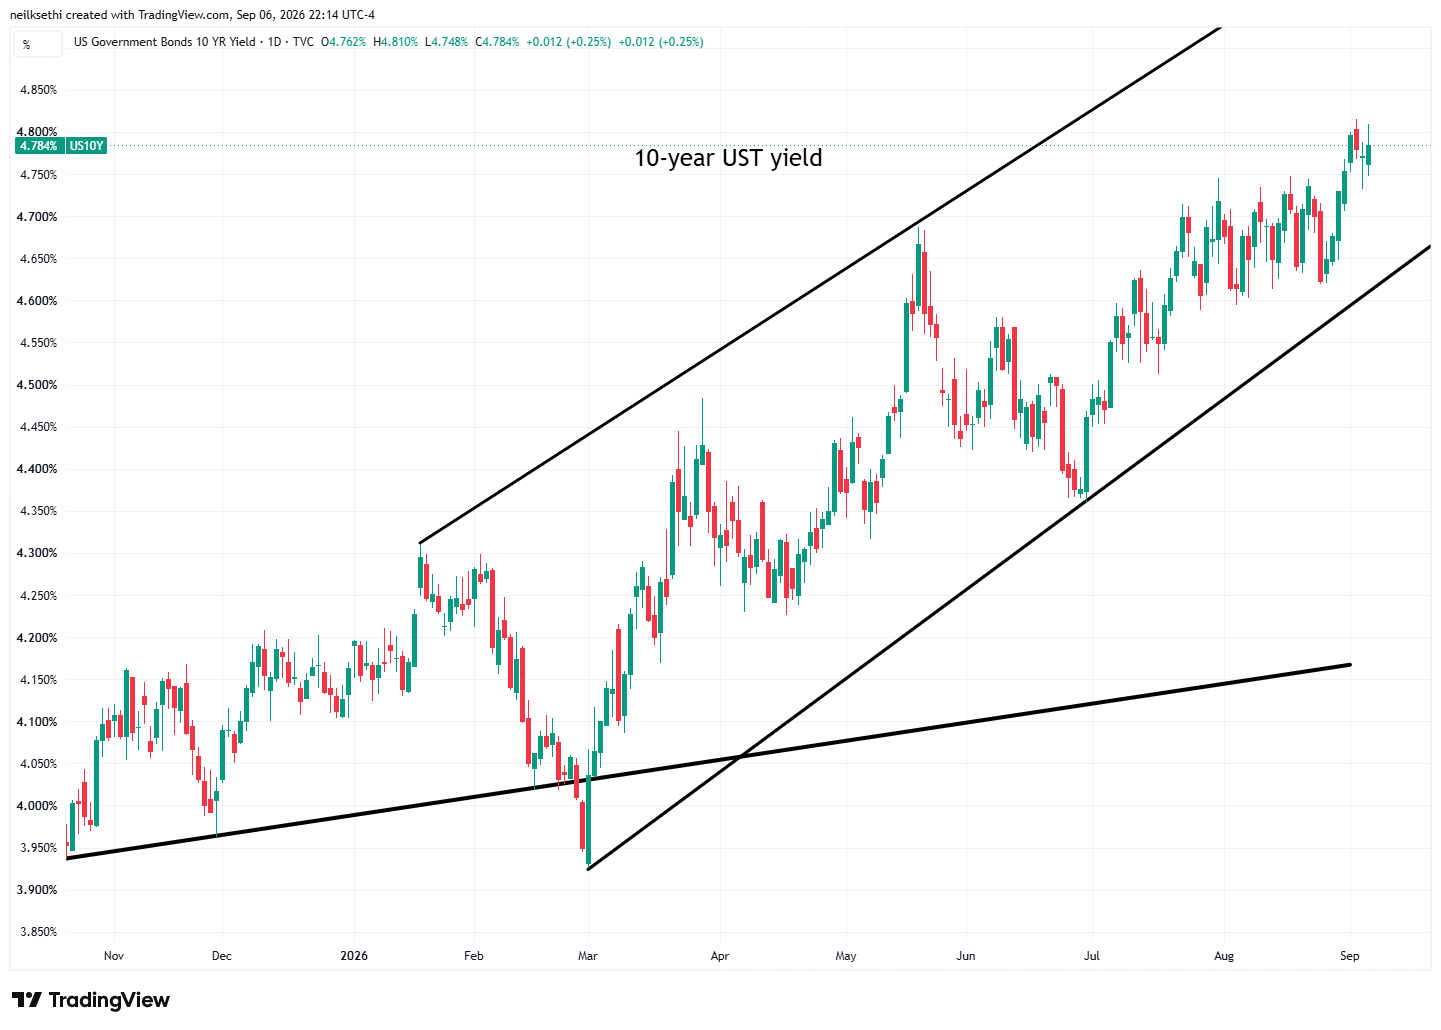
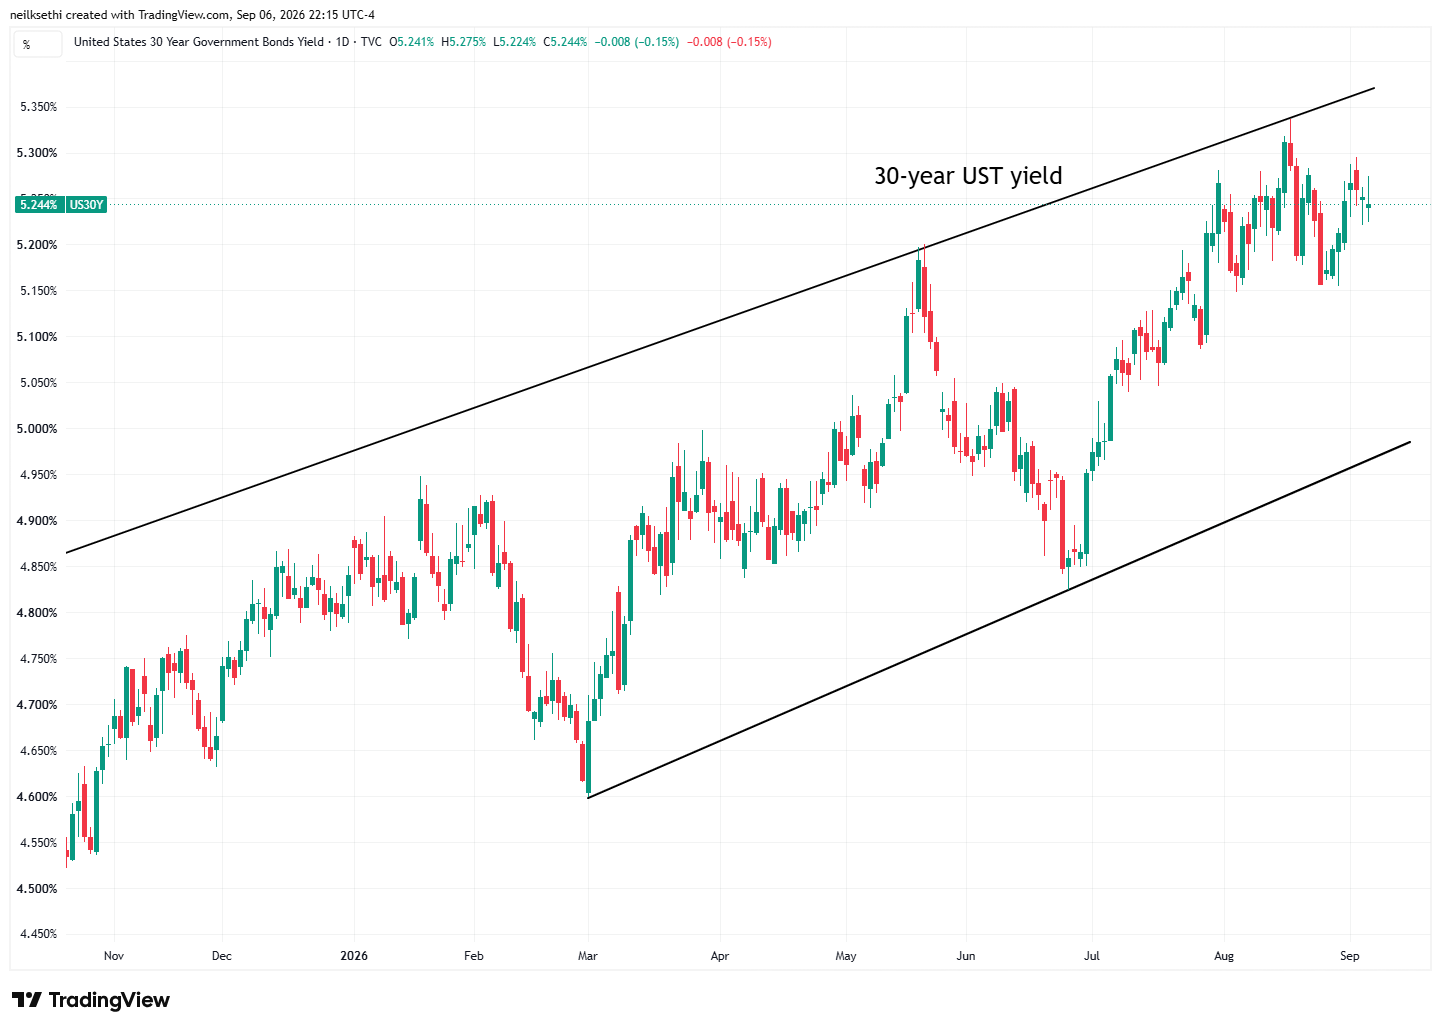
Turning back to rates, the drop in bonds (increase in yields) kept CTAs very short Treasuries where they already were “stretched” with cover triggers even further away.
DB similarly says CTA “bond shorts remain extreme” at just the 14th percentile to 2012 for the US.
Overall, on yields, for now we remain in my new ranges established at the start of August: “I still think that 5% on the 10-year and 5.75% on the 30-year represent areas where we will see very strong buying. On the 2-year I think a lot depends on whether the Fed hikes. If they do, there’s potentially another ~30 basis points to the upside (~4.75%). If they don’t, I think we’re going lower from here.” If we were to see any of those levels I would most likely be adding to my bond positions.
Wrap-Up – Do We Get the Highly Anticipated September Pullback?
I noted two weeks ago an observation from Deutsche Bank that they highlighted again this week:
As we wrote recently, equities have shown a clear pattern of being range-bound in between earnings seasons over the last few quarters. In keeping with the pattern, the S&P 500 over the last month has chopped in a tight range of just over 2% despite several high-profile catalysts
As I mentioned then that “lull phase” if correct will extend another week or so. And as I mentioned last week, “you can add poor seasonality to that, along with pressures from yields and an increasingly hawkish Fed” (how hawkish we’ll find out a week from Wednesday).
And this week Citadel’s highly regarded Scott Rubner gave a more detailed look at why he’s looking for a September pullback:
As I also mentioned last week, “perhaps my largest concern is with systematic positioning which is by any measure overweight and by some measures quite extended, leaving that positioning vulnerable to either a jump in volatility or further equity declines exceeding 2% or so.” That remains the risk I’m watching most closely.
Set against it, though, is a long list of reasons to be bullish. The economy continues to look resilient, if uneven, with GDP trackers still pointing to solid growth. Earnings have been extraordinary, and while expectations are for growth to slow, it holds at double-digit levels through 2027. Valuations have continued to ease. Positioning is not uniformly stretched — on the discretionary side in particular there is plenty of room to move higher. And outside of BofA’s Bull & Bear Index (which hasn’t been much use since it was reformulated in December), sentiment sits just moderately bullish to neutral (a good place for equity gains historically).
The technical and flow picture reinforces it: dealer gamma is positive again, suppressing volatility and encouraging larger systematic holdings; buybacks are back in full force; and retail continues to keep allocations high. None of this eliminates downside risk, but together it makes it hard to turn too negative unless the data, rates, or flows deteriorate more meaningfully.
So my view continues to be that the setup is constructive — but with positioning this extended and markets on edge, this is not a time to be complacent. Pullbacks and chop come with the territory, and a material pullback would not surprise me. But as of now there’s no reason to make that our base case.
Looking at the week itself, the calendar is light on major catalysts until we get later in the week. The Treasury auctions Wednesday and Thursday, along with Oracle earnings Thursday, are the notable items, but the stars are the inflation reports. PPI on Thursday could carry some influence as a read-through ahead of CPI, and Friday will be dominated by CPI, which looks to hold the keys to the September rate decision.
Citadel's Rubner looks for "tactical reset" in September:
"I have remained constructive through the summer, and much of that view has played out. Earnings were exceptional. The July reset cleaned up leverage and positioning. Retail returned. Volatility collapsed. SystematicShow more