The Speculators Are Loading Up on Calls, While the Insiders Are Loading Up on Cash
The question is, who will be correct, the traders or the corporate execs?
You've reached your free article limit
You've read 0 of 1 free Pro articles.
Last Wednesday everyone seemed a bit hysterical over the put/call ratios. It was my impression the moving averages were low but ought to go lower. At the time, I thought we would get them lower this coming week. And that has come to pass.
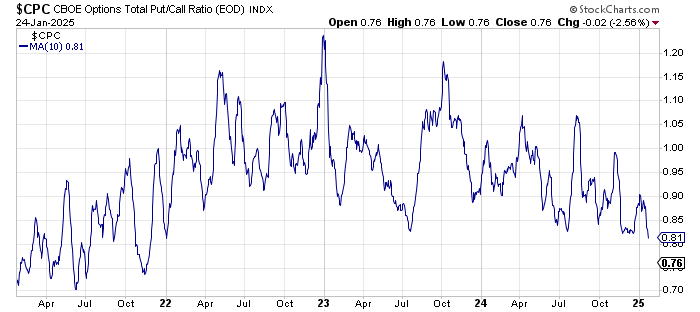
The ten-day moving average of the put/call ratio has come down to .81. This is the lowest reading since January 2022. If you look at the chart, you can see the moving average was steadily rising from the summer of 2022, whereas now it has been steadily falling since October 2023.
I believe that only matters a bit. I believe that once this moving average approaches (and/or crosses through) .80, we’ve got too many calls being bought. So that has flipped in the last week of trading as this has stretched to a lower low.
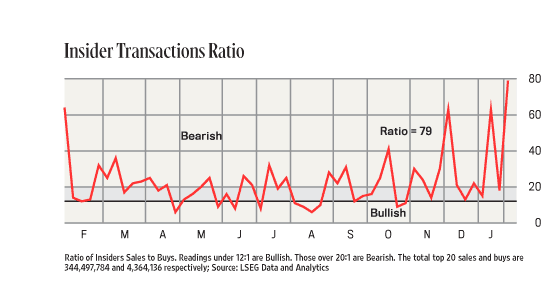
There has also been a change in the Insider selling ratio. For the third time since early December, it has spiked. So, while folks are loading up on calls, Insiders are selling stock. Oh yes, I know someone will surely tell me that insiders sell for a variety of reasons, but they buy for only one. I call that rationalizing an indicator, especially when there are three such spikes in not quite two months. Are there that many insiders who need to pay for their child’s college education?!
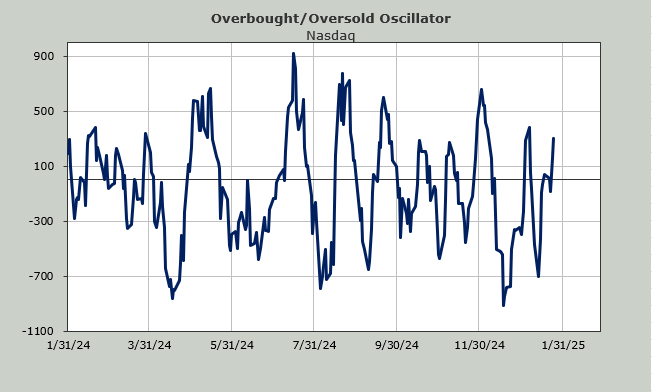
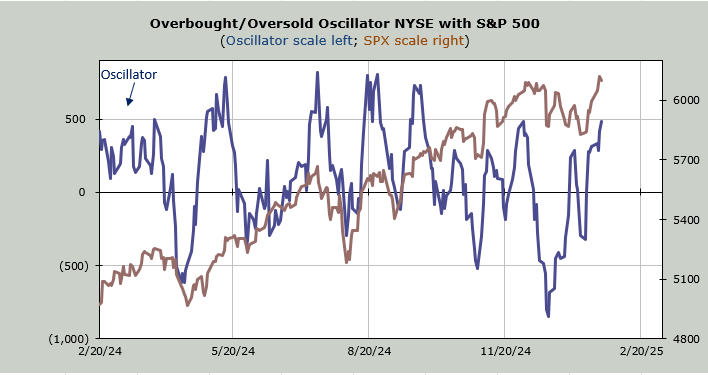
As we head into this week my Overbought/Oversold Oscillator will get maximum overbought. Monday is the key day where we will see if this can get up and over 500 in a meaningful fashion. Up and over is an intermediate term positive because it gives this momentum indicator a higher high than it had in December.
After Monday this indicator should head down as the ensuing eight of nine trading days we’re dropping decent red numbers. (i.e. we are dropping positive breadth readings off a ten day moving average).
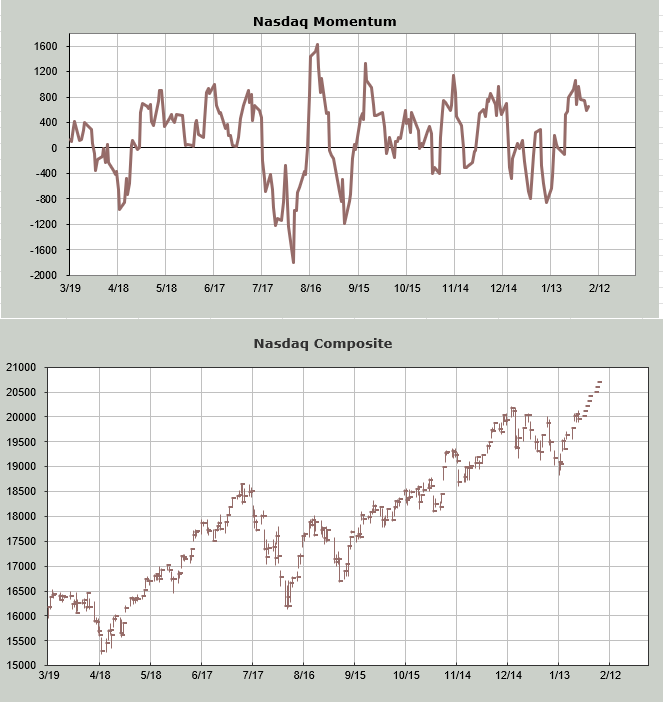
I have even done some ‘what-if’ work on the Nasdaq Momentum Indicator. Here, instead of breadth, I use price. I plug in higher closes over the next week or so (in this case, I walked Nasdaq up about 750 points) to see when the Momentum Indicator peaks. That occurs on Tuesday. Remember, the exact day is not what matters; it’s the general time period. So this confirms what my Oscillator is saying: short-term overbought this week.
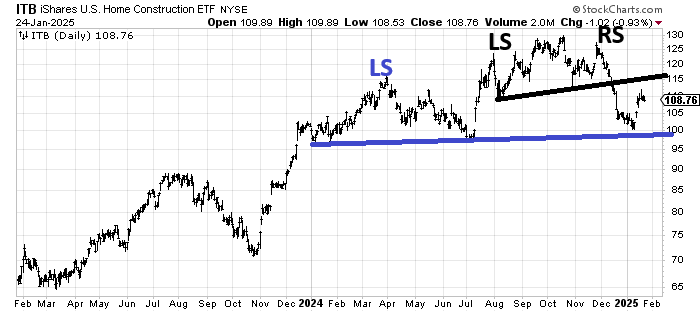
I want to finish up with a discussion about the chart of the homebuilders, using ITB. It broke down from a small head and shoulders top (black) in December. It bounced off support (blue line). Right now it is flattish over the last year. If ITB fails under 115, heads back down and breaks 100 that completes a much larger top (blue).
The bullish outcome would be that ITB just goes sideways and continues to be flattish. The bearish outcome is a break of that 100 area. This is not something I expect to play out over the next week or even a few weeks, but I think it is a chart you should keep on your screen over the next several months (the left shoulder, should it turn into one, took six months to form so I wouldn’t expect this one to be a week or two in terms of time).
It's worth watching because we’re seeing similar patterns in a few other stocks/groups. It’s just that ITB is much further along so it’s easier to see.
Unless/until we see some breakdowns, the market in 2025 looks like a trading market to me, not a one-direction one.