The S&P 500’s Wild Rebound Is a Sight to Behold. What Happens at 6000?
As May winds down, the index is on track to reach new highs. Here's the level to watch.
You've reached your free article limit
You've read 0 of 1 free Pro articles.
So much for "sell in May."
After putting in a bottom in April, the S&P 500 is wrapping up a strong month of May. With two trading days remaining, the large-cap index has gained 6.5% over the past month.
How wild has the market’s rebound been? For a long-term perspective, let’s take a look at the monthly chart of the S&P 500.
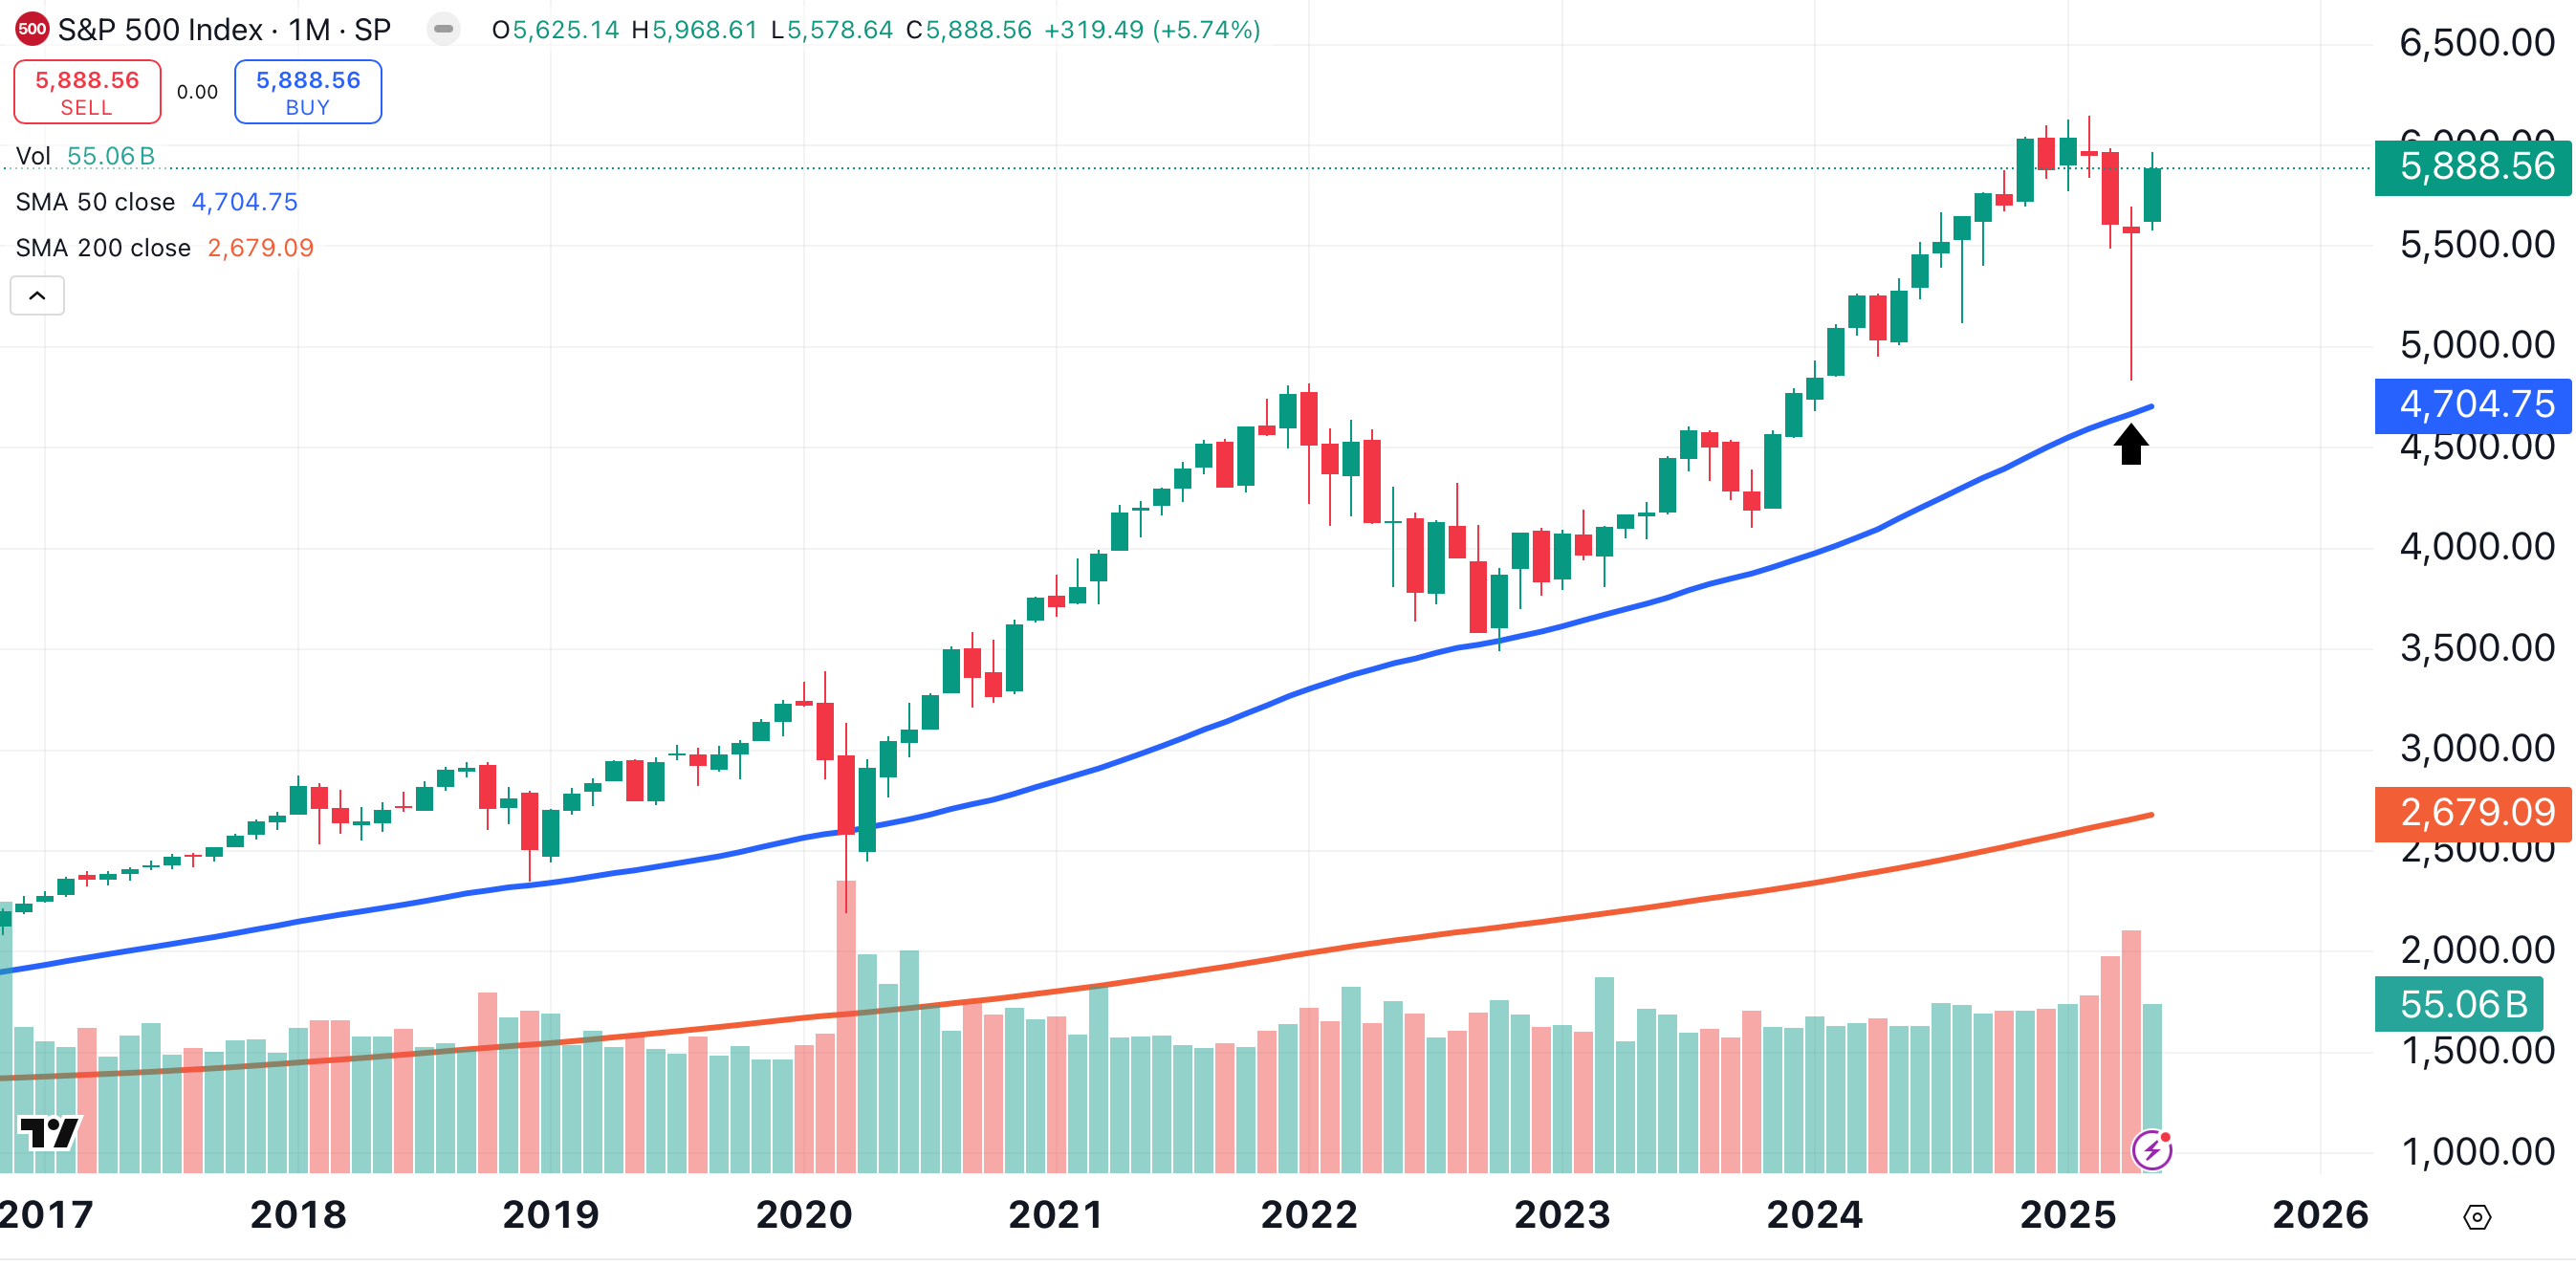
The incredibly long wick (black arrow) on the April candle shook out the weak hands, who were then forced to chase stocks higher. Through it all, the S&P 500’s long-term bullish trend remained intact, as indicated by the rising 50-month (blue) and 200-month (red) moving averages.
What has changed? Tariffs are still a dark cloud hanging over this market. But a U.K. trade deal, along with extended negotiations with China and Europe, have lightened the mood.
It’s also helpful that fears of a possible recession have receded. According to the CME’s FedWatch Tool, there is just a 2.2% probability of a Fed rate cut in June, and just a 22% likelihood of a rate reduction by the Fed’s July 29-30 meeting.
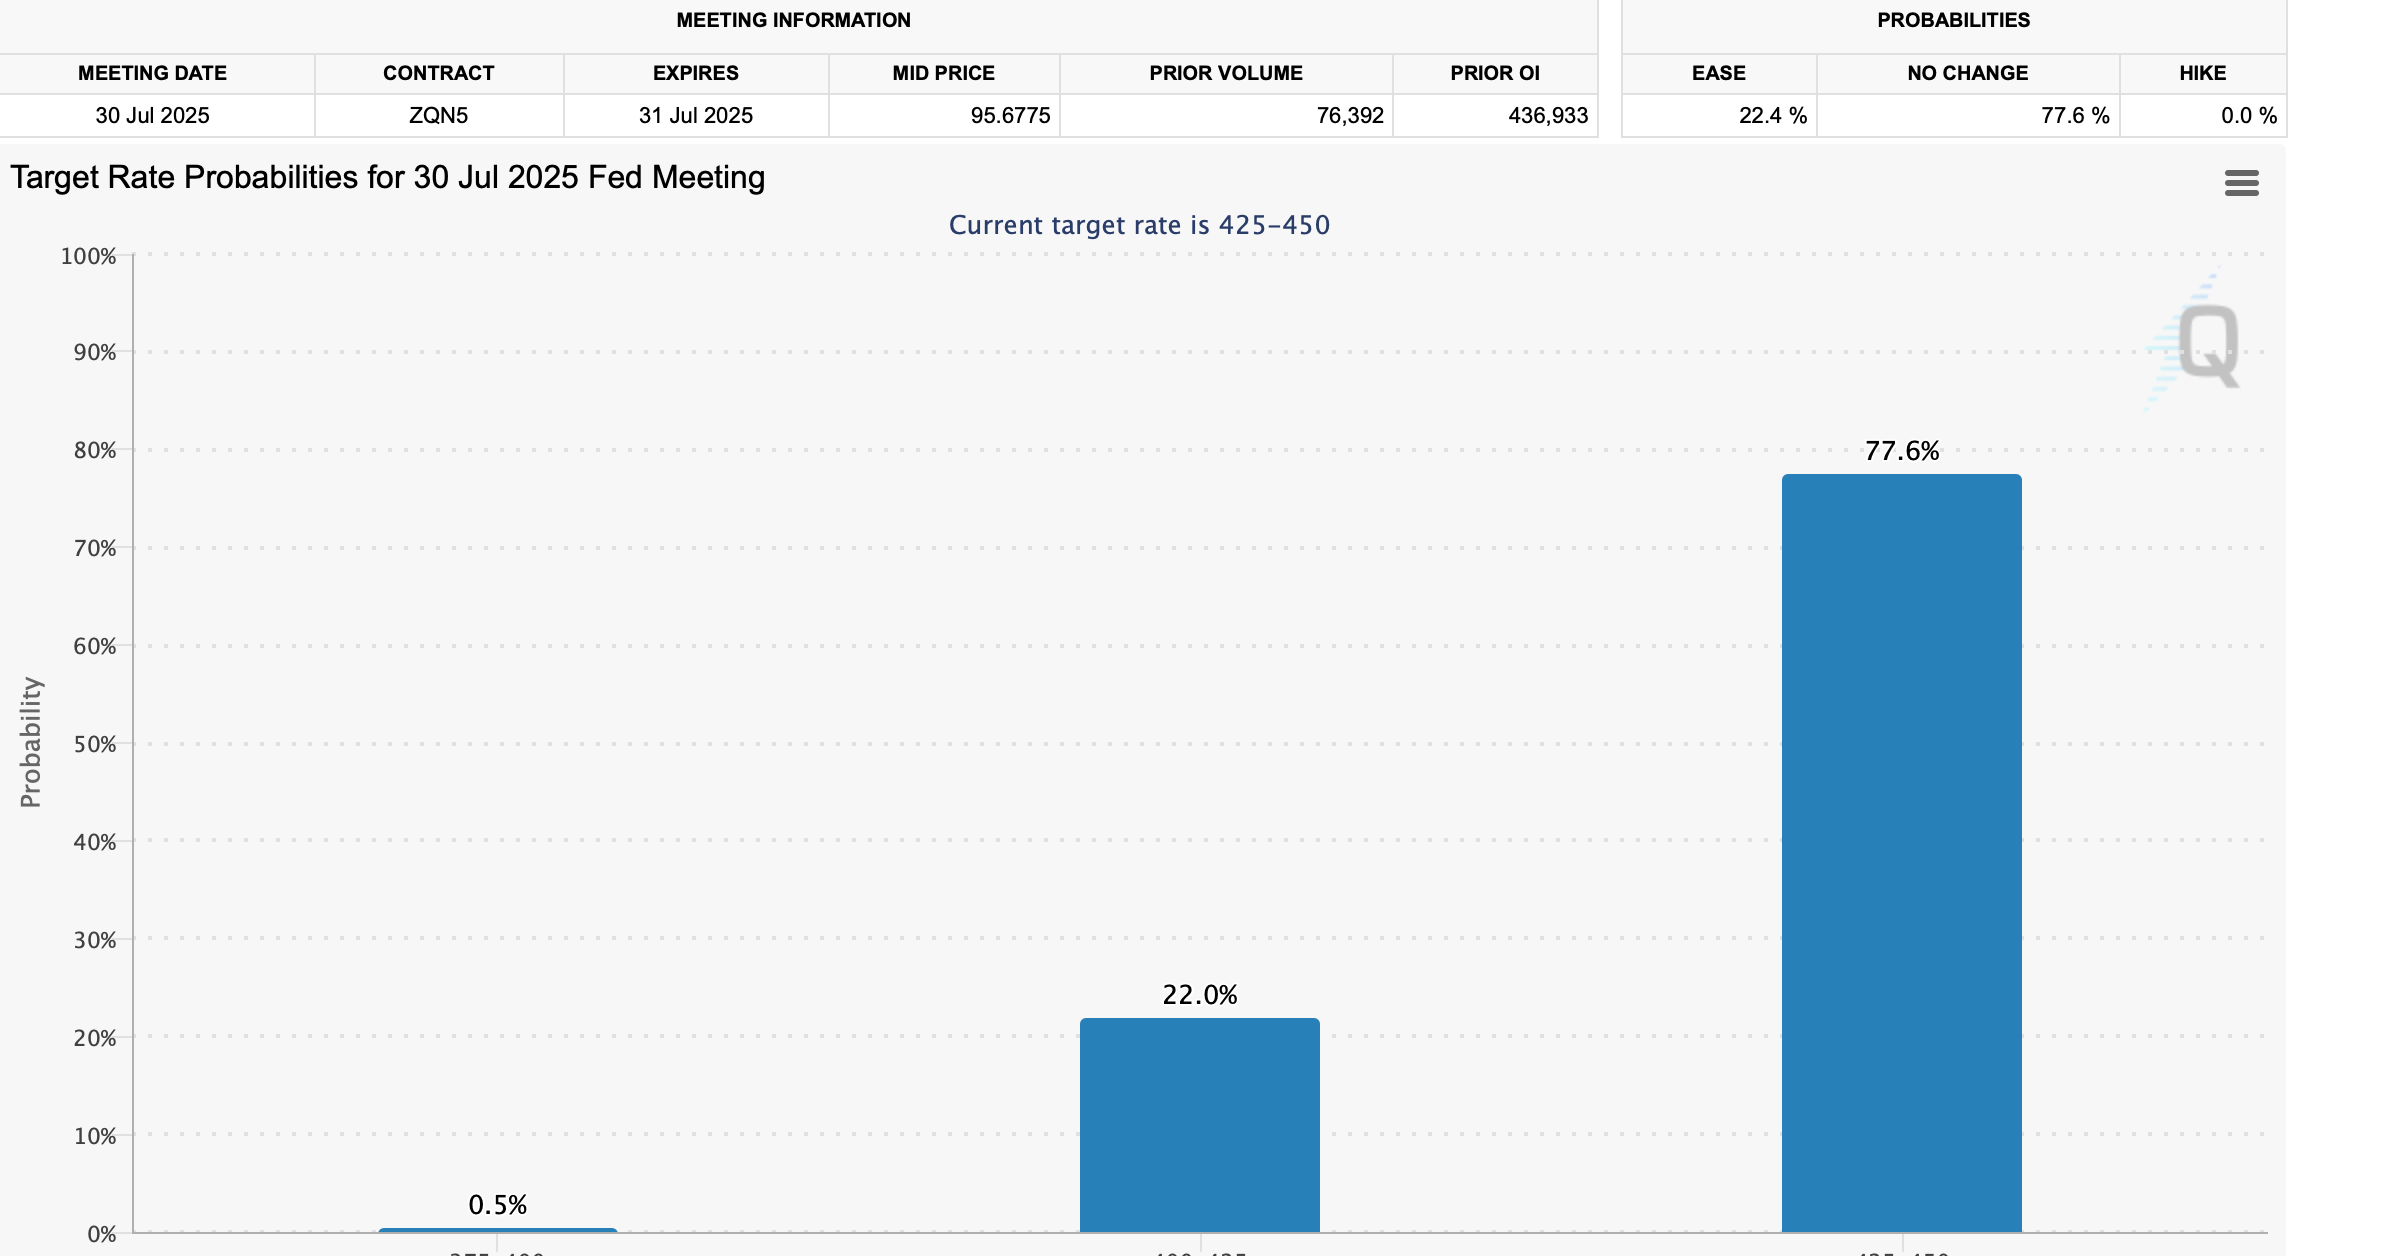
This means we are likely to make it into the second half of this year with no change in the Fed Funds rate. That’s a vote of confidence in a U.S. economy that previously was expected to need assistance via lower rates.
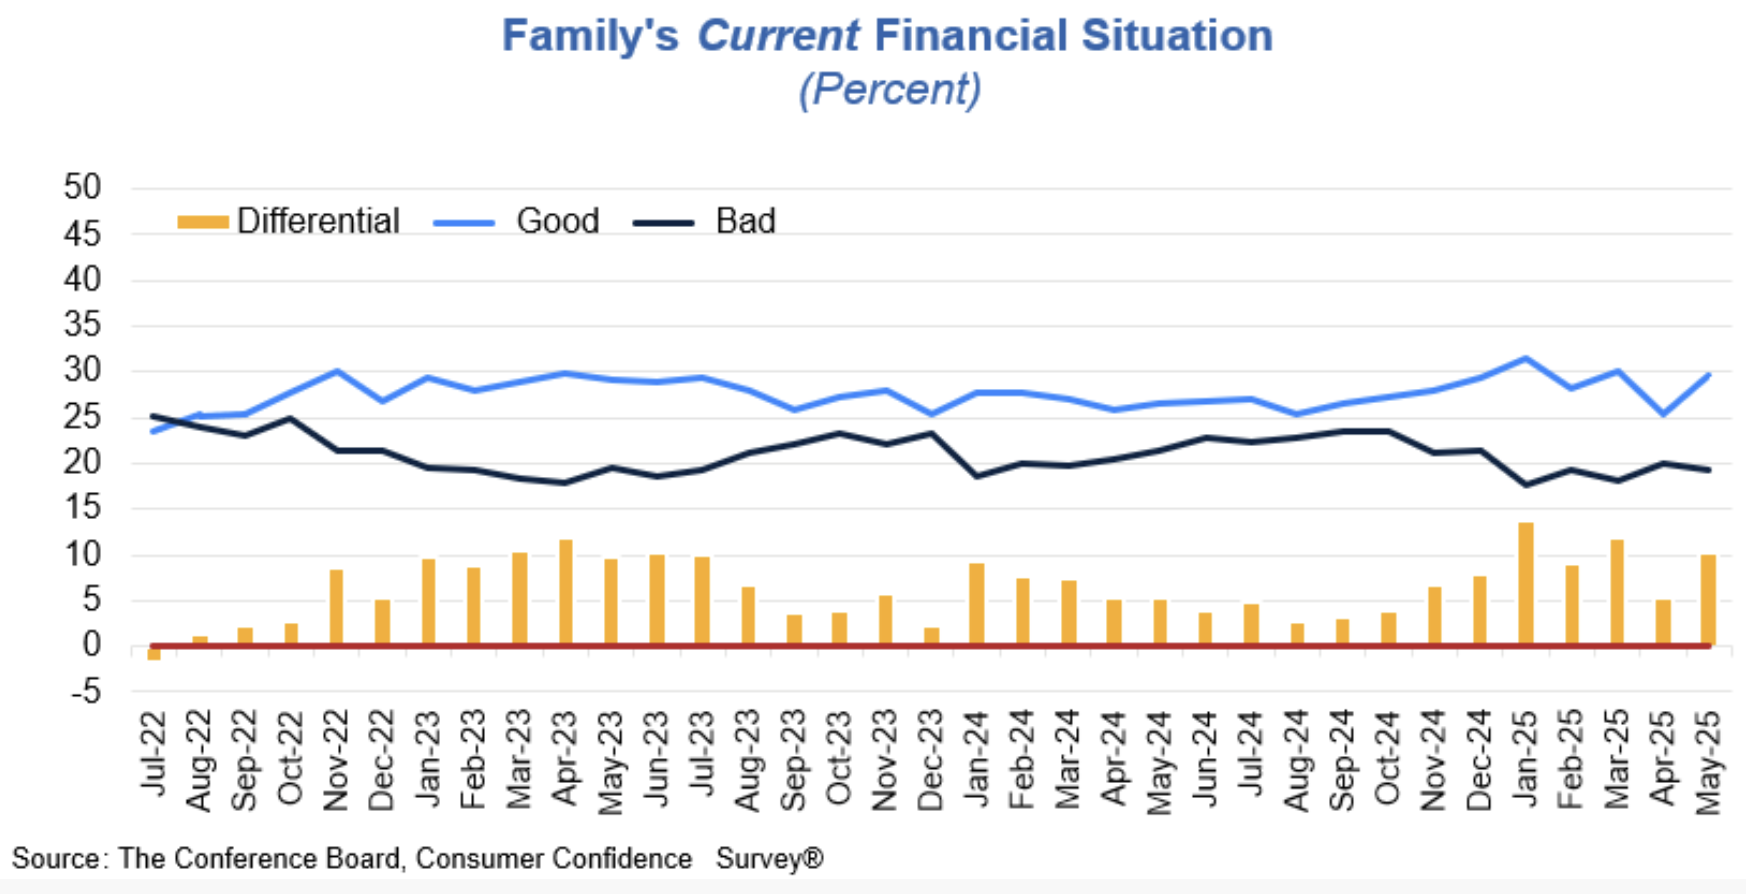
Speaking of confidence, the Conference Board released its latest consumer confidence survey on Tuesday. The result was the biggest monthly increase in consumer confidence in about three years. Confidence soared from 85.7 in April to 98 in May.
Consumer confidence is a leading indicator of consumer spending. The Conference Board also reported that an increasing number of consumers viewed their family’s current financial situation positively in May.
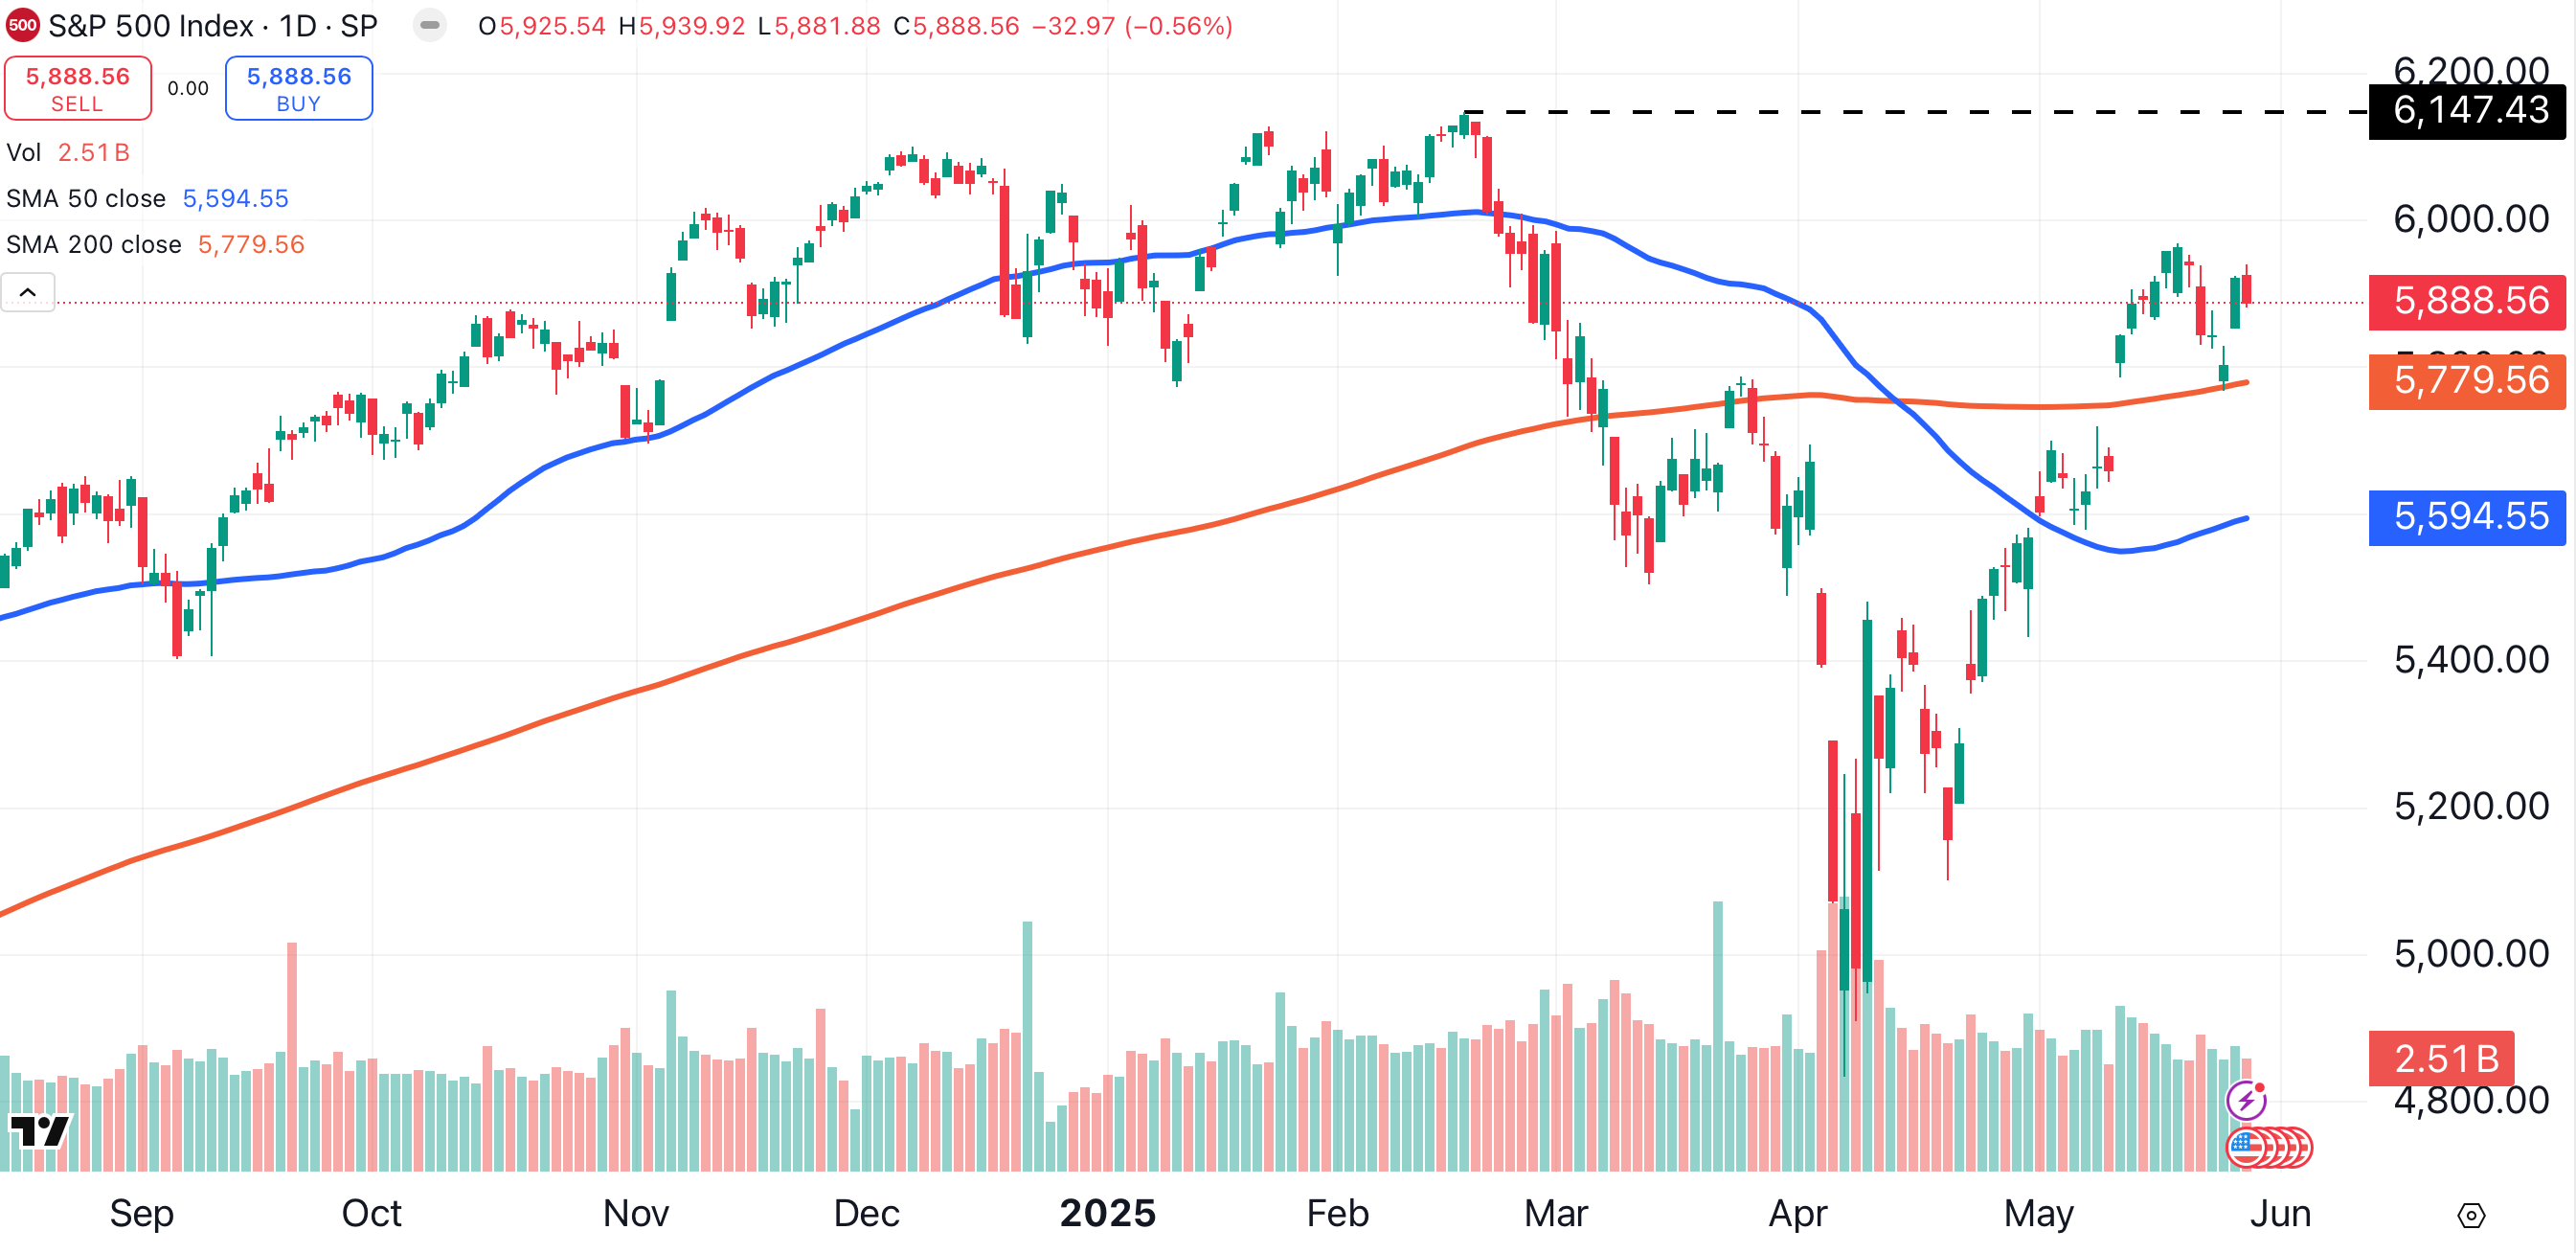
What is the next hurdle for the S&P 500? Zooming in to the daily chart, we see the price above both the 50-day (blue) and 200-day (red) moving averages. Both of those averages are once again rising, a bullish sign.
Will investors continue to buy if the index breaches 6000? I’d say it’s likely. Earnings season is winding down, with few major negative surprises.
Solid numbers from Nvidia NVDA and Salesforce CRM after Wednesday’s close are pushing stocks higher once again. The figure to watch is the all-time high of 6147 (black dotted line), set in February.
Once that level is cleared, there is no remaining overhead resistance, and the S&P 500 will trade at a new all-time high.
At the time of publication, Ponsi had no positions in any securities mentioned.
