The S&P 500 Is Driven by the Mega Caps, and That's Why We Should Check in on the Mid Caps
Are there opportunities in the other market cap segments?
You've reached your free article limit
You've read 0 of 1 free Pro articles.
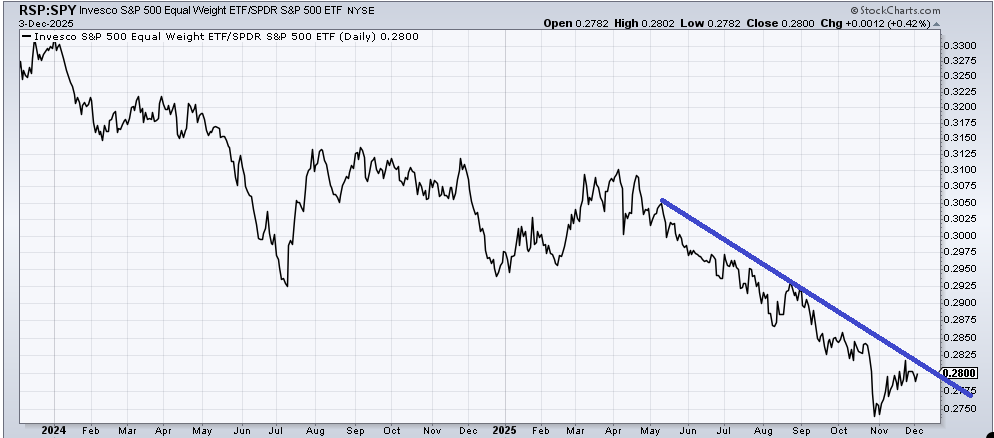
A few weeks ago, I was asked to take a look at the ratio of the equal-weight S&P (RSP) relative to the S&P. At the time, I saw nothing to write home about because it had been in a downtrend (S&P outperforming RSP) since we came off the April lows.
But with last week’s rally and Wednesday’s action in the 493 (you saw NVDA was red, right?) I thought we should check in on the chart again because I was certain we would have seen a change. I was wrong. That downtrend remains intact. This is the most persistent downtrend we’ve seen in the last two years. I would welcome a crossing of the line, but thus far it has been elusive.
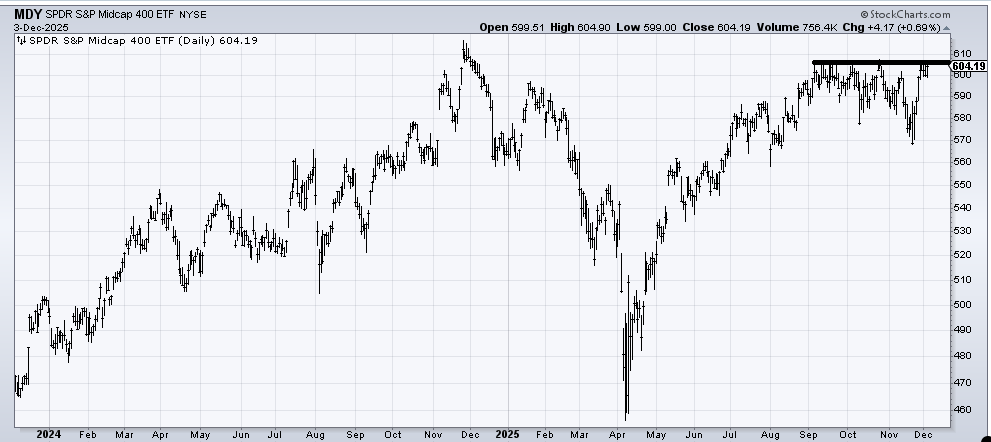
Naturally, this forced me to check in on (MDY) , an ETF to be long Mid-Caps. As a refresher, I am fascinated by this because so many folks say they don’t like small caps but are fine with mid caps. I grant you, I haven’t heard that in a while, but it doesn’t stop me from checking in on this chart.
If this breaks out before we get to the short-term overbought reading, I will be impressed. It has not been able to get over this 605-ish area – not for lack of trying — in four months. Yes, there is that spike high around 615 from this time last year to contend with, but this is where I have my focus in the coming days.
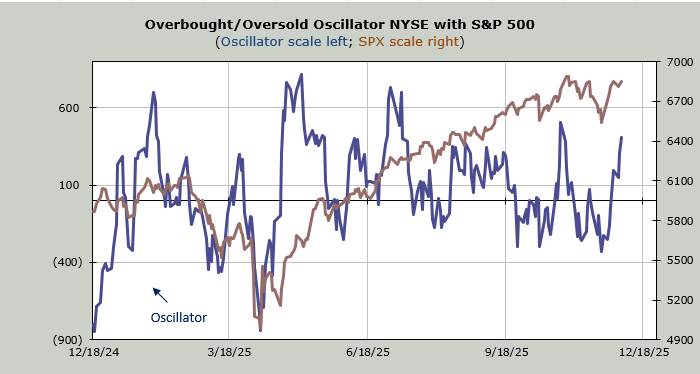
Away from that, the S&P is now flat on the week as we head into the short-term overbought condition I expect at the end of this week. Much will depend on what the breadth does in the next two days as to whether or not the Oscillator will make a higher high than it did in October. Thursday is a toss-up, but I expect on Friday we will see the Oscillator push upward one last time.
On the sentiment front, it seems Investors’ Intelligence did not release their weekly results, so I have nothing to report to you on that score; however, we do have the put/call ratio in neutral territory. But the ten-day moving average has come down a bit more as it now stands at .88. Let’s see if it can get under .85 by the end of the week. Unless the market collapses (not my plan) in the next two trading days, I think there is a chance it gets under .85 by Monday.
Then there is the Daily Sentiment Index (DSI). It is quite neutral for both the S&P and Nasdaq right now (77 and 79, respectively). However, any rally in the next two days would probably bring these two readings right into the 80s.
The DSI for the VIX, however, is now at 15, so any further move down in the VIX as we head into the end of the week would probably push this into what I call the yellow zone (start looking for volatility). In sum, if we can keep the rally going for another two days, I will be on board for a pullback next week. Or at the very least a bout of volatility.
