The Real Question We Need to Ask About the S&P
Let's look at the 'market' since July 3 and examine the supposed sideways trade; also, let's take stock of the tariff deadline, Fed, Japanese election and looming earnings deluge.
You've reached your free article limit
You've read 0 of 1 free Pro articles.
Fog (excerpt)
No more; for on the rim of the globed world
I seem to stand and stare at nothingness.
But songs of unseen birds
And tranquil roll of waves
Bring sweet assurance of continuous life
Beyond this silvery cloud. Fantastic dreams,
Of tissue subtler still
Than the wreathed fog, arise,
And cheat my brain with airy vanishings
And mystic glories of the world beyond.
A whole enchanted town
Thy baffling folds conceal—
- Emma Lazarus (1889)
Sideways?
The way that a few stocks that we track closely here in TheStreet PRO's "Market Recon" and "Stocks Under $10" columns have roared out loud of late, you might not have noticed. While correctly or fortunately exposed accounts have done quite well since very early April with no real pause or "sideways" price discovery, that's exactly what the S&P 500 has done so far in July. It may seem like a distant memory now, but the S&P 500 moved sideways from mid-May into mid-June as well.
Most folks refer to the S&P 500 as "the market" when in conversation in 2025. They say, "the market" is moving higher, lower or sideways. Kind of like the way our parents and the traders we knew early in our careers referred to the Dow Jones Industrial Average. It's the domestic equity index that matters broadly to most investors. I have seen recent talk of this "sideways" movement, and I note that there is honest concern. Let's look at these U.S. equity markets.
The S&P 500 rallied sharply on Thursday, July 3, a half-day session, closing at 6,279. This past Friday, essentially two market weeks later, the S&P 500 closed at 6,296. That's a gain of 0.3% over two weeks, hardly a disaster, especially since the week prior was good for a 3.44% run. In fact, all whining aside, sticking with the S&P 500, May was good for growth of 6.2%, June was good for growth of 5% and July, even after hitting stall speed over the past two weeks, is up 1.5% month to date. Did we think that there would simply never be a period of consolidation at any point?
If you've been around the block more than once, then you know that's just impossible. What we really have to ask ourselves is simple. Is this a turning point? Or is this the pause that refreshes? Looking across the fields of strife, we see no easy answers. The Russell 2000 (small caps), on Friday, closed down 0.4% from where that index went out on July 3rd and is up just 0.44% year to date. That pales in comparison to the S&P 500's expansion of 7.06% so far in 2025 that included both a sharp sell-off and sharp rally. Then again, the Nasdaq Composite, up just 8.21% to date in 2025, is up a much nicer looking 1.43% since the closing bell on July 3.
Last Week...
Last week, financial markets had to tackle a deluge of macroeconomic data, the kick-off of Q2 earnings reporting season as the large banks went to the tape, and more concern over Fed Chair Jerome Powell's job security. Then there were more tariff-related headlines. As Indonesia became the fourth nation to come to terms over trade with the Trump administration, the Financial Times reported on Friday that the president was pushing for a 15% to 20% minimum for duties on goods imported from the EU. Let's consider a few of these items for a minute or two, shall we?
Sunday Morning
Commerce Secretary Howard Lutnick appeared on CBS News and reiterated the president's revamped Aug. 1 deadline for the implementation of increased tariffs on goods imported from nations that have failed to reach an agreement of some kind with the administration. Lutnick said, "That's a hard deadline, so on August 1, the new tariff rates will come in."
Lutnick did add, "Nothing stops countries from talking to us after August 1, but they're going to start paying the tariffs on August 1." While Lutnick allowed that some countries in Latin America, the Caribbean or in Africa might face baseline tariffs of 10%, "The bigger economies will either open themselves up or they'll pay a fair tariff to America."
Macro Party USA
The macroeconomic focus last week was on inflation, but the week was packed with data, and the data on June inflation was mixed. The June consumer price index warmed from May. Even though the slight increase was not unexpected, this rattled some traders, investors and economists. The very next day the June producer price index was not just cool to the touch, but ice cold. Both the CPI and PPI illustrated that even where there was unwelcome inflation, it largely came from categories having nothing to do with tariffs.
Away from those two items, the news was mostly positive...
- June Housing Starts rebounded nicely from May and beat expectations.
- Weekly initial jobless claims printed well below expectations.
- The Empire State Manufacturing Index not only beat the street but printed in expansion.
- The Philly Fed not only beat the street but printed in a state of expansion.
- University of Michigan Consumer Sentiment improved from June and beat expectations.
- University of Michigan Inflation Expectations dropped precipitously.
- June Retail Sales rebounded nicely at both the headline and the core and beat expectations.
- June Industrial Production beat expectations and had its best month since February.
Somehow...
Even with literally every single macroeconomic data-point that hit the tape last week, beating expectations and showing improvement form the month prior, the Atlanta Fed managed to revise their GDPNow model for the second quarter down to growth of 2.4% from growth of 2.6% (q/q, SAAR) decreasing their inputs for both real personal consumption and real residential investment growth.
Among other regional central bank district branches running close to real-time GDP models, the New York Fed's estimate for Q2 growth now stands at 1.71%, up from 1.56%, while the Cleveland Fed's model for the second quarter still stands at growth of 1.97%. This estimate has not moved in over a month.
The St. Louis Fed also took their estimate for Q2 GDP higher from growth of 1.32% to growth of 1.64%. Clearly, though moving in different directions, these models are converging. Should that trend continue, there could be an actual (non-ridiculous) consensus within a couple of weeks' time.
Weekly Numbers
What the major to mid-major US equity indices did last week as trade tensions mounted, the ongoing battle over monetary policy heated up, Q2 earnings got going and the macro piled on.
- The S&P 500 gave up just 0.01% on Friday but rallied 0.59% for the week.
- The Nasdaq Composite gained just 0.05% on Friday but a nice-looking 1.51% for the week.
- The Nasdaq 100 lost 0.07% on Friday but gained 1.25% for the week.
- The Russell 2000 gave back 0.61% on Friday but gained 0.23% for the week.
- The S&P Smallcap 600 surrendered 0.79% on Friday and 0.85% for the week.
- The S&P Midcap 400 lost just 0.06% on Friday and just 0.03% for the week.
- The Dow Transports gave up 0.69% on Friday and a gnarly 2.14% for the week.
- The Philly Semis gave back just 0.09% on Friday but gained 0.64% for the week.
- The KBW Bank Index gained 0.54% on Friday but just 0.28% for the week.
On Friday, six of the eleven S&P sector SPDR ETFs closed out the session in the red, led lower by Energy XLE and Health Care XLV. The Utilities XLU were the day's big winner. For the week, eight of the 11 S&P sector SPDR ETFs traded higher, led by Technology XLK and the Utilities. Energy and Health Care were also the big losers for the week.
Valuation
Using data provided by FactSet, the S&P 500 went into this weekend trading at 22.2 times forward looking earnings, down from 22.3 times the week prior. This is well above the five-year average of 19.9 times and the ten-year average of 18.4 times for the index. The S&P 500 is also trading at 27.6 times trailing earnings, up from 27.5 times last week. This is also well above the five-year and ten-year averages of 25 times and 22.5 times respectively.
Earnings
Second-quarter earnings season began in earnest last week. According to FactSet, for the second quarter, with 12% of S&P 500 member companies having already reported, 83% of member companies have surprised to the upside on earnings, while 83% have also surprised positively on revenue generation.
Consensus for SPX-wide earnings growth is currently at 5.6%, which is up from 5% last week. Q2 revenue growth is now seen at growth of 4.4%, up from 4.2%, which. For the second quarter, Communication Services are projected to lead the way having grown earnings a whopping 29.9%, followed by Tech at +16.5%. Four sectors are currently projected to have suffered a year over year contraction in earnings, easily led lower by Energy (-25.4%).
For the full calendar year of 2025, Wall Street sees S&P 500 earnings growth at 9.3%, up from 9%. Expectations for full year revenue growth is now at 5.1%, up 5% the week prior. Very interestingly, for the quarter, after isolating certain companies, FactSet is reporting that earnings growth across the "Magnificent 7" is seen at 14.1% for the quarter, but just 3.4% for the "Less Than Magnificent 493."
Fed Funds Futures
The next Federal Open Market Committee policy decision looms on July 30, which is next Wednesday. Incredibly, we will hear from both Fed Chair Jerome Powell and Fed Gov. Michelle Bowman this week, despite the that the Fed has entered into its mandated media blackout period. The Fed will speak this Tuesday from a banking conference hosted by the Fed in D.C. To do so, the Fed must have agreed not to mention interest rates or monetary policy. I guess that leaves banking regulation, baseball or both as potential topics for discussion.
This morning, I see that Fed Funds Futures trading in Chicago are pricing in a 95% probability for no changes to be made to interest rate policy next Wednesday. At last glance, a 61% likelihood for a quarter-percentage point rate cut is being priced in for Sept. 17 and a 67% probability is being priced in for a second quarter point rate cut this calendar year.
The Chart: Riff 'Raff'
Readers will note that I have discounted the likelihood of a Double Top pattern of bearish reversal coming to fruition now that the S&P 500 has apexed well above what had been the first of those two peaks. I have replaced that pattern with a Raff Regression model that illustrates for investors, the current trend. All of the upward looking confirmations still stand. There has not yet been a valid signal, provided by our daily candlesticks, that would forecast a downturn for this index. That's not a guarantee. It's just not there at this time. There is some potential trouble though. Keep reading.
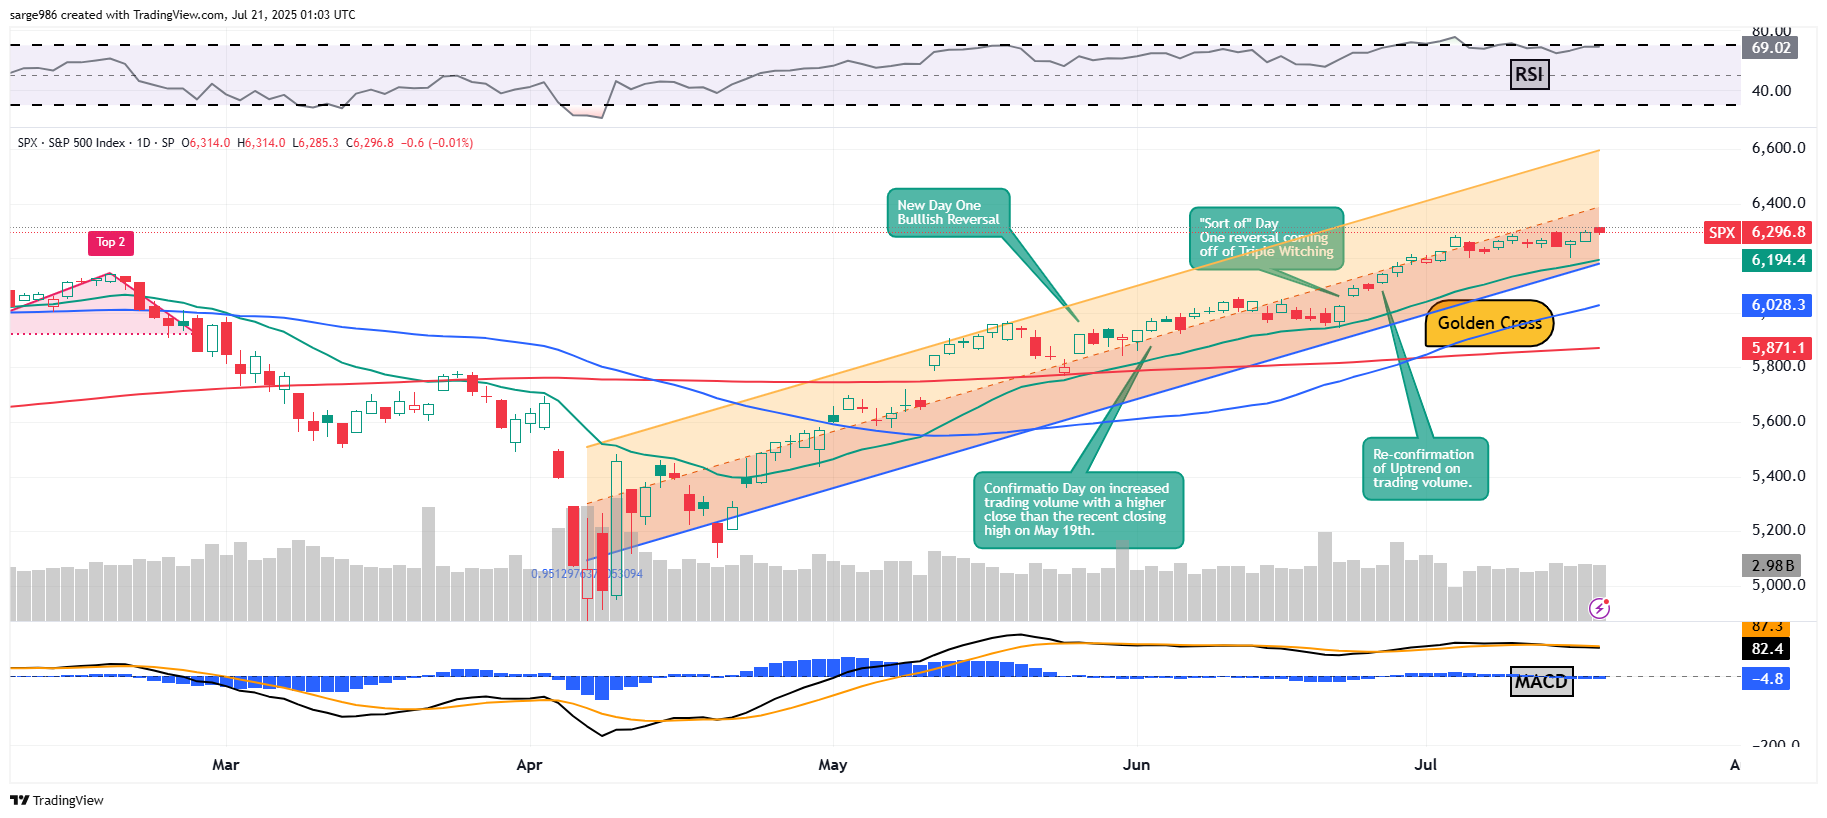
What is evident is that the 21-day exponential moving average and the lower trendline of the model are now running together. That makes for a line of potential support running above two others, the 50-day simple moving average and 200-day SMA. What that means is that for this index to fall in value by 7% or so, which would be a legit correction, it would have to cut a lot of wood. The path of least resistance, until some of these lines start to crack will remain to the upside.
Above the chart, readers will see that the reading for Relative Strength still stands just below technically overbought territory. Below the chart, there is some trouble brewing. Readers will see that within the daily Moving Average Convergence Divergence of the S&P 500, the histogram of the 9-day exponential moving average has fallen below the zero-bound, which is short-term negative. The 12-day and 26-day EMAs are also well above the zero-bound, but with the 26-day line above the 12-day line. That's a new development, and that is not a very bullish posture going into the week. I told readers last week to keep their eyes on that black line. The bulls will not do well if those two lines do not re-flip.
Japan Election Shakeup
Political uncertainty has spread across Japan as the ruling coalition lost the upper house of that nation's legislature over the weekend. The Liberal Democrat party, which has ruled Japan for most of its post-World War II history, and its coalition partners fell short of what it needed to ensure a majority. That puts Prime Minister Shigeru Ishiba in a tough spot without a supporting coalition in either chamber of Japan's legislature. Yoshihiko Noda, leader of the opposition Constitutional Democratic Party, has said that he is considering the submission of a non-confidence vote against the current administration. Ishiba has said, at least for now, that he plans to stay on in his role.
The U.S. dollar is trading lower against the Yen this morning, which has forced values for gold, silver and bitcoin higher in dollar terms. Yields are also trading lower across the US Treasury curve from the long end down to the One-Year Note. Yields are lower across Europe as well.
What's Ahead?
Get ready for a heavier week of earnings releases. The macro calendar will lighten up a bit and the docket of Fed speakers should slow down to almost nothing. Then, tariff related
- The domestic macroeconomic calendar slows down a bit from last week's intense pace. This Wednesday, the National Association of Realtors will release June Existing Home Sales, which is the largest slice of the monthly housing pie. June New Home Sales will print on Thursday alongside July's S&P Global Flash PMIs for the U.S. manufacturing and service sectors. On Friday, the Census Bureau will publish Durable Goods Orders for June. The most important print within that print for traders and economists will be the line for Core Capital Goods, which is a proxy for business investment.
- As mentioned above, the Federal Reserve has entered into the media blackout period ahead of the July 30th policy decision. As mentioned above, both oddly and interestingly, Fed Char Jerome Powell and Fed Gov. Michelle Bowman are set to speak on Tuesday from a banking conference in Washington to be hosted by the central bank.
- The earnings calendar will be very active this week. The action kicks off this morning when Domino's Pizza DPZ and Verizon VZ post their numbers. Tuesday morning, we'll hear from Coca Cola KO Danaher DHR, General Motors GM, Lockheed Martin LMT, Northrop Grumman NOC, and RTX RTX, which is the old Raytheon Technologies. On Wednesday morning, AT&T T, and General Dynamics GD will report, followed by Alphabet GOOGL IBM IBM, ServiceNow NOW, and Tesla TSLA that afternoon. Come Thursday, L3 Harris LHX, Union Pacific UNP, and Valero VLO will release their data ahead of the open, while Intel INTC posts its results after the close. Finally, on Friday morning, we'll hear from HCA Healthcare HCA and Charter Communications CHTR.
Economics
(All Times Eastern)
10:00 - CB Leading Indicators (Jun): Expecting -0.1% m/m, Last -0.1% m/m.
The Fed (All Times Eastern)
Fed Blackout Period.
Today's Earnings Highlights
(Consensus EPS Expectations)
Before the Open: CLF (-.68), DPZ (3.96), ROP (4.83), VZ (1.19)
After the Close: NXPI (2.66)
At the time of publication, Guilfoyle was long NOC, RTX, LHX equity.
