The Question Is, Can All of These Flat Lines Hold?
Major indexes have meandered down to support. What's next for stocks?
You've reached your free article limit
You've read 0 of 1 free Pro articles.
 Wall Street Traders on the NYSE Lead (RD-081825)
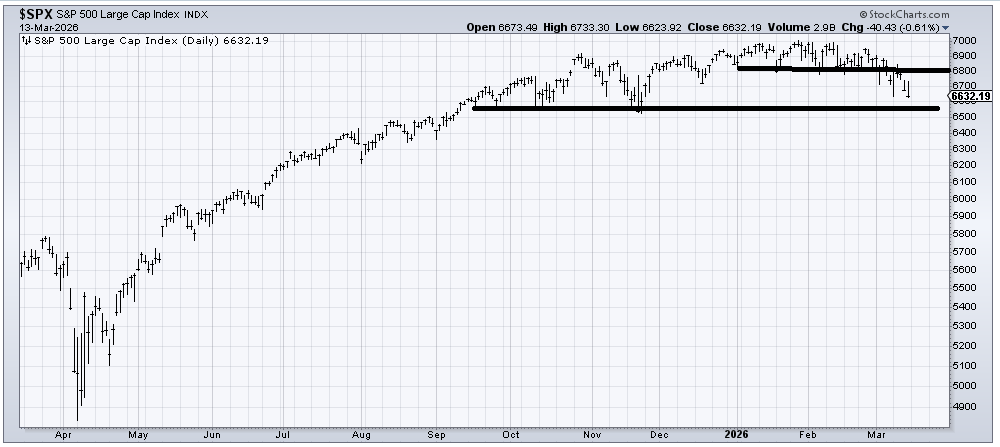
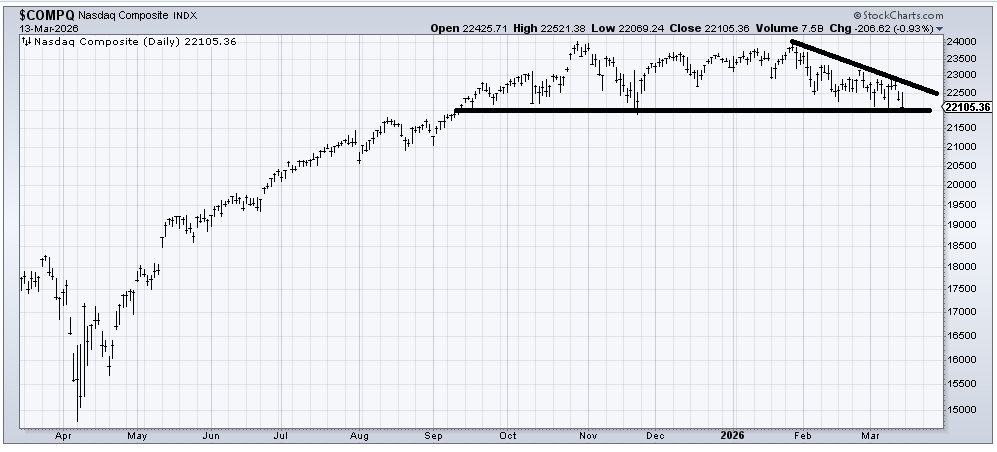
There are flat lines everywhere. Certainly, on the major indexes.
The S&P has a flat line at 6500
Nasdaq has one at 22,000
IWM has one at 245.
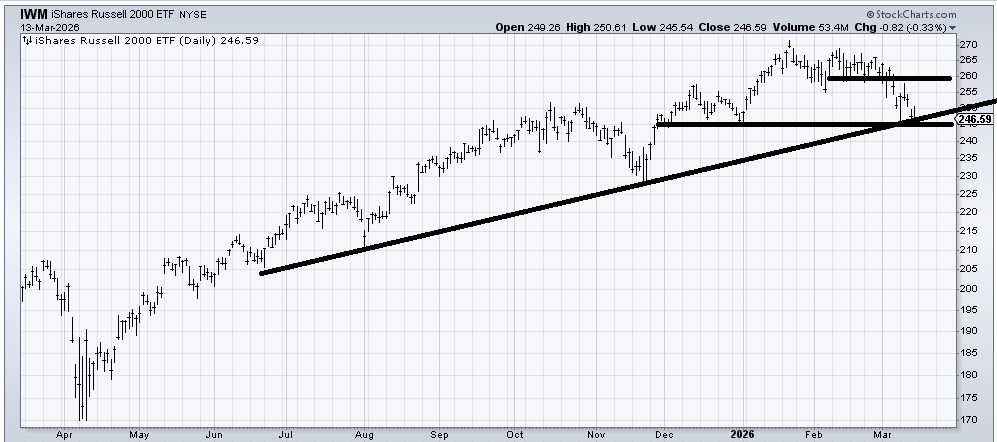
In the first two cases, the lines (lows) date back to last fall, thus breaking them leaves the market with six-month lows. The Russell 2000 ( (IWM) ) only dates back to December, which is pretty much when that outperformance began. And yes, breaking 245 would complete a funky head and shoulders top, but more importantly, it would also break an uptrend line dating back to last summer. I put more emphasis on a break when we break two things at once.
I find it interesting that all of these charts have meandered (because it certainly hasn’t been fast and furious) their way down to these well-watched but important lines as we head into the third week of March, when we get all those options expiring (daily, weekly, monthly, quarterly). And we’re short-term oversold, likely exacerbating any moves we get.
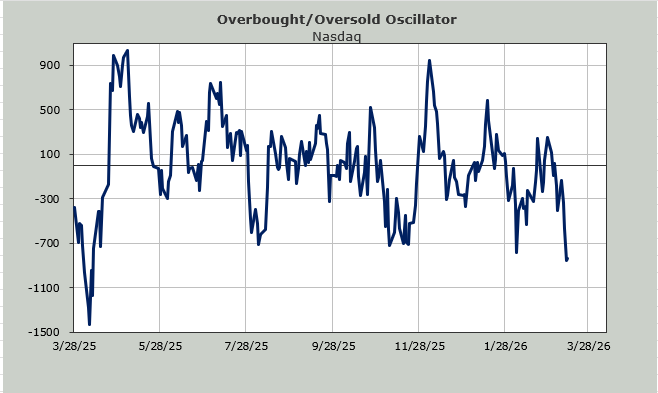
My own Overbought/Oversold Oscillator, which is based on the ten-day moving average of net breadth, gets oversold this coming week. The last seven trading days have seen breadth red. Eight of the last ten have been red too. You can see on the table below that the long string of red numbers to be dropped begins on Thursday of this week, but let’s just say there is a lot of red, which makes it oversold this coming week.
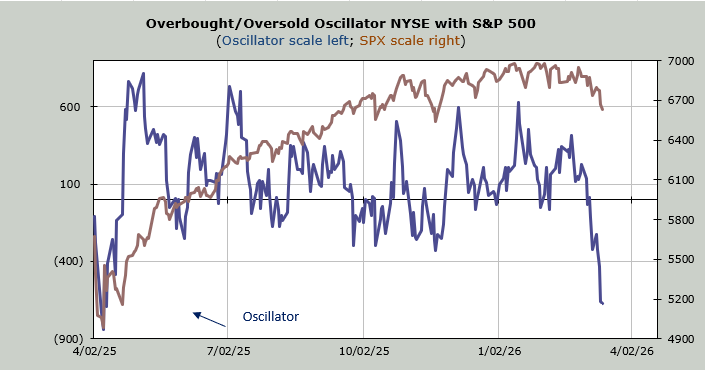
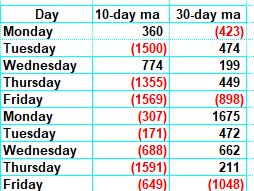
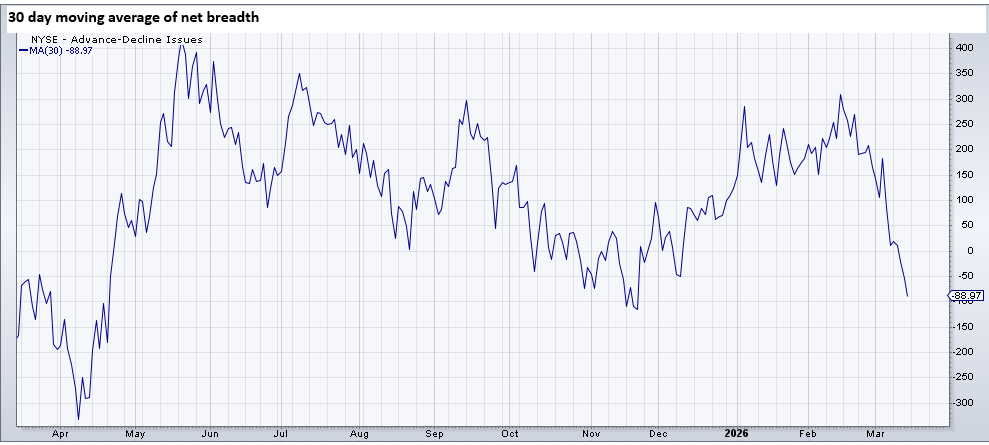
You might have noticed that the 30-day moving average breadth numbers to be dropped (on the table above) are not very red at all. So the chart looks oversold (getting close to the November low), but the math behind it says it is not.
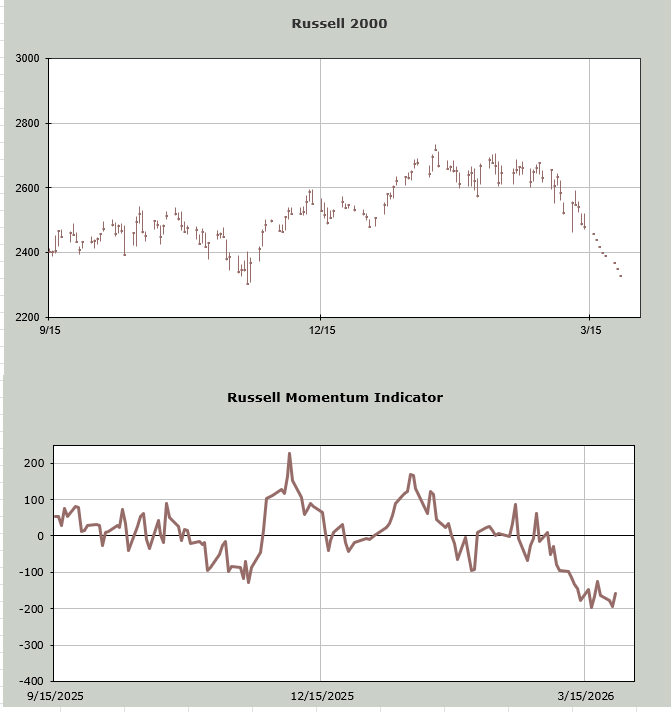
I can even cite the Russell Momentum Indicator as showing a short-term oversold condition coming this week. No matter how far down I walk the Russell this coming week, the indicator stops going down. This is based on price, not breadth.
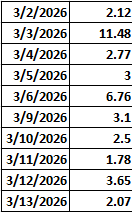
We have discussed the options ratios quite a bit in the last month, so I just want to reiterate that they show a lot of bearishness but no extremes yet. However, the put/call ratio for the Russell 2000 has shown a high level of put buying since the calendar turned to March. I don’t have a chart for you, but take a look at the readings: in the last ten trading days, there is only one day where the ratio is under 2.0.
On a more intermediate term basis, the Volume Indicator is at 48% (needs to be lower to be intermediate term oversold). The various sentiment surveys show the bullishness has come off the boil, but they do not show any sort of fear or extreme bearishness. I expect that to change in the weeks ahead, as I have already seen some strategists changing their views on the market.
The DSI for the S&P is at 33, and Nasdaq is at 40, so there is no sign that there is an extreme there yet either.
Based on the short-term oversoldness (and all those puts in the Russell 2000), I would expect a short-term rally to begin this week. Based on the intermediate-term indicators, I believe it would be just a short-term rally.
Related: Bearish Bets: 3 Popular Stocks Break Down on Big Volume
