The Only Way to Know if We're There Yet is to Look at the Indicators
Let's review signals by several of the key market indicators.
You've reached your free article limit
You've read 0 of 1 free Pro articles.
 Traders
Are we there yet?
There is not a parent in this world that has not heard a version of that question. There is also likely not a trader in the history of markets that has not asked a version of that question. And traders, like children, are not known for their patience.
For me, ‘there’ is a variety of indicators. For example, the Daily Sentiment Index (DSI) for the S&P is 15 (it was 22 a week ago), and Nasdaq is 14 (it was 25 a week ago). ‘There’ is a single-digit reading in at least one of these. I would even take these current readings if I had other indicators that were already ‘there’.
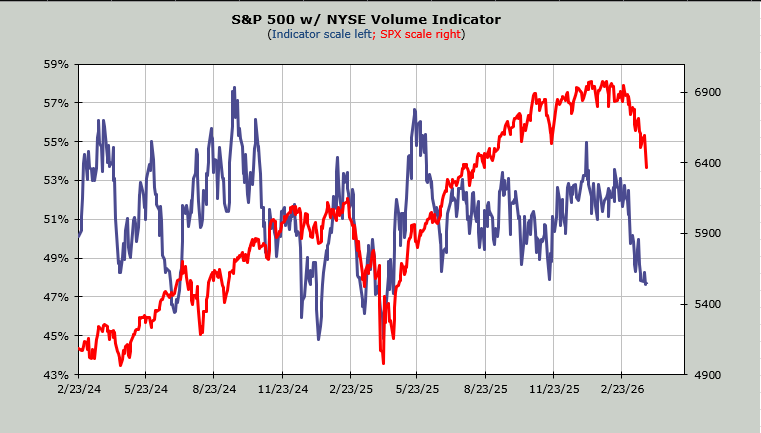
The Volume Indicator, which was at 48% a week ago, remains at 48%. It didn’t budge all week. So let me take this time to remind you that while the S&P fell two percent on the week, the Russell 2000 was up on the week. It’s hard to move the breadth indicators when breadth doesn’t move much. A reading of at least 47% gets us oversold, preferably lower. Am I being picky? Maybe.
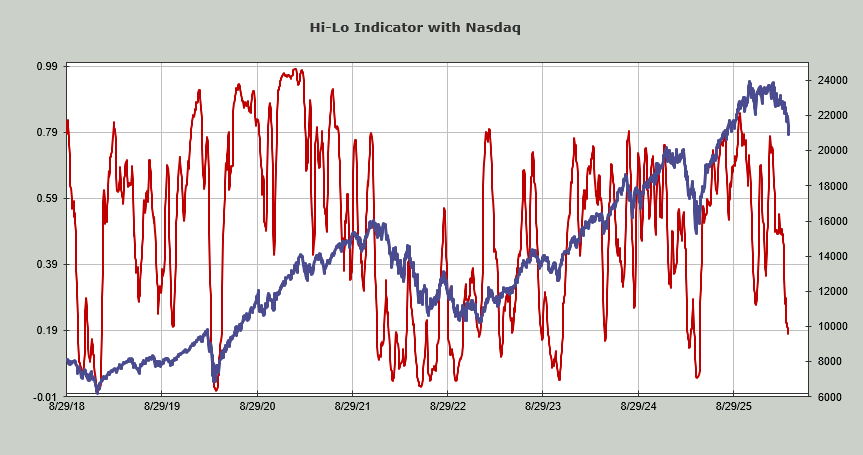
The NYSE Hi-Lo is still at .35, which is where it was a week ago. Again, it’s hard to move a breadth indicator when breadth doesn’t move. Nasdaq’s, however, is at .18 so it has stepped a toe into oversold territory. It is currently the only intermediate-term indicator that has done so. It’s ‘there’.
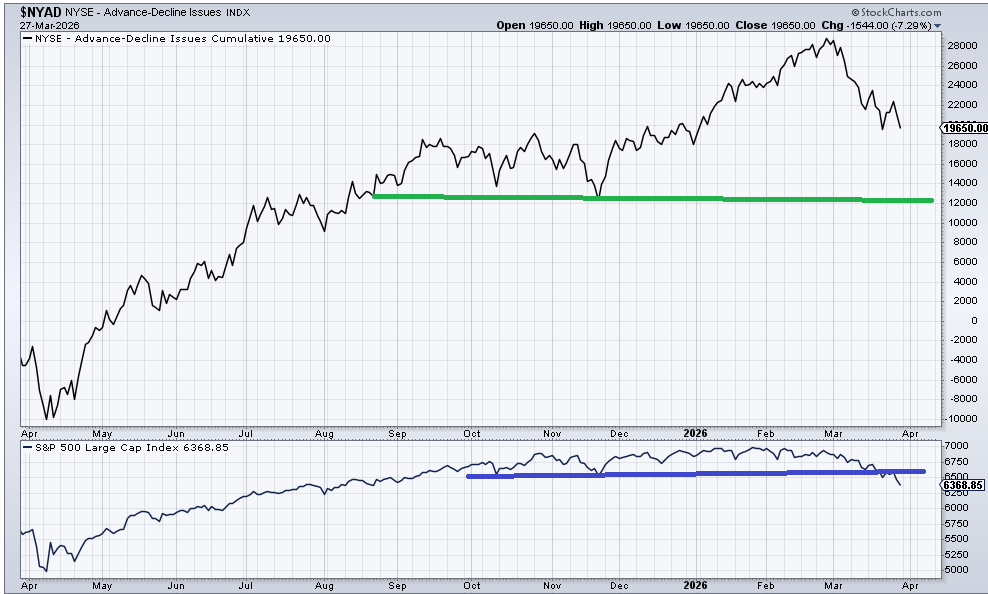
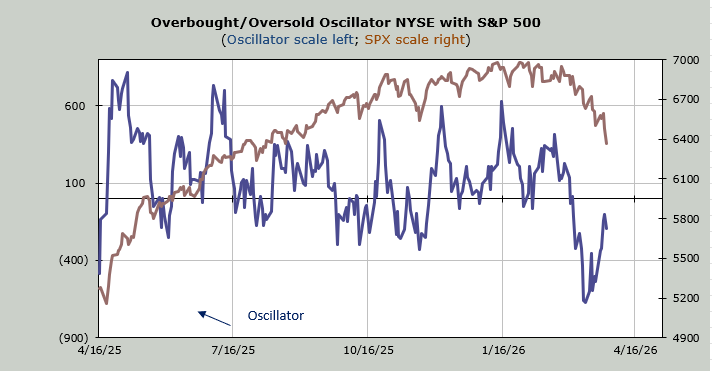
I have referenced breadth a few times above, so let me show you what I mean on a chart. The upper chart is the advance/decline line. The lower chart is the S&P. You can see the S&P broke 6500 (blue line), but the equivalent of breadth doing the same would be breaking that green line. Thus, we currently have a positive divergence. It’s right ‘there’ on the chart!
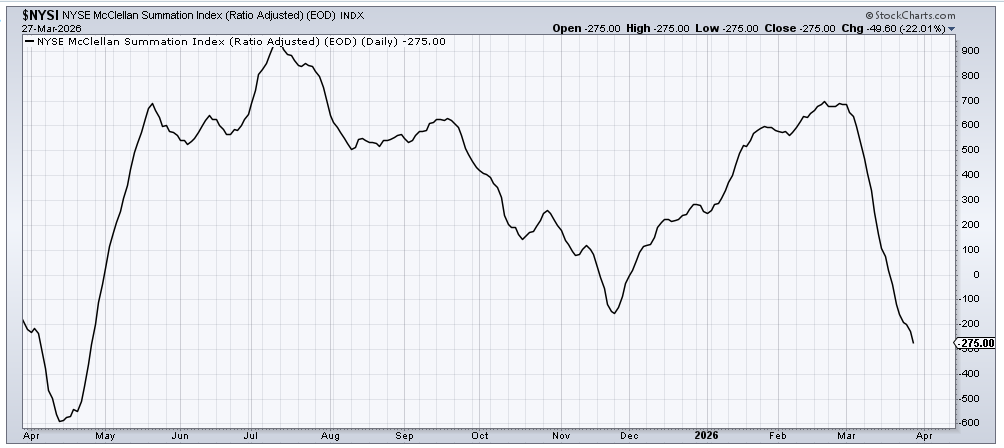
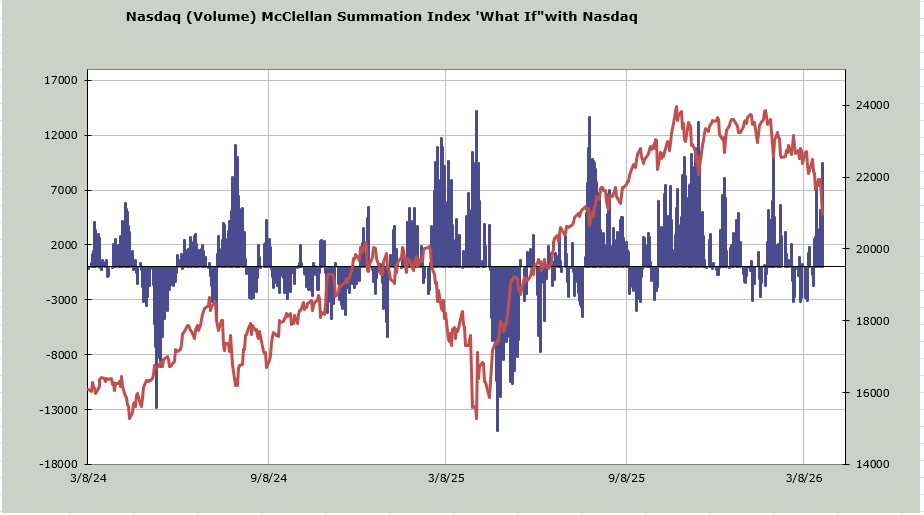
The McClellan Summation Index, though, is still heading lower. It currently needs a net differential of +2300 advancers minus decliners on the NYSE to halt the decline.
Over on Nasdaq, its Summation Index is also heading down. I use net volume (up minus down) for Nasdaq, and it currently needs +9.5 billion shares to halt its decline. You can see that readings in the +12 billion share range tend to be an extreme oversold reading. Almost ‘there’.
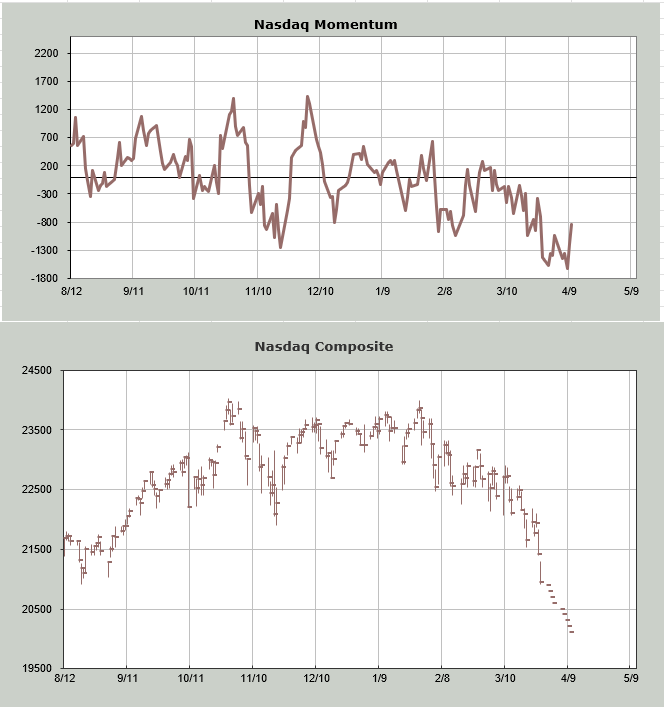
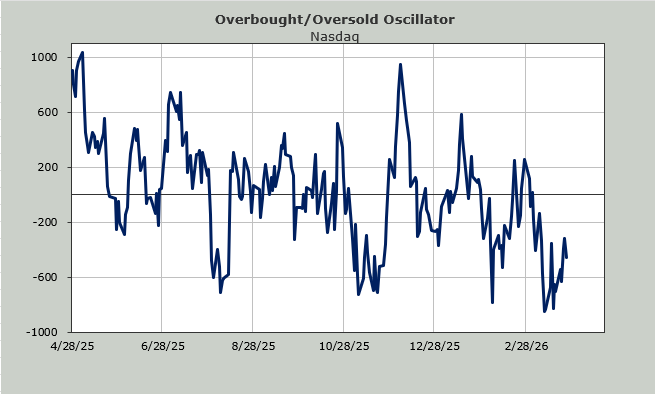
Continuing with Nasdaq, it’s finally heading to an oversold condition. About ten days or so ago I showed you how the Russell 2000 Momentum Indicator was heading into an oversold condition (reminder: the Russell was up last week), but Nasdaq was not. Now I can show you, using the Momentum Indicator, that Nasdaq will get oversold sometime in the next ten days.
Remember, this is not meant to give us the exact day or date but the general time frame. When I walk Nasdaq down 1000 points over the next two weeks, the indicator (based on price, not breadth) stops going down midweek this week to midweek next week.
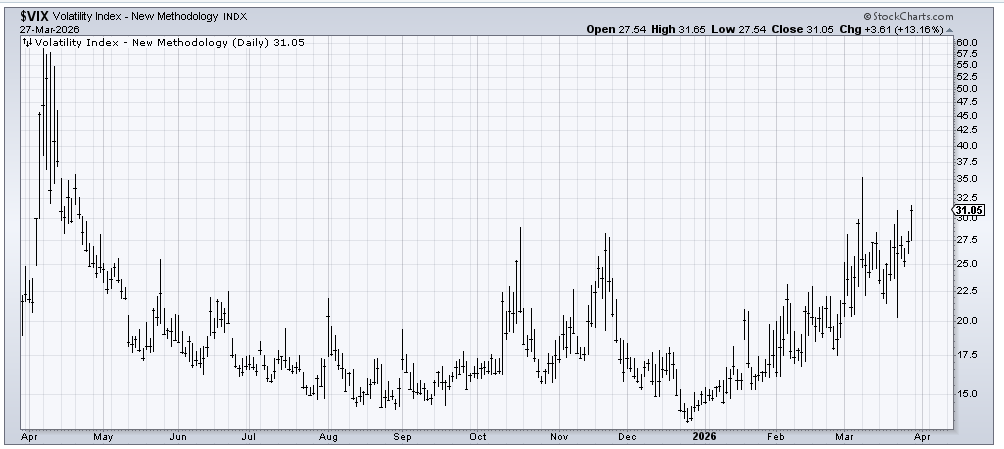
Finally, there is the VIX, which, with that big base like bowl shape, could use a good move up to get that jumpy look to it.
None of this means the market is in great shape. All it means is that we are nearing some extremes that would be worth playing for. I’d love to see the market get ‘there’.
Related: Magnificent Seven Approach Bear Market as Doom and Gloom Intensifies
