The One Jobs Number That Really Matters
The Bureau of Labor Statistics commissioner gets canned. Here's my take on the firing, the BLS' recent history and those wild revisions. Also, let's chart the S&P and get set for the week ahead.
You've reached your free article limit
You've read 0 of 1 free Pro articles.
U.S. labor market growth has apparently come to a screeching halt. We all knew that the numbers that we had been seeing for some time just did not match up very closely with what we had been hearing anecdotally from our young adults. Our young people would tell us that they could not find work, or had to settle for something they didn't really need an expensive education for. Yet, the numbers kept rolling on. Job creation is quite healthy, we were told. Labor markets are in good shape, we were told.
Yet, the music stopped. All in need of a chair scrambled about. There were too many players. Not enough chairs. Only problem? This is no game. The labor market in the U.S. apparently died not a slow death, but a rather sudden death. Back in May. Just nobody told us. Nobody told Fed Chair Jerome Powell, either. This allowed him to bumble his way into what is now quite obviously policy error last Wednesday. Don't look to me for any sympathy for the now former Bureau of Labor Statistics Commissioner Erika McEntarfer who lost her job on Friday. I have been calling for heads to roll at that agency at least since McEntarfer took over back in January 2024.
It was during 2024 that economists started searching for reasons behind the suddenly wildly inaccurate data released by the BLS and the unheard of size of the revisions often one, two and even more months later. The size of the downward revisions after the fact in 2024, were just astonishing, but nothing prepared anyone for what the BLS released on Friday. The Birth/Death model was blamed. Sample size was blamed. Methodology was blamed. Everything involved seemed to offer one reason or another for what had become an ineffective government agency incapable of serving in its stated function, but no one looked at the leadership or lack thereof.
Throughout her tenure, McEntarfer has come under fire not just for the inaccuracy in the reporting of data she was responsible for, but also for her agency's mismanaged data release practices. It got to the point where for many economists, the monthly ADP Employment Report, which had been remodeled to improve on accuracy after having problems of its own, became the report that many were forced to rely upon.
The real problem is that the central bank still relied upon the BLS as did U.S. financial markets. Maybe McEntarfer would or would not have been fired if her agency had erred in the other direction. That I can not say. We'll let the armchair political scientists duke it out over that one. That said, I think it has become most difficult to argue that anyone currently serving in a senior position at the BLS should not be let go, or at least should be relieved of their current responsibilities.
The Numbers
No way to sugarcoat what happened on Friday. The BLS posted the results of its two labor market surveys for the month of July. Off of the Establishment Survey, the BLS reported that 73,000 seasonally adjusted jobs (Non-Farm Payrolls, long considered the headline number of this monthly report) had been created across the U.S. This was well below the 105,000 or so that economists were looking for, but that was far from the worst of it.
Revisions, which have long been an issue for the BLS under McEntarfer, were much larger for the months of May and June than anyone could have ever anticipated. May job creation was revised down to 19,000 from 144,000, while June was revised down to 14,000 from 147,000. In short, the downward revisions of 258,000 jobs that had never been created, turned July's headline print of 73,000 new jobs into a net -185,000 jobs.
This was two days after the FOMC decided not to reduce short-term interest rates, while actually publishing the words "Labor market conditions remain solid." as at least a partial explanation for their inaction in the official statement. Incredible. Now, unless the Fed takes emergency action, which is something none of us wants to see, the Fed, stripped of at least half of its aggregate reasoning for taking no action, must wait for Sept. 17 to move on rates while staying on their regular schedule. I believe that McEntarfer did not just screw up the numbers. She very well may have screwed up, I believe, even if by accident, the U.S. economy, as the consistently sizable inaccuracies in her agency's published data have misled policy makers at crucial times, forcing an unwelcome awkwardness into the timing of any adjustments that will now be made later than they should have been.
July Was Ugly
Not only did the net non-farm payrolls number work out to -185,000 positions, but the Household Survey showed 260,000 fewer employed persons in July than in June and 221,000 more unemployed persons. The unemployment rate moved up to 4.2% from 4.1% as the underemployment rate moved up to 7.9% from 7.7%. Why? Because in that same report, 219,000 more persons were working part-time for economic reasons and 214,000 persons were working part-time for non-economic reasons.
Wait, Sarge, you mean to tell me that the household data shows a total loss of 260,000 jobs in July but a simultaneous increase of 433,000 part-time workers? Kids, that's exactly what I am trying to tell you. If these numbers are to be considered accurate, which is understandably a big ask, the U.S. economy lost 693,000 full-time jobs in July.
It gets worse. The unemployment rate moved higher in July for men, for women, for teenagers, for white people, for Black or African American people, for Asian people, and for Hispanic or Latino people. I have more. The unemployment rate went higher for high school grads, but lower for folks who never finished high school. The unemployment rate also went higher for four-year college grads and beyond, but lower for folks who started college but never finished. What does that say about the quality of current demand for labor?
Do the Numbers Stink?
Of course they do....
Can We Trust the Numbers?
Of course we can not......
Last Week...
U.S. markets suffered their worst week last week since late May. The macro was sort of tough to look at even before Friday. On Wednesday, first-quarter gross domestic product hit the tape at a deceiving growth rate of 3% (q/q, SAAR) That three handle, was largely gifted by falling imports to this country. Final sales to private domestic purchasers, which gives us a more accurate reading on organic economic activity, printed at growth of 1.2%. Nowhere near recessionary territory, but also nothing to write home about.
Later that afternoon, the Federal Open Market Committee took a pass on making policy changes though many professionals, including myself, felt that a short-term interest rate cut has probably been appropriate for months now. Note that Fed Governors Christopher Waller and Michelle Bowman both dissented, while Fed Gov. Adriana Kugler did not vote and then resigned from her position on the Fed's Board of Governors. Someone in tune with the president's policy goals will likely be nominated to that post in short order. Will that influence Powell at all, whose term as Chair runs its course in May? He may not have needed convincing if he had been supplied with accurate data. I believe he is stubborn, and he is late, but this is obviously not all on him.
On Thursday, after Q1 numbers covering consumer-level inflation had appeared quite cool on Wednesday, the monthly PCE data for July hit the tape a bit warm to the touch. This item, representing the other half of the Fed's dual mandate, creates a bit of a problem for the doves as in order to protect domestic labor markets, an unwelcome renewed acceleration of inflation will have to be put at risk.
That said, one would think that the now suddenly three-month period of weakness in labor markets would override mild inflationary concerns for most economists. This is why the bond market was so strong on Friday. Just on Friday alone, The U.S. Ten Year Note went out paying just 4.22%, down 16-basis points. The shorter end of the yield curve really moved. The U.S. Two Year Note paid 3.69% by day's end, down a whopping 27-basis points. Even Three Month T-Bills saw their yields drop by 7 basis points for the day.
Earnings releases were hot last week as well. Four names from the "Magnificent Seven" reported. While Meta Platforms META and Microsoft MSFT largely hit the ball out of the park, Apple AAPL had a somewhat better quarter than expected, and Amazon AMZN disappointed investors with both their cloud growth and forward looking guidance.
Weekly Numbers
What the major to mid-major US equity indices did last week as both disappointing macroeconomic data and an immobile Fed forced investors and traders to take profits...
- The S&P 500 gave up 1.6% on Friday and 2.36% for the week.
- The Nasdaq Composite gave back 2.24% on Friday and 2.17% for the week.
- The Nasdaq 100 lost 1.96% on Friday and 2.19% for the week.
- The Russell 2000 surrendered 2.03% on Friday and an ugly 4.17% for the week.
- The S&P Smallcap 600 took a hit of 1.64% on Friday and 3.95% for the week.
- The S&P Midcap 400 gave up 1.48% on Friday and 3.53% for the week.
- The Dow Transports lost 2.21% on Friday and was pummeled for 7.7% for the week.
- The Philly Semis gave back 1.43% on Friday and 2.09% for the week.
- The KBW Bank Index surrendered 2.33% on Friday and 4.38% for the week.
On Friday, seven of the eleven S&P sector SPDR ETFs closed out the session in the red, led lower by the Discretionaries XLY and Technology XLK. Interestingly, the four defensive sectors were indeed the day's four winners, led by Health Care XLV. This kind of result would be behavior indicative of what could be a fading belief by investors in economic growth.
For the week, ten of the eleven S&P sector SPDR ETFs traded lower, led in that direction by the Materials XLB and the same Health Care sector that had a nice Friday. The lone winner for the week, however, was another defensive sector, the Utilities XLU. Among these funds, all ten losers gave up at least 1.39% for the five day period.
Valuation
Using data provided by FactSet, the S&P 500 went into this weekend trading at 22.2 times forward looking earnings, down from 22.4 times the week prior. This is still well above the five-year average of 19.9 times and the ten-year average of 18.5 times for the index. The S&P 500 is also trading at 27.8 times trailing earnings, down from 27.9 times last week. This is also well above the five-year and ten-year averages of 25 times and 22.5-times respectively.
Q2 Earnings
Second quarter earnings season is now past its midpoint. According to FactSet, for the second quarter, with 66% of S&P 500 member companies having already reported, 82% of member companies have beaten earnings expectations, while 79% have also surprised the street on revenue generation.
Consensus for Q2 SPX-wide year over year earnings growth is currently at 10.3%, which is up sharply from 6.4% last week. Q2 revenue growth is now seen at growth of 6%, also up nicely from 5%. For the second quarter, Communication Services are projected to lead the way, having grown earnings a whopping 40.7%, followed by Tech at +21.1%. Justb three sectors are still projected to have suffered a year over year contraction in earnings, easily led lower by Energy (-20.3%). The Utilities have moved from contraction to growth over the past week.
For the full calendar year of 2025, Wall Street sees S&P 500 earnings growth at 9.9%, up from 9.6%. Expectations for full year revenue growth are now at 5.6%, up from 5.3% the week prior. Interestingly, as covered by FactSet, this weekend, earnings estimates for the third quarter are still on the rise despite the fact that one might think that the "current" quarter would have been impacted by margin-impacted tariffs.
The GDP Game
Last week, the Atlanta Fed revised their GDPNow model for the third quarter down to growth of 2.1% (q/q, SAAR) from its initial estimate of 2.3%. Among other regional central bank district branches running close to real-time GDP models, the New York Fed's estimate for Q3 growth now stands at 2.12%, down from 2.37%, while the Cleveland Fed's model for the third quarter stands at growth of 1.93%. The St. Louis Fed has not yet released an initial GDP estimate for the third quarter.
Fed Funds Futures
The next scheduled FOMC policy decision, unfortunately will not take place until Sept. 17. Fed Funds Futures markets trading in Chicago are now pricing in a 90% probability for a quarter-percentage point rate cut on that day, and a 61% likelihood for an additional quarter point cut on Oct. 29. In fact, these markets are no pricing in a 53% probability for a total of three-quarters a percentage point worth of rate cuts by year's end. Hence the collapse of the slope of the yield curve on Friday. The free market is acknowledging Fed Chair Jerome Powell's policy error last week and trying to force his hand.
The Chart
As we had warned here in this column, Friday turned into the second day of a "Day One" bearish reversal of trend. Remember, for a bearish change to be confirmed, we need to see a pause in the selling, which futures markets appear to be setting up this morning, followed by a resumption of the selling pressure on elevated trading volume. Without those two ingredients, we will have more difficulty in confirming a negative turn in the marketplace.
Readers will see that on Friday, the S&P 500 broke below the lower trendline of our Raff Regression model and more important than that broke below the 21-day exponential moving average for the index. This forced swing traders to reduce equity market exposure going into the weekend. Hence, the market overshoot on Friday and the sheepish rebound at zero-dark thirty on Monday morning.
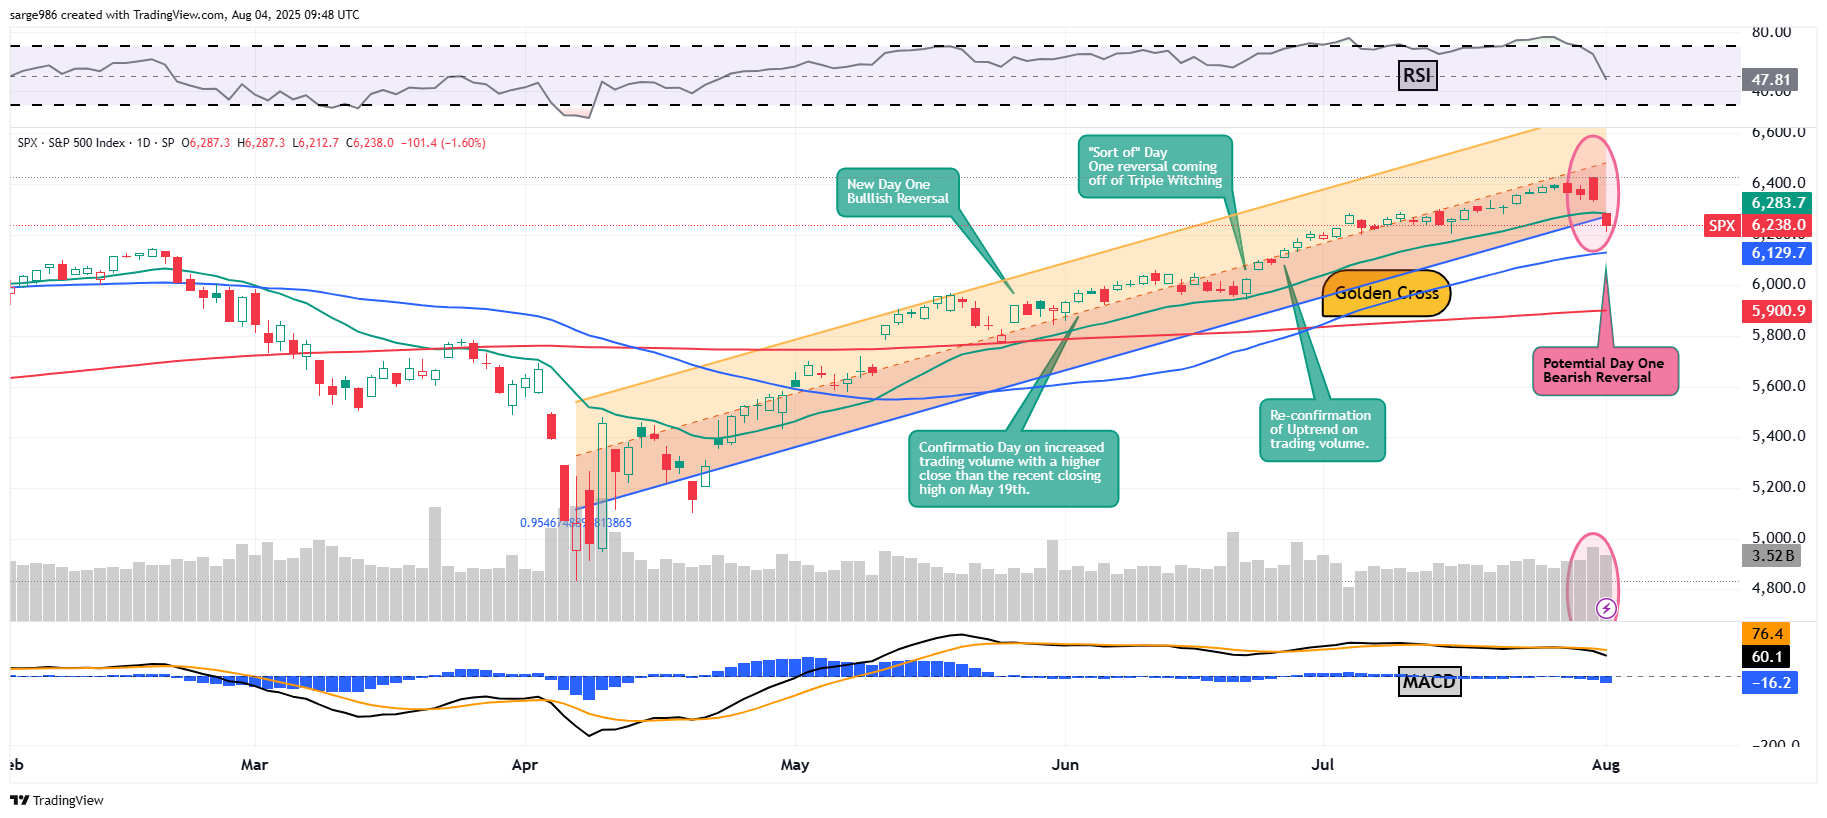
Note that Relative Strength has dropped from being in technically overbought territory to merely "neutral" territory in just a couple of days. Additionally, the daily Moving Average Convergence Divergence has taken on a more bearish posture with the histogram of the 9-day Exponential Moving Average now well below the "zero-bound" and with the 12-day EMA dropping below the 26-day EMA. This indicator is now ending both short-term and medium-term bearish signals.
What's Ahead?
We've got less wood to cut this week. Less macroeconomic data and an expected smaller Fed footprint. Earnings season carries on and will be very active. That said, there are headline level names reporting, but fewer of them, and there will be no "Mag 7" names among the lot. The deadline to either come to a deal with China or extend the truce is still Aug. 12, which is next week, but obviously, there could be a rush of headlines created ahead of the event.
This brings us to the rest of the world, which will be adjusting to the president's implementation of tariffs of his choosing on nations this past Friday that had not made the effort to reach out and negotiate on trade. Some of those nations could still come to some kind of deal which could be seen as a positive. Canada and Mexico are still out there.
The domestic macroeconomic calendar cools off a bit this week. Tuesday morning will bring us the ISM's Service Sector PMI for July. The Treasury Department will auction off $42 billion worth of new Ten-Year Notes on Wednesday afternoon and $25 billion worth of Long Bonds (30-Year paper) on Thursday afternoon. Second quarter non-farm productivity and unit labor costs will be released Thursday as well.
The Federal Reserve appears to be trying to hide this week, which is unusual the week after a policy decision. Obviously, there is no consensus among the group on what kind of narrative to try to sell to the public. Right now, I only have Fed Gov. Lisa Cook and Boston Fed Pres. Susan Collins on Wednesday and then Atlanta Fed Pres Raphael Bostic and St. Louis Fed Pres. Alberto Musalem on Thursday. As a Governor, Cook's seat holds permanent voting rights. Boston and St. Louis both hold 2025 voting rights. Atlanta will not again vote until 2027.
The earnings calendar will again be extremely active this week. There are, as there were last week, almost too many interesting companies reporting this week to list here. That said, we'll hit you with some of the more interesting (at least to me) names that will be publishing financial results. This afternoon, we'll hear from Sarge-name Palantir Technologies PLTR, followed by Caterpillar CAT, Pfizer PFE, and Sarge-name Advanced Micro Devices AMD on Tuesday. Wednesday morning, we'll hear from McDonald's MCD, and Disney DIS, followed by Lyft LYFT and Uber UBER on Wednesday evening.
Ahead of Thursday morning's opening bell, Datadog DDOG, Eli Lilly LLY, and Ralph Lauren RL will report, followed by Dropbox DBX and Kratos Defense KTOS after the closing bell. Friday should be quiet for a change. The "biggest": name I see reporting on Friday is Essent Group ESNT.
Economics
(All Times Eastern)
10:00 - Factory Orders (Jun): Expecting -5.1% m/m, Last 8.2% m/m.
10:00 - ex-Transportation (Jun): Expecting 0.1% m/m, Last 0.2% m/m.
The Fed
(All Times Eastern)
No public appearances scheduled.
Today's Earnings Highlights
(Consensus EPS Expectations)
Before the Open: BNTX (-1.41), ON (.53), TSN (.78), W (.33)
After the Close: PLTR (.14), WMB (.49)
At the time of publication, Guilfoyle was long ON, PLTR, AMD, KTOS equity.
