The Most Important Morning Note You'll Read Today
How a good jobs report made for an ugly market, charting the S&P and Nasdaq, and why I'm adding to these three names.
You've reached your free article limit
You've read 0 of 1 free Pro articles.
The first five days of January hung in there pretty well after Santa's holiday "no show." As traders went home this past Wednesday, the first five trading days of the year had ended with most mid-major to major equity indexes up for the fledgling year. Huzzah! The traders cheered: 2025 might turn out better than the jolly fellow had. Birds sang. Children danced. The next day, Thursday was a National Day of Mourning in honor of the late Jimmy Carter, 39th president of the United States. After that it got ugly. What happened? Jobs happened.
Well, to be fair, it also needs to be said that CES 2025 wasn't going to make huge news. Sure Nvidia NVDA CEO Jensen Huang knocked the stuffing out of the quantum computing stocks, but could not save his own shares from falling as the Biden Administration threatened to further tighten export restrictions for U.S. semiconductor designers. There had to be less buzz around this year's annual Las Vegas tech-focused event than for any recent year that I can recall. Can't wait for the clown show in Davos (sarcasm).
Markets appear to be back in "good is bad and bad is good" mode. There wasn't a lot of macro released last week until Friday. There really weren't many Fed speakers last week, with the exception of Thursday with equity markets closed. Fed Gov. Michelle Bowman, as she has been of late, was front and center as the leader of the policy hawks and she flat out questioned whether or not current policy was restrictive enough. The rest of the crew sounded more or less pragmatic, at best, or uncertain at worst. Really only Philadelphia's Patrick Harker came off as decisively dovish. Philadelphia, for that matter, does not vote this year, and Harker will retire after the June meeting... So really, who cares?
On Friday morning, the Bureau of Labor Statistics put a December Employment Report to the tape that even I could not find fault with, and finding faults within the data is something I kind of like doing. Once the employment numbers hit publication, up went the U.S. dollar, down went equities, down went debt securities (sending yields higher) and down went Frazier.
December Jobs
The Bureau of Labor Statistics release was clearly positive and what really surprised, in my opinion, was how overwhelmingly positive it truly was. Non-farm payrolls for December showed job creation of 256,000 seasonally adjusted positions, easily beating the 160,000 that had been the consensus view. Revisions to both November and October were minimal. Wage growth was the one less than robust part of the December report. The average workweek for full-time employees held firm at 34.3 hours per week, which does not really reflect strength in demand for full-time labor, and hourly wages increased by 0.3% month over month, down from 0.4% for November. Wages also increased by 3.9% year over year, down from a 4% November print.
After that it was all gummy bears and licorice sticks. The Household Survey showed 478,000 more employed persons than it had in November and 235,000 less unemployed people than it had in November. The employment to population ratio popped up to 60% from 59.8% as the participation rate held steady at 62.5%. I admittedly had been looking for a sharp increase in participation that never materialized.
Part-time employment was not a major part of the story, at least for December, as 111,000 fewer people were working part time for economic reasons and 134,000 more individuals were working part-time for noneconomic reasons. The unemployment rate (U-3) surprisingly dropped from 4.2% to 4.1%, while the underemployment rate (U-6) just as surprisingly dropped from 7.7% to 7.5%.
Perhaps most impressive of all were these two facts: One, the percentage of labor force participants' unemployed for 15 weeks or longer (U-1) dropped from 1.7% to 1.6%, and, two, the unemployment rate dropped across both men and women as well as across all racial and educational demographics tracked by the BLS.
Marketplace
It wasn't pretty. The U.S. Dollar Index ran last week, from less than 108 to nearly 110. By week's end, the U.S. Ten Year Note paid close to 4.77%, after flirting with the 4.8% level, and yielding as little as 4.51% as recently as Tuesday. The 30-Year Long Bond hit 14-month high yields. The fear that seeped into the marketplace was connected to inflation, on which we'll hear about often this week.
In regard to that light macroeconomic calendar that I referred to last week, not only is job growth accelerating again, according to both the ISM Manufacturing and Services PMIs for November, prices are climbing again across large swaths of the U.S. economy.
Perhaps, the death knell for U.S. financial markets, at least on Friday, came 90 minutes after the December jobs numbers. That was when the University of Michigan released preliminary survey results for January Consumer Sentiment. The survey showed not only a surprisingly sharp drop in headline sentiment, but inflation expectations soared way beyond estimates. According to the survey, expectations for one-year out inflation ran in January to 3.3% from just 2.8% in December and for five-year out inflation, to 3.3% from 3.0% in December.
Equities
Among the major to mid-major U.S. equity indexes:
- The S&P 500 gave up 1.59% on Friday and is now down 1.42% year to date.
- The Nasdaq Composite gave up 1.63% on Friday and is now down 0.77% year to date.
- The Nasdaq 100 gave up 1.57% on Friday and is now down 0.78% year to date.
- The Russell 2000 gave up 2.22% on Friday and is now down 1.9% year to date.
- The S&P Small Cap 600 gave up 2.05% on Friday and is now down 1.86% year to date.
- The S&P Mid Cap 400 gave up 1.39% on Friday and is now down 0.69% year to date.
- The Dow Transports gave up 1.14% on Friday but is still up 0.17% year to date.
- The Philly Semiconductors gave up 2.42% on Friday but is still up 1.16% year to date.
- The KBW Bank Index gave up 2.7% on Friday and is now down 1.19% year to date.
On Friday, 10 of the 11 S&P sector SPDR ETFs closed in the red, led lower by the REITs XLRE, the Financials XLF and Tech XLK, all of whom closed more than 2% lower. Only Energy XLE posted a winning session despite the stronger U.S. dollar.
For the week, eight of the eleven S&P sector SPDR ETFs closed in the red, as the REITs gave up 4.06% and six other funds among the group all gave up at least 1.95%. Energy not just Friday's top performing sector SPDR, but the week's as well.
Earnings
Though a few names have already reported their quarters, the unofficial kick-off of the fourth quarter earnings season is seen by most as commencing this week, on Wednesday, when the big banks start posting the financial results. According to FactSet, the S&P 500 is expected to have grown earnings 11.7% (down from 11.9% last week) year over year for Q4 2024 on revenue growth of 4.7% (up from 4.7% last week).
For the quarter, the Financials are expected to post by far the greatest earnings growth at +39.5%, with Communication Services in second place at +20.8%. Four sectors are expected to show a year over year earnings contraction, led lower by Energy at -26.4%.
As for the current quarter (Q1, 2025), consensus is currently for earnings growth of 11.8% (down from 11.9%) on revenue of 5.1%. For the full year 2025, Wall Street sees earnings growth of 14.8% on revenue growth of 5.8%. The full year expectations have not moved since last week.
On valuation, the S&P 500 went into the weekend trading at 21.5 (up from 21.4) times 12-month forward looking earnings and 27.7 (up from 27.5) times 12-month trailing earnings. These ratios are well above their respective five-year and ten-year averages.
The GDP Game
This past week, the Atlanta Fed revised their GDPNow model for the fourth quarter up to growth of 2.7% quarter-over-quarter, seasonally adjusted annual rate, from 2.4% the week prior. Among other regional central bank district branches running close to real-time GDP models for the current quarter, the New York Fed revised that estimate for Q4 growth all the way up to 2.36% from 1.9%, while the Cleveland Fed kept its view for Q4 growth at 1.85%. The St. Louis Fed, however, also revised their model for Q4 GDP growth higher, to 1.91% from 1.21%.
This week, expect Atlanta to revise their model on Thursday after December Retail Sales and again on Friday in response to December Housing Starts and Industrial Production. The other three regional Fed models will wait until next weekend to tweak their models.
Beatdowns Continued?
Readers should recall last Thursday's Market Recon column. Yes, this came after the S&P 500 had closed in the green on Wednesday. Yes, for those readers who took Thursday completely off (remember, bond markets were open), there was a Market Recon column here at TheStreet PRO that day, and what I showed you unfortunately proved true on Friday and if this (Monday) morning's equity index futures markets are any indicator, the beatings are not over. I thought maybe we needed to update last Thursday's charts, realizing that some folks may have missed them.
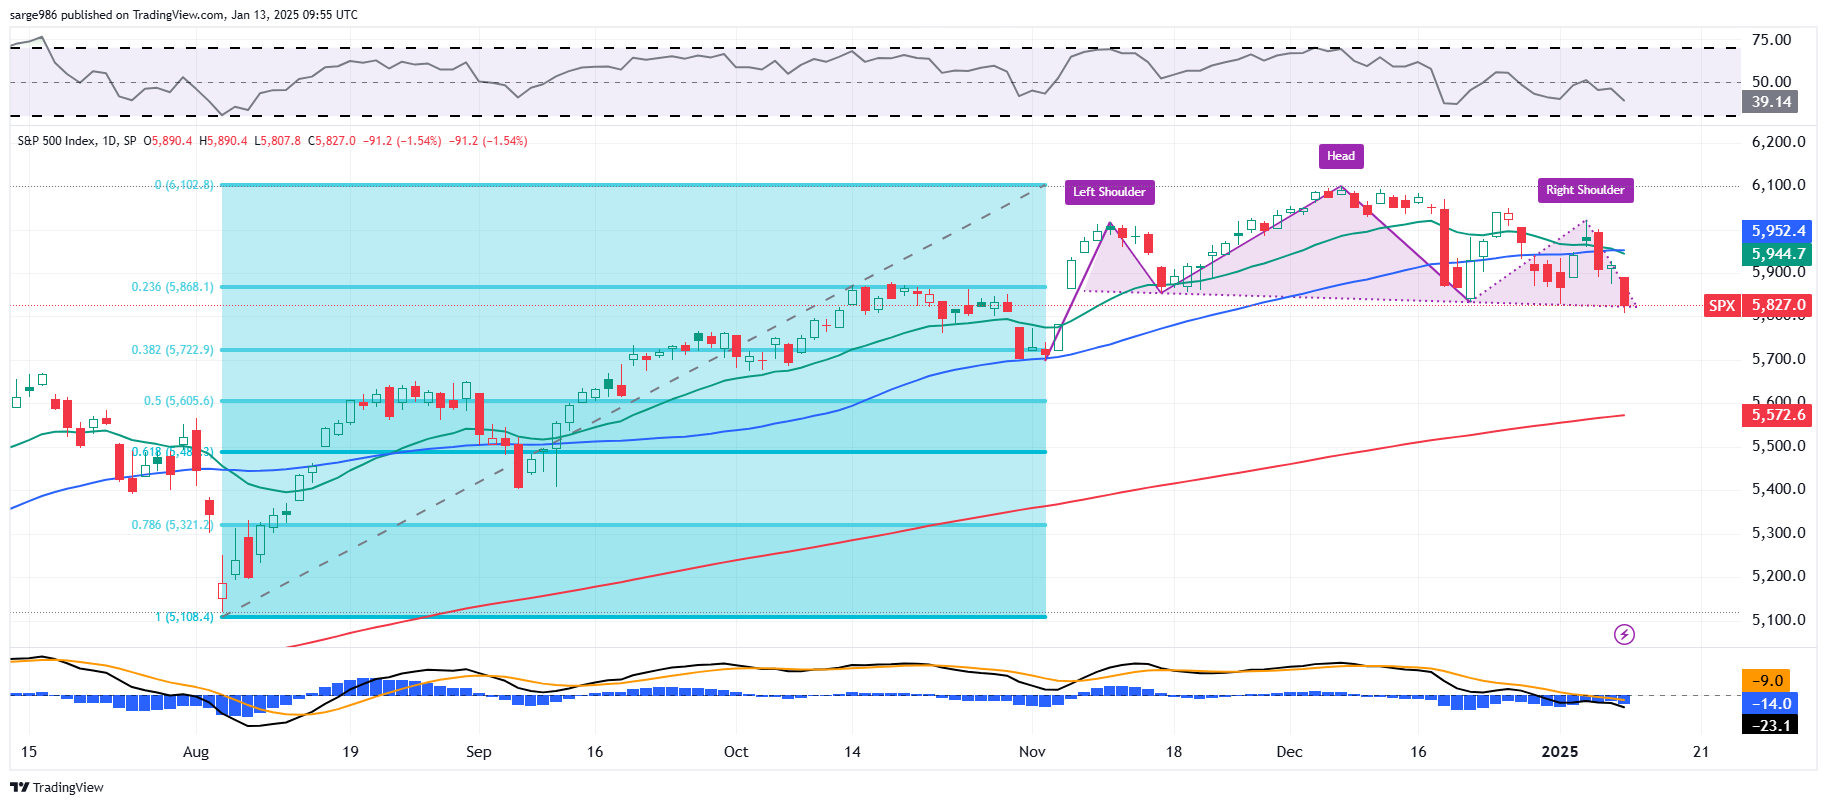
Readers will note that the S&P 500 had developed a head & shoulders pattern, which is a pattern of bearish reversal, that stretches from very late October into 2025. The pattern displays a neckline at 5,827, which would be our downside pivot. Readers may notice that this neckline runs almost even with what would be a 23.6% Fibonacci retracement of the rally that ran from the August low through the December high, making this level all that much more significant as it has already provided support multiple times as that head and shoulders pattern developed.
Relative Strength is still now on the weak side, as the daily Moving Average Convergence Divergence has postured itself more bearishly. Within the MACD, the histogram of the 9-day exponential moving average has run below zero for almost a month as the 12-day EMA has crossed below the 26-day EMA. These two averages are also now below zero. Readers should also note that the index had undergone a swing traders' or mini-death cross (The 21-day EMA crossing below the 50-day simple moving average) late last week.
Where did the S&P 500 close on Friday? That's right, 5,827. Should this neckline crack, which at zero dark-thirty on Monday morning looks likely... Readers are reminded that the half-way back point or 50% retracement of the August into December rally stands at 5,605.
Remember that while 50% retracements are common, they are not true Fibonacci levels. That said, they are their own thing and are recognized by trading algorithms, giving them more gravitational pull in the electronic era of trade than they once had. Should the S&P 500 drop that far, the 200-day SMA could be in that area by that time, making that level all the more significant. At least we know for the short to medium-term where support might be.
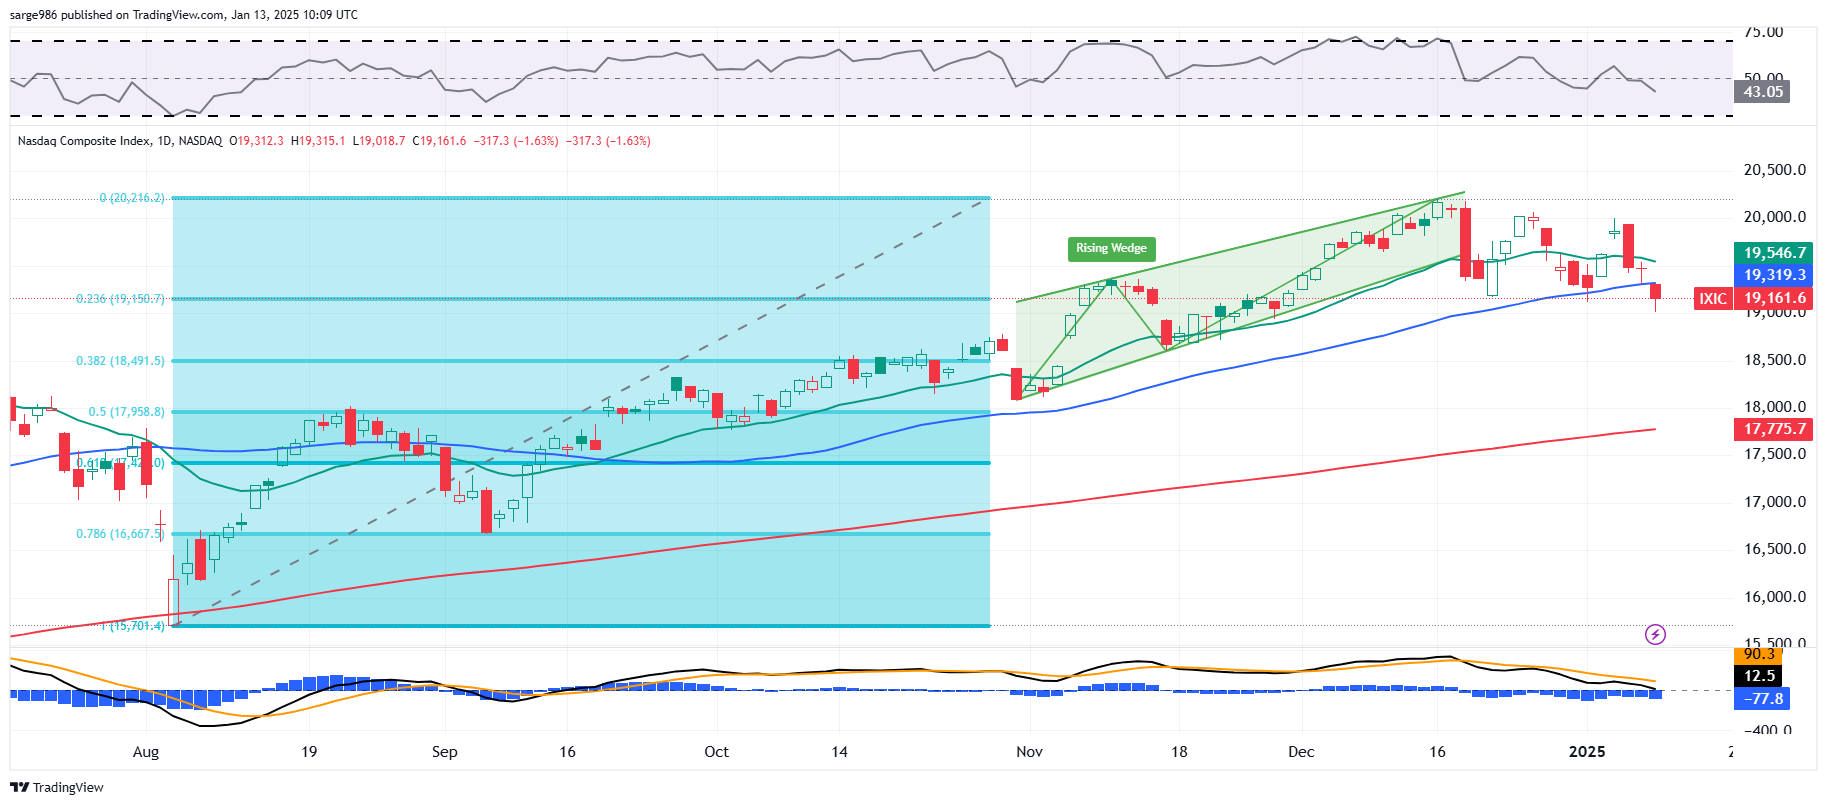
The Nasdaq Composite presented us not with a head & shoulders pattern, but with a rising wedge pattern. This is also a pattern of bearish reversal. This index had been able to hang onto support at its 50-day SMA, that is until Friday. For the most optimistic among us, the index still has not broken contact with that blue line, but it could serve as resistance now, rather than support.
Similar to what we see above with the S&P 500, Relative Strength is weakening. Here too, the daily MACD has turned bearish. While the histogram of the 9-day EMA is and has been, below zero, the 12-day EMA has crossed below the 26-day EMA. That said, at least for now, both those 12- and 26-day lines remain above zero. That, in all probability, changes this morning.
The S&P 500 sports the neckline of a head and shoulders pattern as pivot, for the Nasdaq Composite, that 50-day SMA serves this function. With contact broken, the index could also in a worst short to medium-term case... make a run for support down at the 200-day SMA.
Yes, for the indexes to reach for their 200-day SMAs would be quite a sell-off. No, Fed Funds futures markets are not yet pricing in any likelihood for a rate hike in 2025, but that's probably just a matter of time. For now, the probability for a first (and only) 25-basis point rate cut in 2025 has been pushed all the way out until September.
What's Ahead?
- This week is a very heavy week for the release of domestic macroeconomic data. On Tuesday, we'll see the December producer price index, followed by December consumer price inex on Wednesday. December retail sales will cross the tape on Thursday, followed by December Housing Starts and December Industrial Production on Friday.
- Right now, the Fed's public speaking docket is fairly light this week. That could evolve as the week progresses and as the Fed's media blackout period ahead of their January 29th policy decision starts this coming Saturday. There are four speakers already lined up for Wednesday ahead of the release of the Beige Book that afternoon. Wednesday's group will be headlined by New York's John "Lightning Bolt" Williams and Chicago's Austan "Perma-dove" Goolsbee.
- Earnings season kicks off this week led by the large banks. On Wednesday, we'll hear from BlackRock BLK, Citigroup C, Goldman Sachs GS, JP Morgan JPM and Wells Fargo WFC. Thursday will bring us quarterly results from Bank of America BAC, Morgan Stanley MS and UnitedHealth UNH. Lastly, on Friday morning, Fastenal FAST, Schlumberger SLB and State Street STT will go to the tape.
What am I Doing?
Am I sure that these indexes drop all the way to their 200-day SMAs? No. I do expect some volatility with any upside sparked by the idea of a deregulated economy as Inauguration approaches. The negativity is obviously driven by the prospect for a continuance of what is a rising-rate environment, despite the stupidity of what the Fed did in 2024.
The market is trying to price in the fiscal largess of the past 24 years, but most especially the extreme irresponsibility of the past four. The inflation that this irresponsibility coupled with the mismanagement of the duration of that expanded debt-load by the Treasury Department during this era will not vanish easily.
I am adding very gingerly to my favorite names as they have all now gone on sale. It might hurt, but I am and will be adding to Palantir PLTR, Rocket Lab USA RKLB, SoFi Technology SOFI and others. This is why I always preach on taking some action at target prices when breached... so you can buy something when markets swoon. Can I get run over? Of course. Am I afraid? I only fear God and for the safety of my loved ones. Is this fun? No. It is challenging though and who amongst our legions is not up for a challenge? Rock on.
Economics (All Times Eastern)
2:00 p.m. - Federal Budget Statement (Dec): Last $-67.6B.
The Fed (All Times Eastern)
No public appearances scheduled.
Today's Earnings Highlights (Consensus EPS Expectations)
Before the Open: KBH (2.44)
At the time of publication, Guilfoyle was long NVDA, WFC, PLTR, RKLB, SOFI equity.
