The Markets Are Chaotic, but Is it as Bad as it Feels?
The American exceptionalism trade has turned into a boycott of U.S. assets, but what do the charts tell us?
You've reached your free article limit
You've read 0 of 1 free Pro articles.
The American exceptionalism trade has turned into a relative boycott of U.S. assets. In late 2024 and early 2025, offshore money flowed into the U.S. stock and bond markets in hopes of participating in the AI boom and the so-called Trump trade, but the market had it wrong.
The unwinding of the original Trump trade and the positioning of Trump Trade 2.0 have been mind bending. Yet, when looking back at history, today’s volatility isn’t as shocking as it feels.
For instance, we have been collectively lulled to sleep by low market volatility and a group-think mentality. Rather than question markets, the masses accepted the narratives of the day and pressed the gas on trend-following and momentum-chasing.
The assumptions were that a business-friendly environment was bullish for stocks and the dollar, but tariffs were bearish for treasuries. This one-sided thinking wasn’t healthy or sustainable and needed to be reversed. Despite the widespread panic by some, markets have been relatively orderly in adjusting for 180-degree turns in narrative and reality. It feels worse because it’s been three years since we have experienced market-rocking volatility. Perhaps we forgot what it was like. Here are some charts to illustrate how what we believe to be abnormal today is actually par for the course in financial markets:
U.S. Dollar Index
The U.S. dollar index futures traded on the ICE Exchange are arguably the best gauge we have for measuring the strength or weakness of the U.S. dollar against other major currencies.
The contract is essentially an index in which the greenback is paired against the euro (primarily), the yen, the Swiss franc, the Canadian and Australian dollars, and others. The last time Trump was in office, we can see that the dollar behaved similarly, but with moderately less volatility. Ironically, the same resistance line dating back to the financial crisis capped dollar gains as Trump 1.0 took office, as it reversed the dollar when Trump 2.0 stepped into the White House.
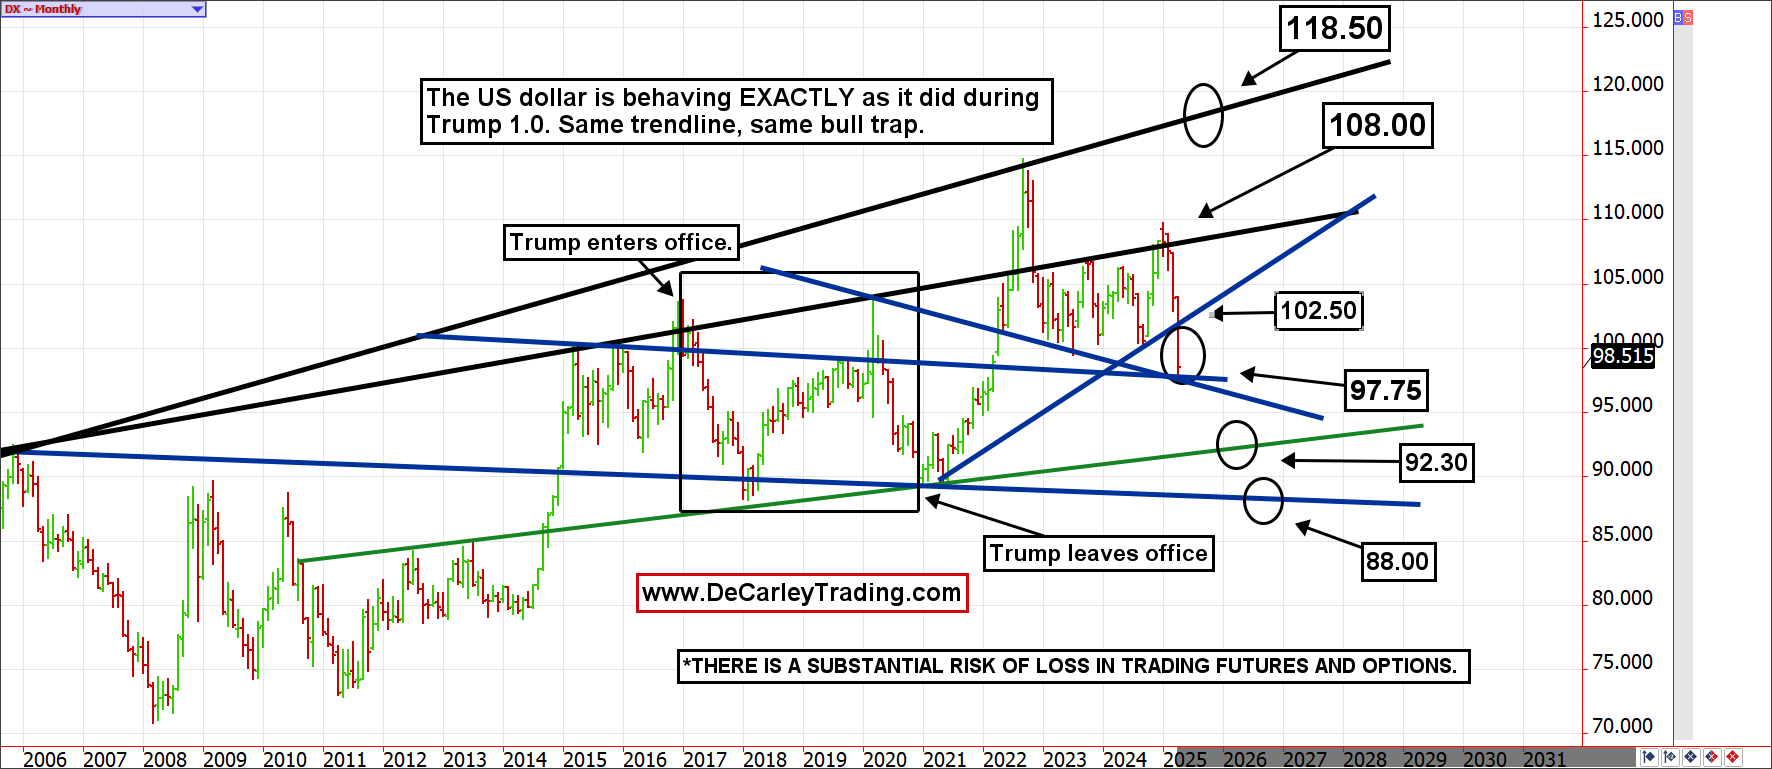
Trump 1.0 saw the U.S. dollar decline from 105.00 to the high 80.00s without much back and fill. However, due to the pace of the decline, the uncertainty around tariffs and monetary policy, and the market approaching what has been a pivot area for the dollar index, that leads us to believe the odds of a large dollar bounce are significant.
We believe 102.50 is in the cards, but it would likely be a ceiling. Even so, this digestive rally might be big enough to lure market participants into believing the worst is over; unfortunately, we don’t believe that will be the case. Instead, we believe the low 90.00s or high 80.00s are in the cards.
Even if you aren’t trading currencies, other assets react to changes in the currency market. For starters, the weaker dollar makes U.S. exports seem more attractive and could counteract some of the negative impacts of the tariffs. Further, eventually, it will be a source of stock market prosperity. The weaker dollar might also offer support to commodities such as crude oil and natural gas, which have mostly ignored the benefit of a lower dollar, while the grain and livestock markets have embraced it.
The Japanese Yen
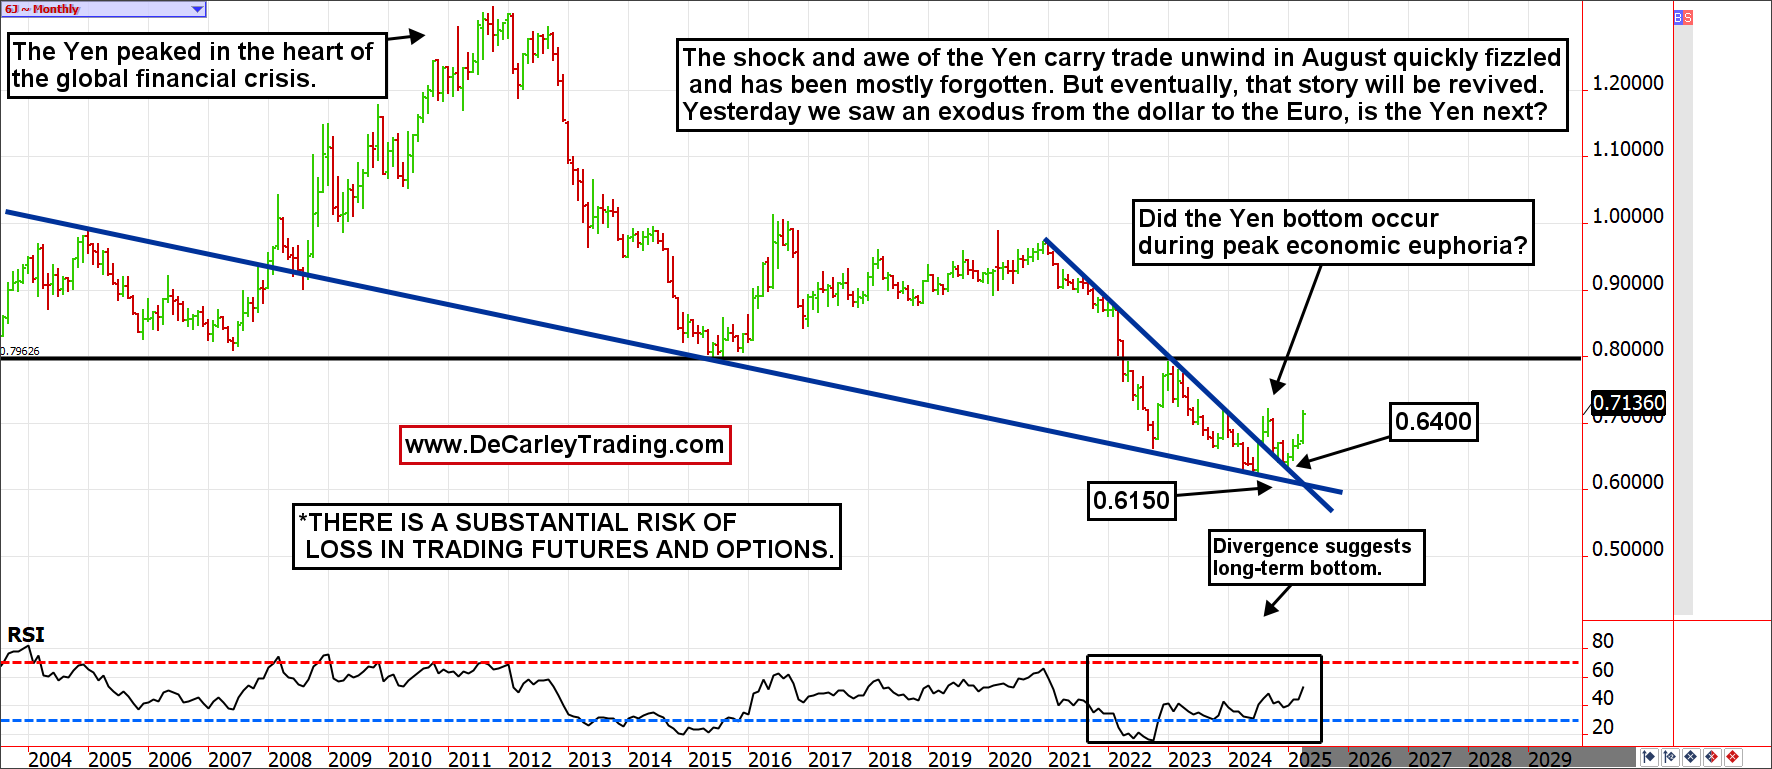
The yen has a way of marking historical economic turns. The yen famously peaked during the global financial crisis. It is quite possible that the yen reversed its multi-decade bear market at the peak of euphoria. Remember, much of the global prosperity that has taken place since the pandemic has been manufactured by aggressive economic stimulus via money supply creation.
In essence, we have been buying GDP domestically and abroad; going forward, growth will need to be organic, and that will be a tough pill to swallow for markets and economies that are drunk on liquidity. Yen call options are still cheap despite the rally.
The Euro
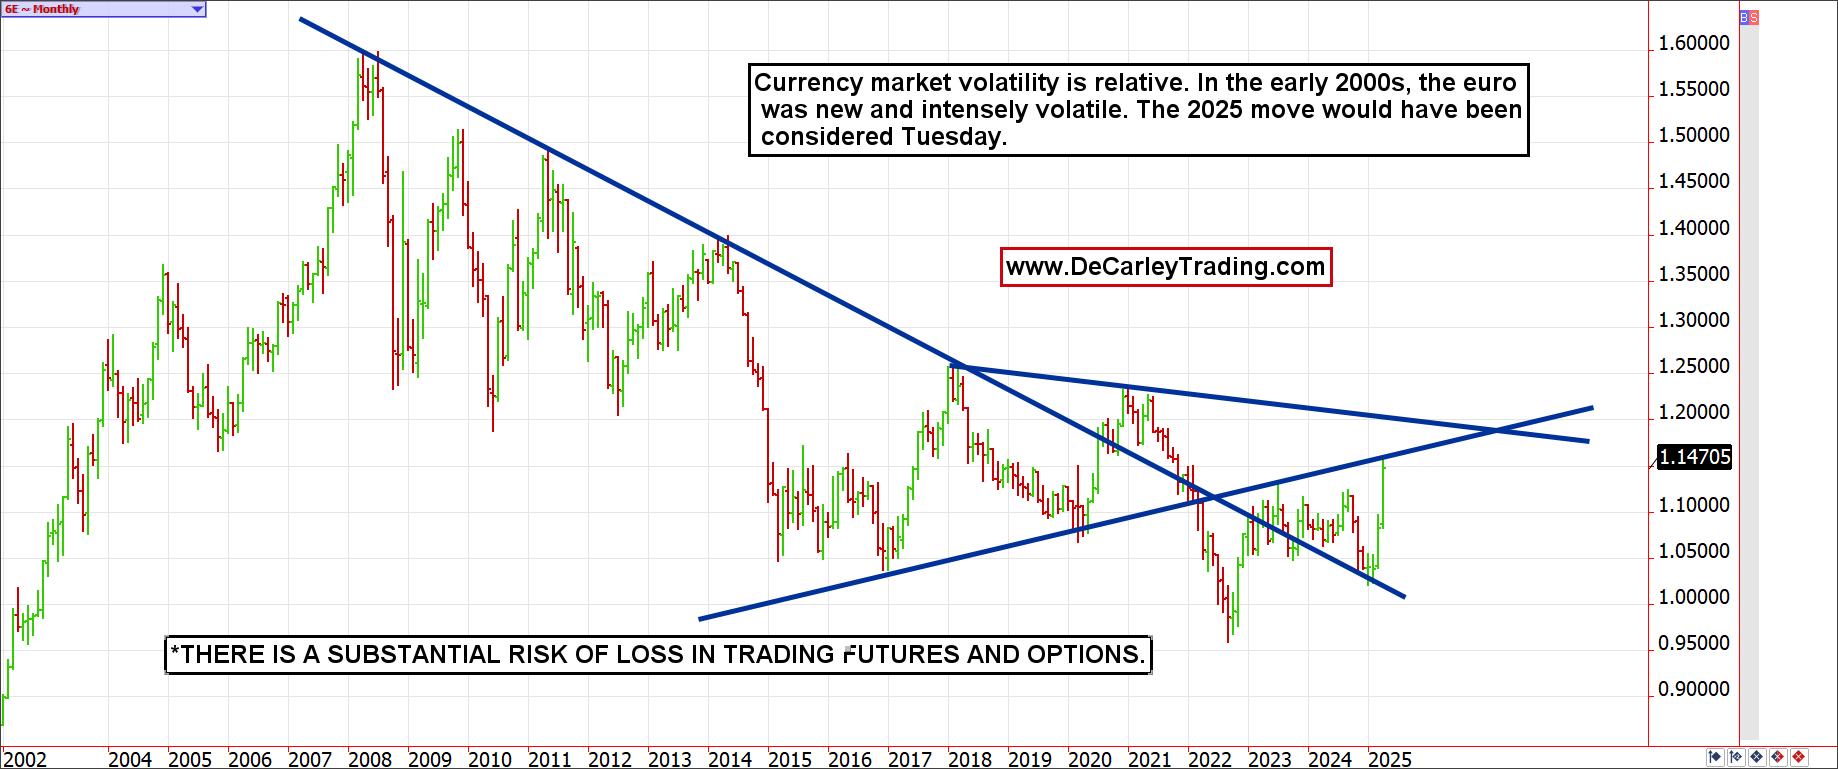
If you were strictly going off of headlines, you would assume the euro was skyrocketing to unfathomable highs. Yet, a monthly chart reveals that the euro isn’t all that high, nor is it all that volatile. Because the currency markets have been in a bit of a slumber in recent years, any type of fluctuation feels substantial. So, if you were thinking of going to Europe this summer but are thinking you missed the boat on a discount, you haven’t; perspective is everything.
We have suggested that our speculative brokerage clients buy cheap euro currency puts with a September expiration, just in case the bottom falls out.
10-Year Note Futures
Anyone with a TV or an internet connection has likely heard that foreign investors are selling U.S. treasuries due to a lack of faith in the new administration or, in the case of Japan and China, a potential retaliation against tariffs.
Constant headlines about the treasury market “shock” are changing investment portfolios worldwide. Yet, the monthly chart depicts a run-of-the-mill price bar that shouldn’t be enough to spook anyone out of any portfolio allocation.
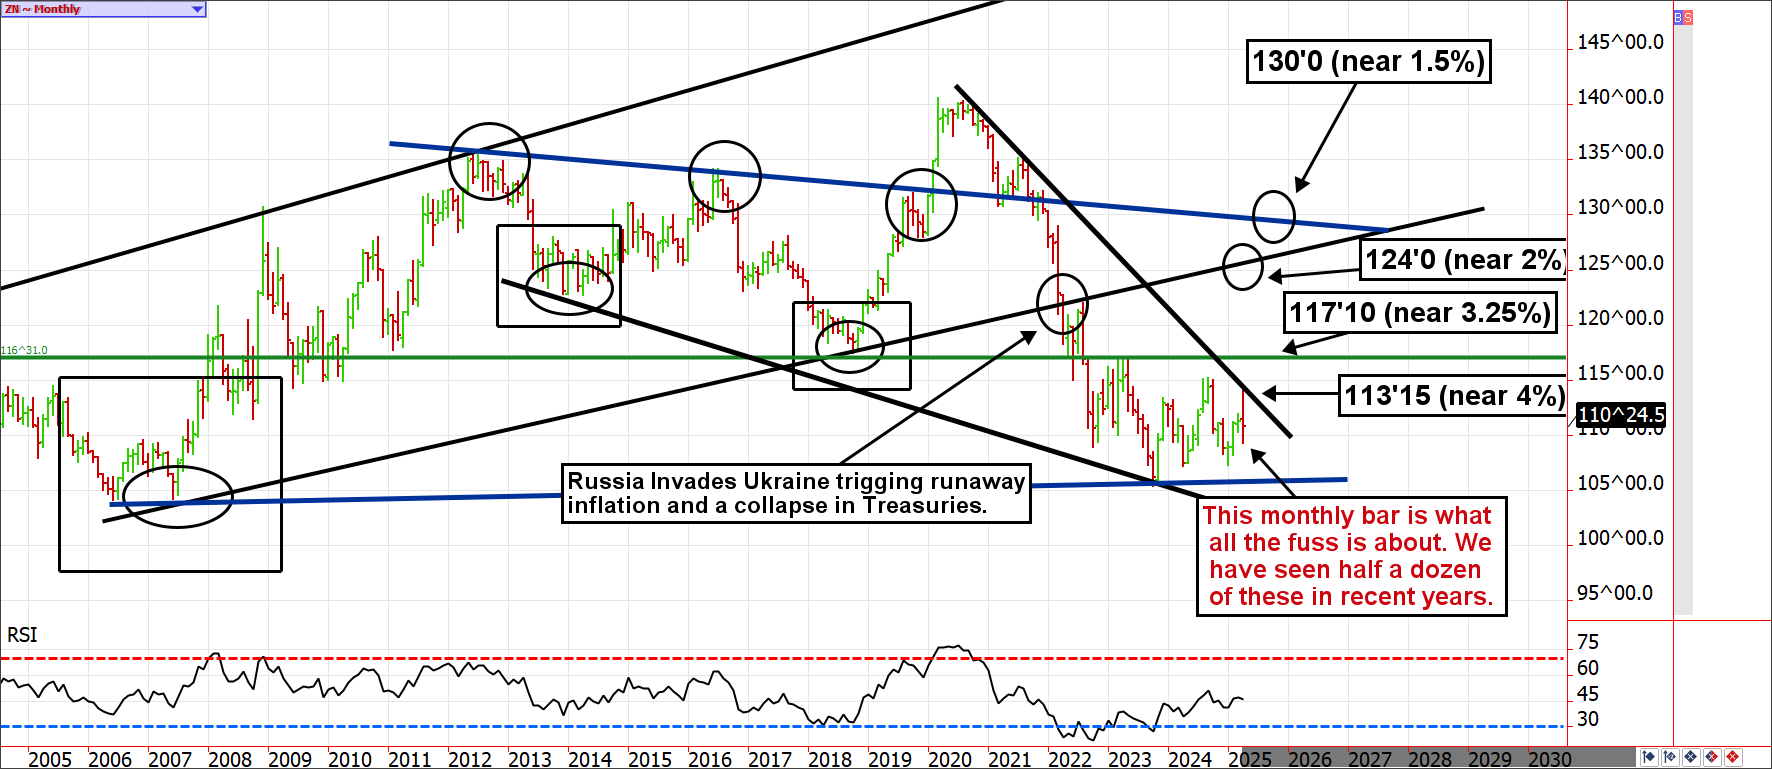
The thinking suggests that foreign countries are liquidating their U.S.-denominated bonds to increase interest rates indirectly. This isn't easy to prove or quantify; it might be true. However, despite the narrative, treasury market volatility in April isn’t anything we haven’t seen in several other months since Russia invaded Ukraine.
The 2025 bond market has been noticeably stable in relation to the 2023 and 2024 bloodbath. While it is true that the U.S. has some housecleaning ahead to tidy up its balance sheet, there is no such thing as a truly risk-free security, but U.S. debt is probably as close as you can get to that.
If, while doing your homework, you conclude that treasuries aren’t where you want to park risk-off savings allocations, that’s OK, but don’t let frantic headlines push you. If you are up for speculation in this space, 10-year note calls are cheap given market uncertainty.
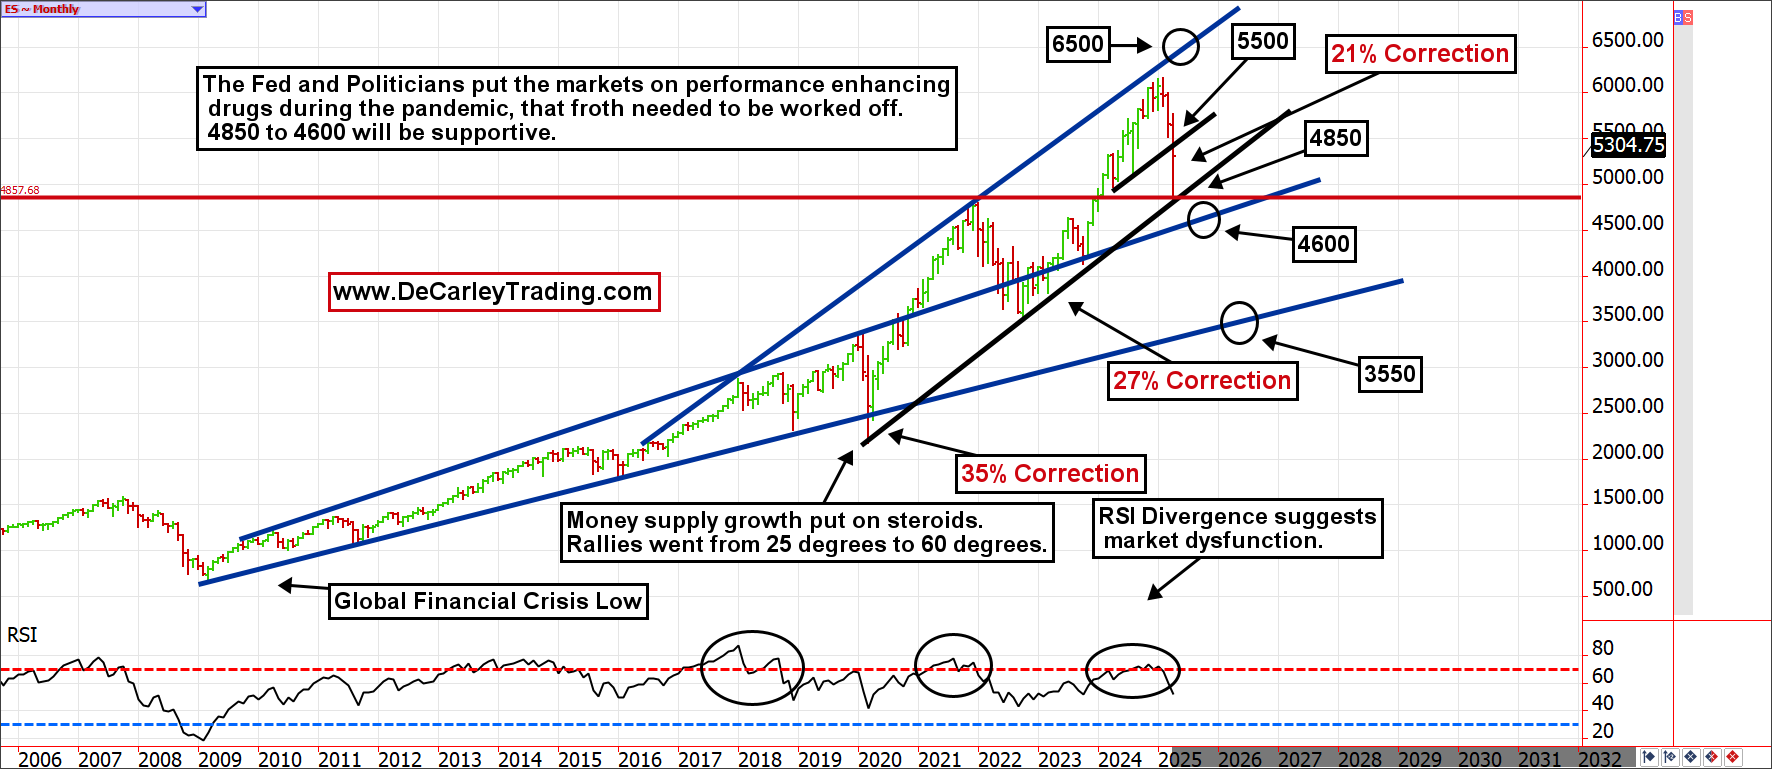
S&P 500 Monthly
Since the 2020 lows, the equity markets have had two uncivilized rallies.
These rallies saw prices reach levels that were not mathematically logical. Further, they ran at a slope that had rarely, or never, been seen before. These rallies were normalized each time by pointing toward the stay-at-home economy (2020 and 2021) or the AI boom (2023 to 2025). In the end, out-of-hand markets will always obey mean reversion; if they only went up, we would have to remove “risk” from the risk-to-reward ratio.
The current correction has drawn down just over 21% of its value, but uncivilized rallies come with uncivilized corrections. History suggests that a trend line near 4600 is possible, which would be near a 25% pullback. Corrections feel like the end of the world, but they are natural occurrences that eventually breed amazing opportunities. If you want to guarantee a smooth ride, you might want to try T-bills. In the meantime, we have suggested our speculative clients employ put butterflies seeking continued selling pressure into the mid-to-high 4000s but we will be looking for bullish option trades if we get down there.
Conclusion
Financial market volatility matters, but so does context. Don’t let the media tell you the world is ending; it might be, but it hasn’t yet.
If anything, what is happening in the currency, stock and bond markets will eventually provide opportunities for the stock, commodity and bond bulls, but it probably won’t happen immediately. In the meantime, I leave you with a relevant Warren Buffett take: “The (stock) market is a device for transferring money from the impatient to the patient.”
At the time of publication, Garner had no positions in any securities mentioned.
