The Magnificent Seven Is Down to Four, but Tariffs Could Be the Real Problem
Let's look at history to see how today's tariffs could impact the S&P 500.
You've reached your free article limit
You've read 0 of 1 free Pro articles.
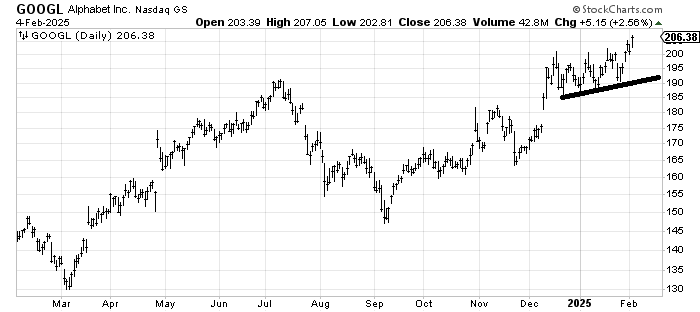
With Alphabet’s earnings we must wonder if we have now lost yet another of the OG Mag 7. Based on the after-hours action, it looks as if it will open somewhere near that line. Even if it is not at the line, it ought to be in the area of those four prior lows—we’ll call it 185-190. But that is not the concern.
The concern is that of those original seven, we were already down to four coming into this week, and now we’re down to three that are still trading at the highs: Meta, Netflix, and Amazon. Don’t misunderstand me: they still move the index. With market caps as big as they are, they will continue to move the indexes, but they no longer move as a block, nor are they market leaders. They have begun to split in their directions.
Unless, if you still believe they are market leaders, then you would have to think they are telling us the market is diverging and that the chop we have seen these last few months is not a weigh station before we power ever higher. It means more volatility. That remains my base case for this month.
Since Tuesday’s action did not change any of the indicators, I want to address a question I have been asked: what do I think the market will do when tariffs are implemented? I am not a tariff expert, nor do I do any economic work so I can only repeat what I read. I won’t do that.
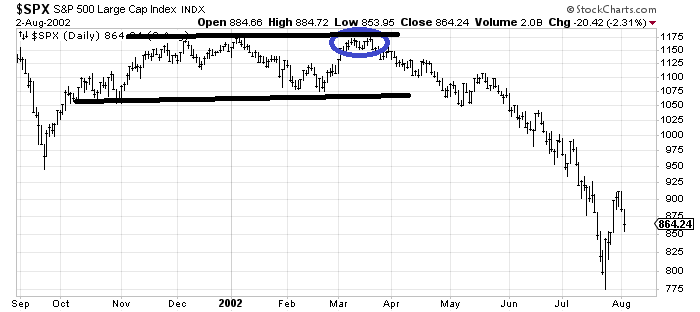
What I can do is tell you that from October 2001 to March 2002, the S&P was in a wide trading range, almost ten percent. We had a terrific rebound off the 9/11 slide and then we went into one giant sideways up and down. It looks different than today’s sideways, in that the moves were more elongated and not as short and sharp as today’s, but the end result is that we were in a range.
In early March 2002 former President George W. Bush implemented steel tariffs. That’s the blue circle on the chart. You can see that the market slid from that point forward. Was that the reason? Heck, I am terrible with narratives.
I know everyone wants to cite 2018’s tariffs, but this came to mind for me only because I remembered that giant sideways that preceded it. I am not a fan of analogies from charts alone because they always seem to end in a 1929 crash (!!), but I would be remiss if I didn’t show you this period of time. At least you should be aware of another point in time we had tariffs implemented and what transpired in the market.