The Harder They Come, the Harder They Fall?
Let's connect the dots on soft economic surveys turning into hard data. And that brings us to bonds...
You've reached your free article limit
You've read 0 of 1 free Pro articles.
Back in the spring, when the market was heading down seemingly daily, and folks were bearish as can be, we saw many economic — not market, but economic —surveys that showed extreme "bearishness."
I tend to use market surveys and sentiment data but have never studied economic ones. However, I can look at a chart and determine when something looks extreme and those surveys looked extreme.
They call these economic surveys "soft data." They waited for it to turn into "hard data," meaning those surveys where folks said what they thought would happen (i.e. managers planned to order fewer "whatevers") actually finding their way into the economy and therefore the actual economic data.
Even Fed Chair Powell discussed it at the May meeting. He noted that the soft data had not yet showed up in the hard data. The market rallied on. Then all that talk of soft vs. hard data died down, probably because the market rallied. But also the soft data continued to stay down, but the hard data did not reflect that.
Oh we’ve seen a bit of weakness here or there in the hard data, but nothing dramatic. Then came Friday and the jobs report with all those revisions. I have always said, when you see folks give their prognostications of what the economic data will be, my guess is there will be revisions. It seems to me that economic data is always filled with revisions. Heck, think of how we see the preliminary GDP and then the final GDP.
Anyway, back to Friday. Everyone seemed to want to pick apart the methodology or some such thing like that, but the one thing I did not hear was, "oh boy, there’s the hard data." Should the next few weeks bring us more hard data that confirms Friday’s jobs number I suspect folks will go back to connect the dots between those "soft" surveys a few months ago and the "hard" data now. But I am not an economist!!
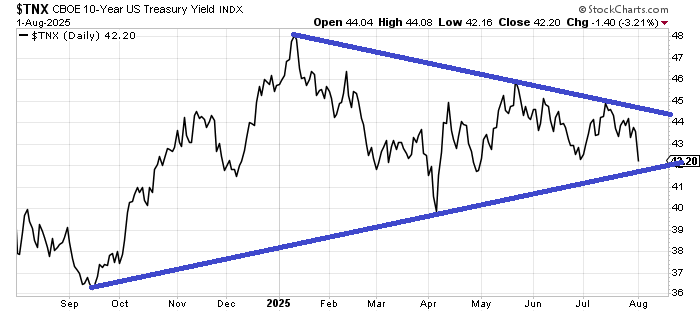
And that brings us to the bonds. I have long said I thought bonds were in a trading range. I have used that 4% area on the low end and 5% on the upper end at times, but generally speaking, bonds have been sideways for a few years now.
If we go back to the chart of yields on the 10-Year for the last year you can see an almost textbook triangle. The textbooks also say that for a breakout to be a good one the break should come somewhere between half way and three quarters of the way into the apex. My estimation is we are already about three quarters of the way there. I still think we’re in a trading range but this 4.0-4.20% area is going to see a lot of fuss if it breaks.
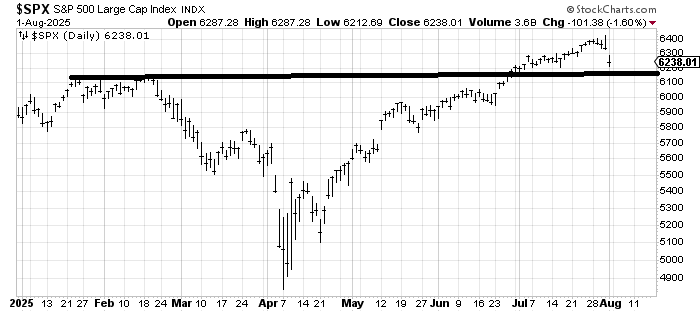
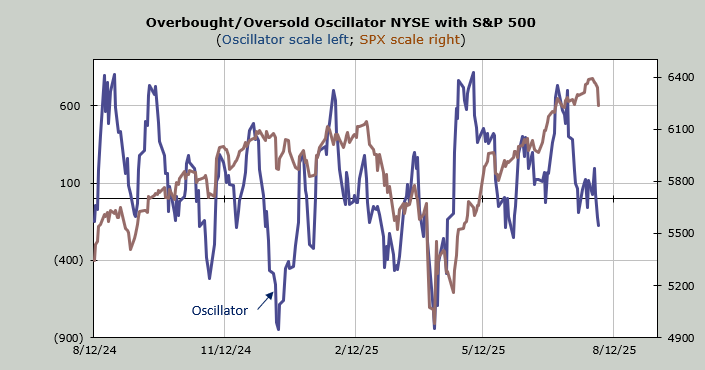
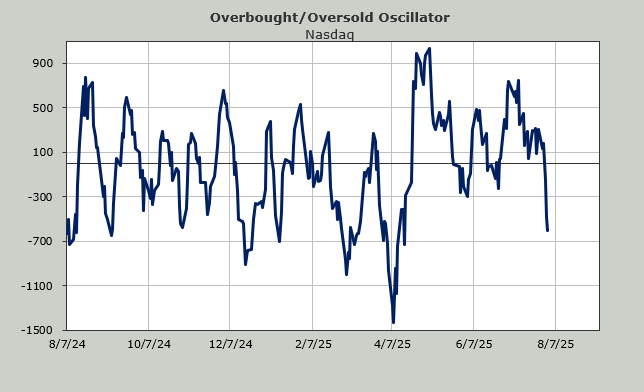
As for the major indexes, none broke support (i.e. the S&P 500 has support at 6150-6200), but the Overbought/Oversold Oscillator will get short-term oversold later this week. The intermediate term is not oversold.