The Good, the Bad and ... the 'Big Beautiful Bill'
Let's see how Trump's 'tax reform' proposal hit equities and bonds and pushed money to Bitcoin and gold, check that flap with Apple, examine the E.U. tariff delay and chart the markets.
You've reached your free article limit
You've read 0 of 1 free Pro articles.
U.S. equities had it rough last week. The high-profile event was Pres. Trump's "Big Beautiful Bill," a multi-trillion-dollar tax reform package, which in legislative form, spans more than a thousand pages. The bill passed in the House of Representatives by a single vote, 215-214 in partisan fashion. While true that the Congressional Budget Office includes no offset for the current slate of tariffs that have been implemented on goods imported to the U.S., the bill is expected to exacerbate the already reckless fiscal condition of federal spending going forward. That bill must be passed in the Senate to be sent to the president for an autograph that would make it law.
This had an adverse impact on bond markets, forcing yields higher across the spectrum of U.S. Treasury debt securities. The pressure on debt securities extended into the stock market as several high-level corporate leaders spoke of a potential period of stagflation across the U.S. economy. Stagflation, for those who wanted to ask but did not, is when higher than welcome inflation couples up with slower than welcome economic growth.
After having rallied for three of the four weeks prior and four of the six past weeks going into last week after tensions between Washington and Beijing had appeared to thaw, these markets took a step back. Where did the capital drawn from these markets go? Apparently at least some of it moved into Bitcoin. While gold rallied throughout the week, Bitcoin traded as low as $103,880 per token last Monday and as highs as $111,900 last Thursday.
Evolution of a Tuesday
This past Friday, Pres. Trump put the "whammy" on an already negative week, in returning to his method of using trade as a tool in the reaching of his goals for the economy. On Friday, the president implied that Apple AAPL could face 25% tariffs on imported consumer electronic goods, and that diversifying production away from China into India and Vietnam would not cut the mustard. The president wants to see increased U.S. production. Period.
Nearly simultaneously, the president also threatened new tariffs of 50% on all goods imported from the European Union due to a lack of progress in reaching any kind of trade deal with that bloc. This newly announced tariff was to be implemented on June 1 and would be an increase from the baseline tariff of 10% that the U.S. currently has on imports from nearly every nation on the planet plus an additional 25% tariff on autos, steel and aluminum from the EU.
Then Came Sunday
On Sunday, Pres. Trump announced that he had agreed to delay the increase of these tariffs on the European Union until July 9. This followed a call from European Commission Pres. Ursula von der Leyen. The E.U. had agreed in response to prioritize and "fast track" trade negotiations with the US. Von der Leyen, on her side of the ocean, said that it was a "good call" and that the EU needed until July 9 to "reach a good deal."
July 9 happens to be the same day that the American president's 90-day pause on his reciprocal tariffs expire with nations that have not made an acceptable effort to come to an eventual deal. U.S. equity index futures reacted very favorably to this news on Sunday evening and that rally carried over into Monday evening after a positive session for European equities during the regular Monday session. Additionally, back on Friday, Treasury Sec. Scott Bessent had said that he expected "several large" trade deals to be announced soon.
The Numbers
What the major to mid-major U.S. equity indexes did as equity markets struggled through the week just completed: Volatility obviously took an early May break.
- The S&P 500 gave up 0.67% on Friday and 2.61% for the week.
- The Nasdaq Composite gave back 1% on Friday and closed down 2.47% for the week.
- The Nasdaq 100 lost 0.93% on Friday and 2.39% for the week.
- The Russell 2000 lost just 0.28% on Friday but a nasty 3.47% for the week.
- The S&P Small Cap 600 lost 0.56% on Friday and an ugly 4.18% for the week.
- The S&P Mid Cap 400 lost just 0.18% on Friday but 3.58% for the week.
- The Dow Transports surrendered 0.6% on Friday, and a gnarly 4.11% for the week.
- The Philly Semiconductors gave up 1.58% on Friday and 4.47% for the week.
- The KBW Bank Index gave back 0.44% on Friday and 4.12% for the week.
On Friday, seven of the 11 S&P sector SPDR ETFs closed in the red, led lower by Technology XLK and the Discretionaries XLY. The Utilities XLU led the defensive sectors in the opposite direction, gaining 1.2% for the day.
All 11 sector SPDRs closed out the week with losses. Energy XLE gave up 4.08%, followed into the red by Technology at -3.44%. Seven of the eleven funds lost at least 2% for the week with only the Staples XLP losing less than 1%.
Earnings
First quarter earnings season is just about wrapped up, though we do have a few stragglers, primarily from the techs and retailers, coming in late in the season. This has been a much stronger season than had been expected. According to FactSet, with about 96% of the S&P 500 having reported, 78% of firms so far have beaten earnings expectations while 63% of firms so far have beaten expectations for revenue generation.
On a year-over-year basis the S&P 500 is now running at a first quarter blended (earnings & expectations) growth rate of 12.9% for earnings, down from 13.4% two weeks ago, but up from 7.2% several weeks ago. Revenue growth is running at 4.9%, up from 4.8% two weeks ago. Interestingly, as mentioned previously in this column, it appears that the first quarter may have pulled economic activity forward from the second quarter. Consensus for second-quarter earnings growth is down to 5.1% from 9.1% a month and a half ago. Second revenue growth is currently seen at growth of 4.0%, down 4.6% at that time.
For the first quarter, health care has run way ahead of the pack, with earnings growth of 43%. Communication services came in a very distant second place with growth of 29.2%. Three sectors posted first-quart earnings contractions, led in the wrong direction by Energy (-12.7%) and the Staples (-6.4%). For the full calendar year of 2025, Wall Street now sees earnings growth of 9.1%, down from 11.3% six weeks ago. Expectations for full year revenue growth have fallen from 5.4% to 4.9% over that same period.
As far as valuation is concerned, the S&P 500 went into this past weekend trading at 21.1 times forward looking earnings, up from 20.5 times two weeks ago and 25.6 times 12-month trailing earnings, up from 25.3-times two weeks back. These valuations are both now well above their five-year averages of 19.9-times for forward looking earnings and 24.8 times for trailing twelve-month earnings, respectively.
The GDP Game
Last week, the Atlanta Fed left their GDPNow model "unrevised" at growth of 2.4% (q/q, SAAR). There is still no estimate for Q2 gross domestic product ex-the gold trade at this time, so we'll assume that for now, this will not be an issue for the current quarter. Among other regional central bank district branches running close to real-time GDP models, the New York Fed's estimate for Q2 growth now stands at 2.43%, up from 2.42%, while the Cleveland Fed still sees Q2 growth of 1.97%.
The St. Louis Fed has increased their estimate for Q2 GDP from growth of 1.51% to growth of 2.44% over the past two weeks. That pretty much puts professional consensus at around growth of 2.4%. Where is my trusted Hedgeye Nowcast Model? After literally nailing the initial BEA estimate for Q1 GDP, Hedgeye's model for the second quarter is running just below 1.6%.
The Charts...
This is very interesting. You are going to want to check this out:
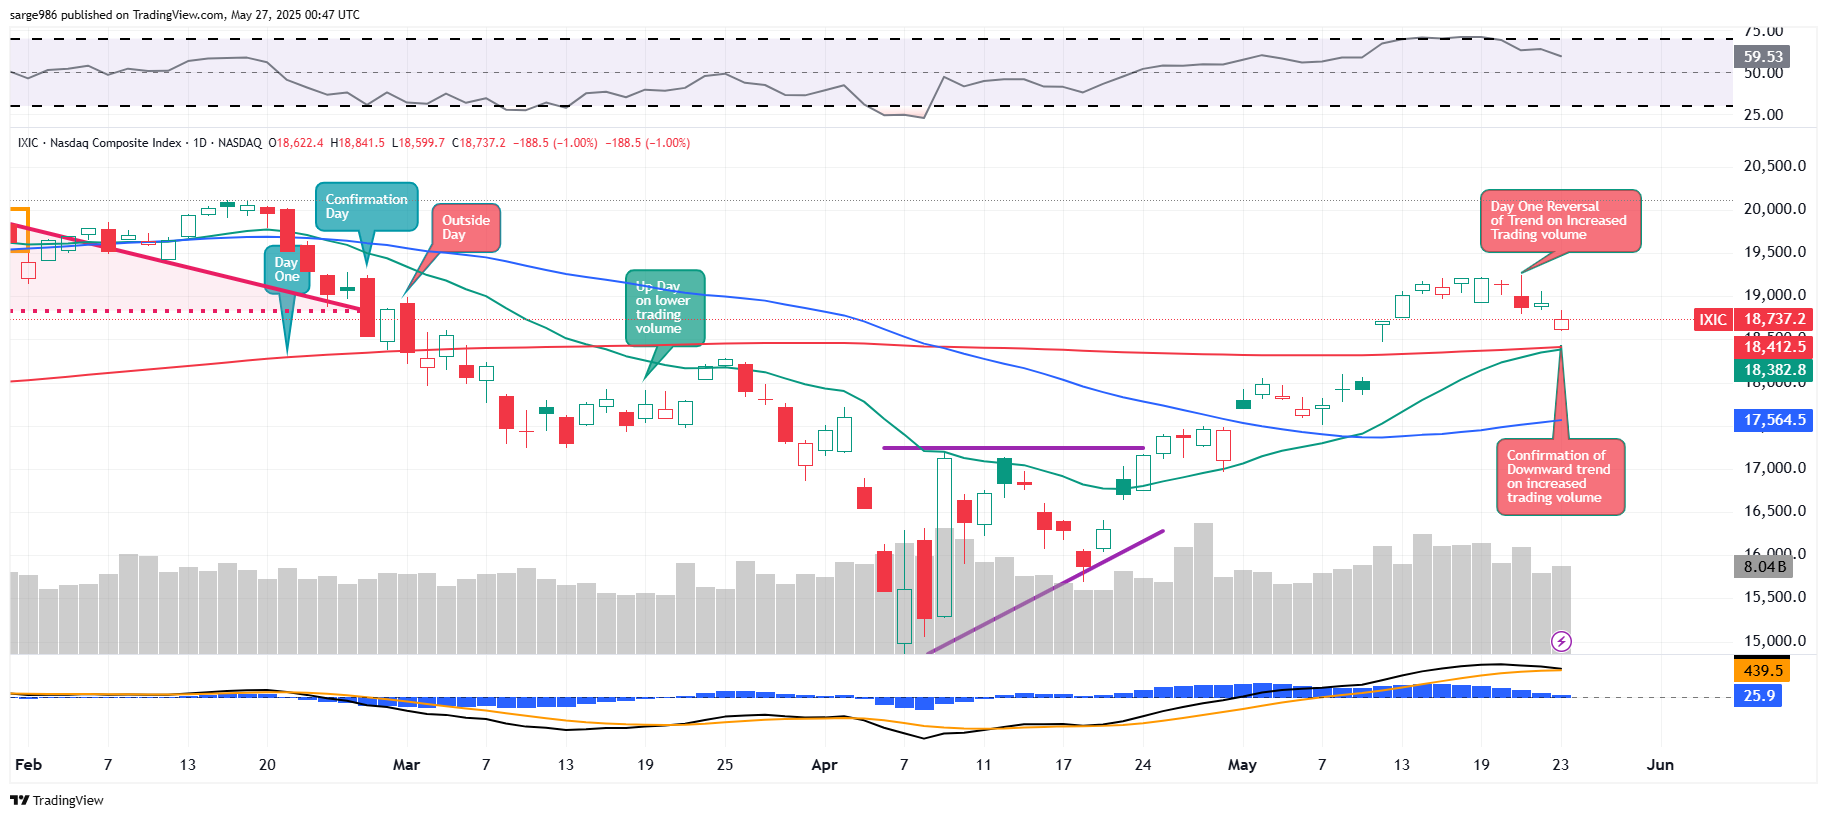
Readers will see that the Nasdaq Composite followed up the Day One Reversal of Trend on May 21st with a Day of Confirmation (confirmed by volume) on Friday. Readers will also see that as relative strength came off of nearly overbought levels, within the daily Moving Average Convergence Divergence, the 12-day exponential moving average appears set to cross below the 26-day exponential moving average. This would be bearish but has not yet happened. The president's announcement on Sunday may have checked, for now, this confirmation. Oh, by the way, this dropping of the next shoe was never completed as there was no such volume-based confirmation across the S&P 500.
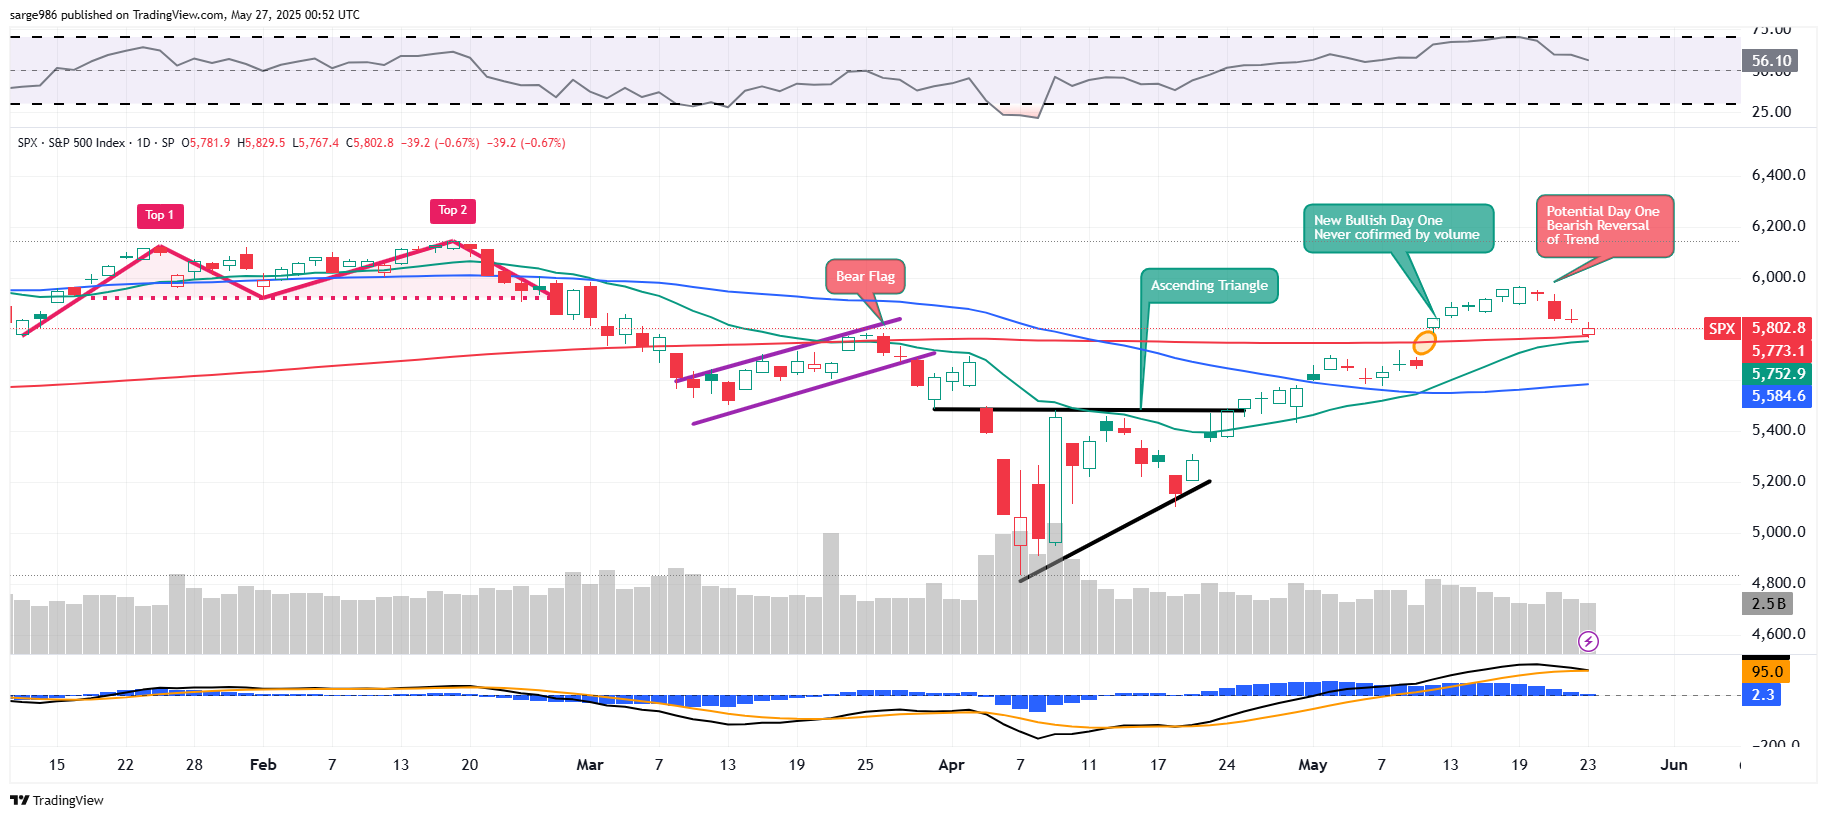
Take a look at this: The S&P 500 shows nearly the same price action as the Nasdaq Composite, with the same behavior for its RSI reading and the same near cross-under within the daily Moving Average Convergence Divergence. There are two key exceptions here, though. The S&P 500 appears to have been rescued by its own 200-day Simple Moving Average, and trading volume decreased from the day prior. Therefore, the S&P 500 has not yet confirmed a downward change of trend. Oh, and you know what they say, when making market-wide assumptions and projections, the S&P 500 outranks all other indexes.
What's Ahead?
There's more than one might expect to be packed into a holiday shortened week this week. Readers who don't really keep up on such things will be surprised at just how much macro is crammed into four days, not to mention how visible the Fed will be and how high-profile the earnings releases will be:
- The domestic macroeconomic calendar is extremely heavy this week. Tuesday morning kicks off with April Durable Goods Orders, which includes the all-important results for Core Capital Goods (a proxy for business investment). Later on Tuesday, we'll also see Home Prices for March and Consumer Confidence for May. Things lighten up a little on Wednesday and Thursday with the exception of the BEA's second estimate for Q1 GDP. When this Friday rolls around, investors will be hit with Personal Income and Spending for April, Headline and Core Consumer PCE Prices for April, April Wholesale Inventories, and University of Michigan's revision to May Consumer Sentiment and Inflation Expectations.
- The Federal Reserve will be out and about this week. Right now, I am tracking at least eleven public appearances made by Fed officials over these four days. The headliner of the group, despite what I think of him as an economist, is probably New York Fed Pres. John "Lightning" Williams. The Federal Open Market Committee will also release the minutes of the last policy decision, made on May 7, this Wednesday afternoon.
- The earnings calendar is rather light this week, but there are some market-moving names reporting. On Wednesday evening, we'll hear from Nvidia NVDA and Salesforce CRM. This will be followed on Thursday morning by Best Buy BBY, and on Thursday afternoon by Dell Technologies DELL, Marvell Technology MRVL, Ulta Beauty ULTA and Zscaler ZS.
By The Way...
Nvidia, will not only release the firm's quarterly numbers this week, but also made news over the weekend. Nvidia is planning to launch a new chip under its Blackwell line for the Chinese market. This new AI-capable, but less capable than its offerings in the U.S. and elsewhere, will be priced at $6,500 to $8,000 a piece as opposed to $10,000 to $12,000 that the H20, which had previously been sold in China, had gone for.
Economics (All Times Eastern)
08:30 - Durable Goods Orders (Apr): Expecting -7.9% m/m, Last 7.5% m/m.
08:30 - ex-Transportation (Apr): Expecting -0.1% m/m, Last -0.4%.
08:30 - ex-Defense (Apr): Expecting -8.1% m/m, 8.9% m/m.
08:30 - Core Capital Goods Orders (Apr): Expecting 0.0% m/m, -0.2% m/m.
09:00 - Case-Shiller HPI (Mar): Expecting 4.4% y/y, Last 4.5% y/y.
09:00 - FHFA HPI (Mar): Expecting 0.2% m/m, Last 0.1% m/m.
10:00 - CB Consumer Confidence (May): Expecting 87.5, Last 86.0.
10:00 - Dallas Fed Manufacturing Index (May): Expecting -25, Last -35.8.
The Fed (All Times Eastern)
04:00 - Speaker: Minneapolis Fed Pres. Neel Kashkari.
09:30 - Speaker: Richmond Fed Pres. Tom Barkin.
8:00 p.m. - Speaker: New York Fed Pres. John Williams.
Today's Earnings Highlights (Consensus EPS Expectations)
Before the Open: AZO (37.27)
After the Close: BOX (.26), OKTA (.77)
At the time of publication, Guilfoyle was long NVDA equity.
