The 'Fever' Breaks, But Let's Take the Temperature of the Market
While the speculative trade fever broke, its effects are clear. We look at what's next, how Amazon and Meta have fared, and two 'cliff dives' on the charts.
You've reached your free article limit
You've read 0 of 1 free Pro articles.
For most of the time since the April low the market has taught us to look for spots to buy individual stocks. I would say the index, but as we already know the indexes don’t go down!
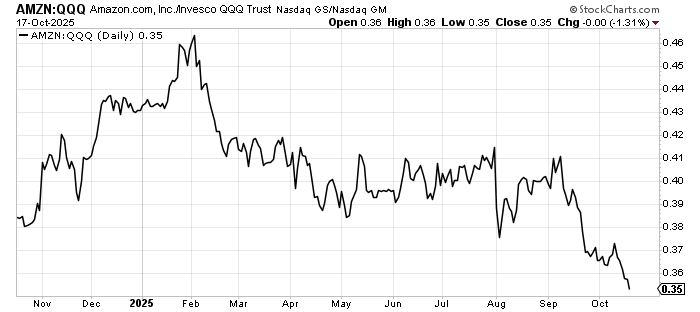
So for example, when Amazon (AMZN) gapped down in early August, the immediate reaction was to buy the dip. That worked out great — for a month — but then it began coming back down. Not only did it come back down, one would have thought, heck, every dip gets bought so I should buy that dip to $216. But it bounced and then went plop, right back down to the August low.
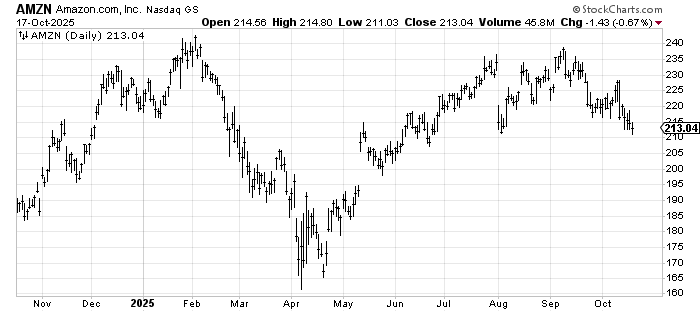
Then you step back and say, wait a minute, Amazon never made it to the early 2025 high. Then you step further back and look at how Amazon has fared relative to the S&P 500. The answer is very poorly. On a relative basis it is where it was a year ago. But home in for a minute at the action since early September. You’d think Amazon was an energy stock, or heck, a staple! Or a drug stock before they rallied.
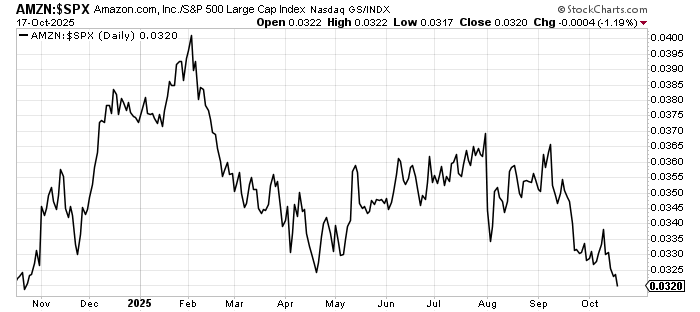
And then you discover it’s even worse relative to the (QQQ) s. I mean, it’s lower than where it was a year ago, and by a decent amount too. Once again, look at the underperformance since September.
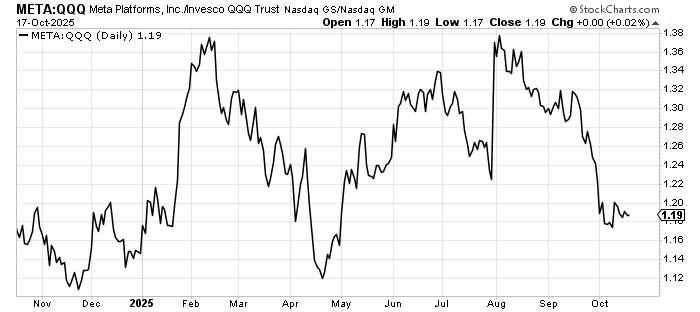
Meta (META) is not nearly that bad on the year over year, even if it is getting closer to the lows of a year ago (on a relative basis vs. the QQQ). But once again, look at that dive since September. Well okay since August, but at least August looked like a gradual pullback at first. September looks like a cliff dive.
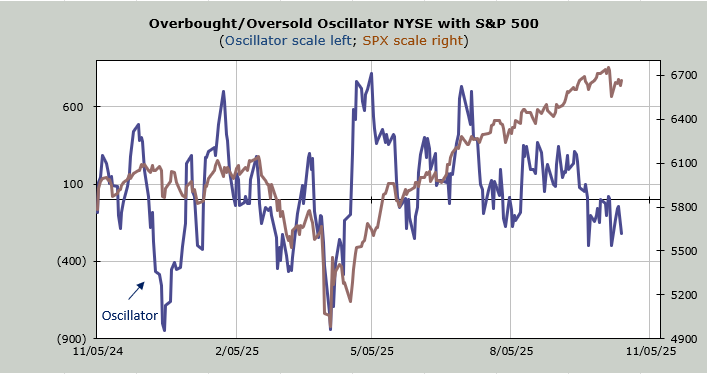
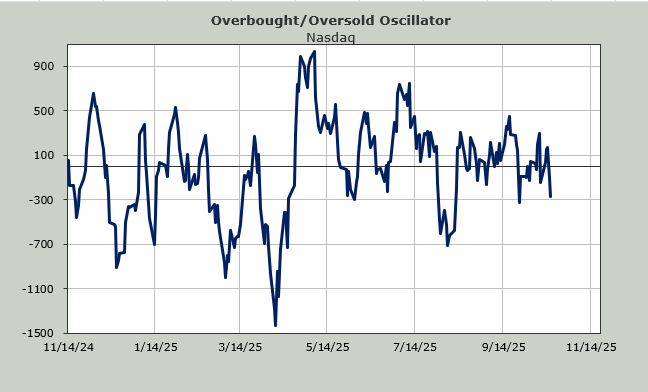
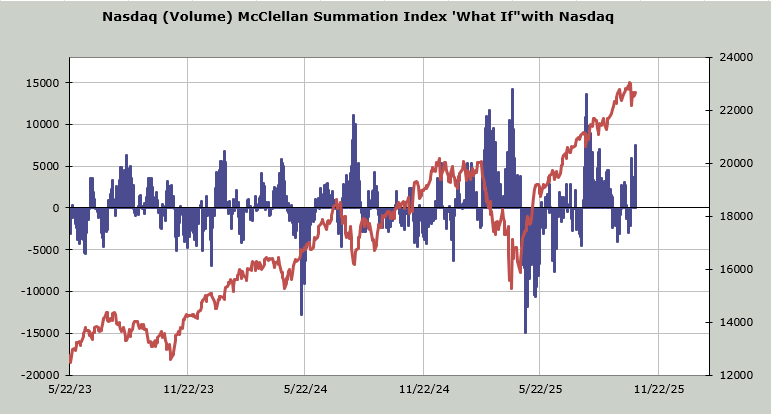
I maintain that this is about the move toward speculative stocks in the last six weeks. I have discussed the McClellan Summation Index’s fall since July, but that’s the NYSE. Now let’s look at the Nasdaq, using volume instead of the advance/decline line. You can see the cliff dive in August, the pathetic rebound in September and now the rolling back over.
This indicator now needs a net differential of +7.5 billion shares (up minus down volume) to halt the decline. My estimation is that the Nasdaq would need up volume to be approximately 70% to the upside for two straight days to get that.
That makes it a little bit oversold (extremely oversold would be over 10 billion), but what it really tells us is what this last leg up in the S&P and Nasdaq has brought us.
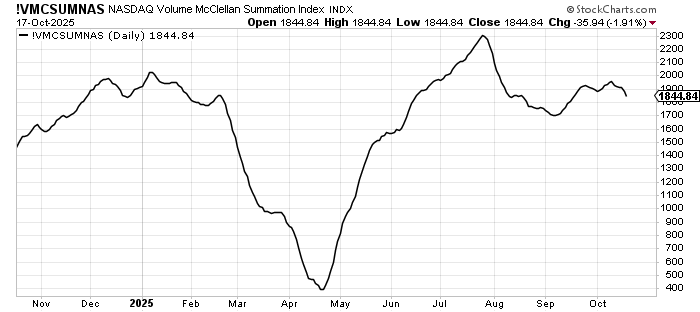
So sure, we’re a little oversold. If the market is down Monday we’d be "quite oversold" by Tuesday. The equity put/call ratio on Friday was 0.72, which is the highest since the last days of August and the VIX made a new high and reversed hard on Friday. All reasons for a short-term rally this week.
However, now consider that Friday saw the speculative trade fever break. Gold finally backed off, as did all the other metals. The quantum stocks were down. Bitcoin already had its shakeout a week ago. Even the Utes finally eased up on Friday.
But will the so called quality (Mag 7-type names) rally? Or are those ratio trends telling us something more?