Sure the Market's Down, but Do You Know What Most Stocks Are Doing?
Read on for a deeper look at breadth and the oscillators.
You've reached your free article limit
You've read 0 of 1 free Pro articles.
Do you feel better about the market after Friday’s rally? If you do then you are not alone. You see the equity put/call ratio which got all the way up to .80 after Thursday’s action, showing some fear had finally crept in, sunk right back to .45 on Friday, showing folks are eager to put December behind them and believe in more upside.
That reading of .80 was the highest since that early September rout. Take a look at September on the ten day moving average of the equity put/call ratio. It was in many ways an extension or retest of the August rout. In August the ten day moving average got to .72 and in September it tagged .70. That’s what fear looks like.
Now? Even after the super ugly December in most stocks and the five straight days of losses in the S&P to end the year, the ten day moving average is at .56. Heck, folks were more loaded up on puts prior to the election than they are now.
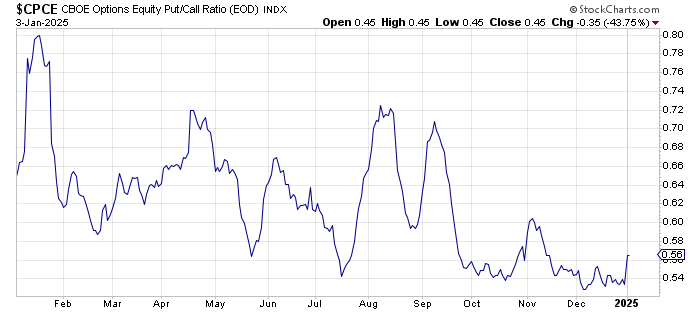
Can we see the market pullback again? Sure. In fact it would be bullish if it did. That put/call ratio moving average has finally started to move so a pullback might see some put buying and push that moving average upward into what I would term ‘fear’ territory.
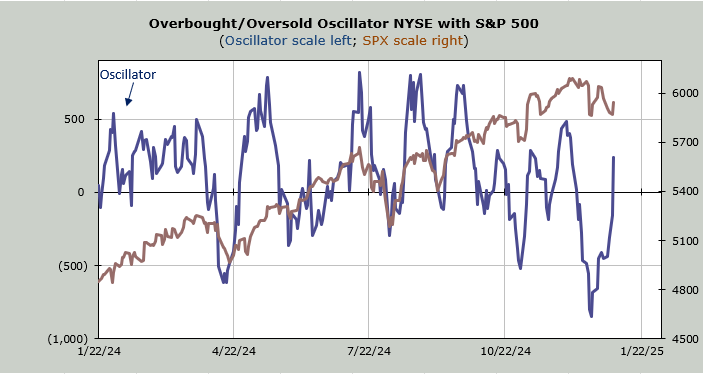
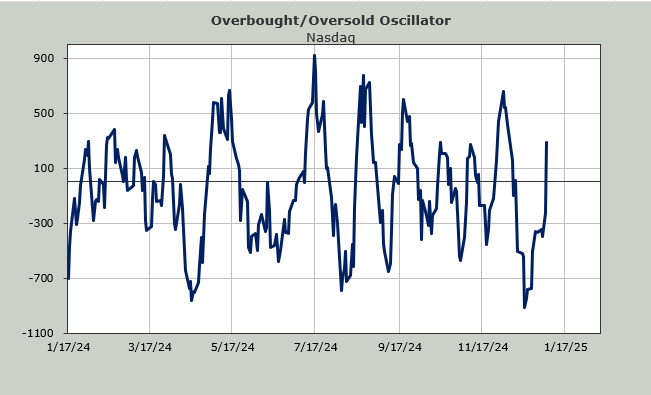
I know folks will gasp when they see the Overbought/Oversold Oscillator because they will not understand how it is up so much. Let me remind you what we noted last week: the majority of stocks stopped going down at the FOMC Meeting and have been sideways to up since. They lost their downside momentum (the definition of oversold) so we finally got an up day and this indicator shoots upward.
You might recall my noting when referring to my (bad) call about a Santa Rally that I expected it to last until the second week of January. That was the math behind this indicator. Let me remind you that breadth has been positive for seven of the last ten trading days. I’ll bet you are shocked to learn that.
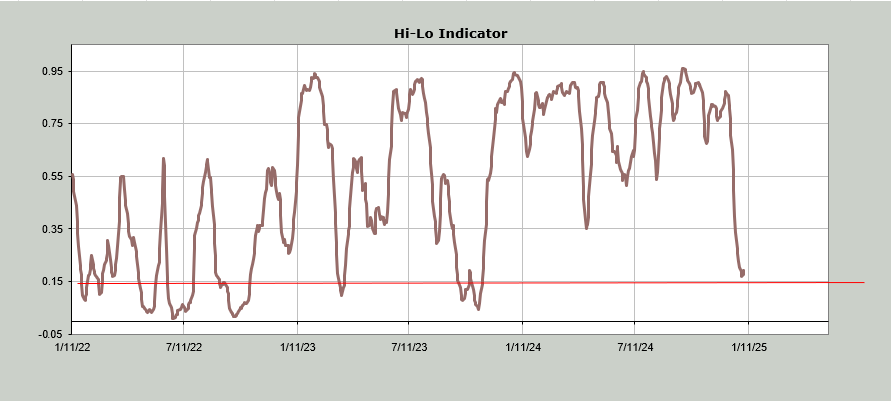
If we were to get a market pullback this coming week (due to getting short term overbought so quickly and the fast return to bullishness) the HiLo Indicator should finally get seriously oversold instead of just hovering over it.
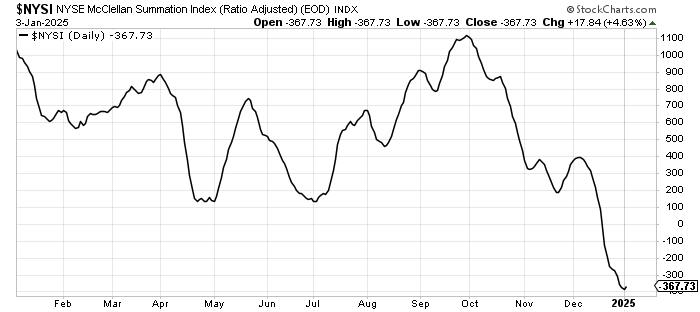
The McClellan Summation Index did finally stop going down on Friday. You need a high powered microscope to see it though. It took breadth being positive for so many days to do it, but it is a step in the right direction. It won’t take much to turn it back down but it is my view that any push back down from here ought to get sentiment bearish and then maybe, just maybe, folks wouldn’t trust any rally. And isn’t a Wall of Worry better than a quick return to belief?