Someday, the Indicators Will Change. For Now, There's Much to Watch.
Here's what I'm paying attention to.
You've reached your free article limit
You've read 0 of 1 free Pro articles.
One day, hopefully in the not-too-distant future, I will begin this missive by telling you something has changed with regard to the indicators. Today, however, is not that day.
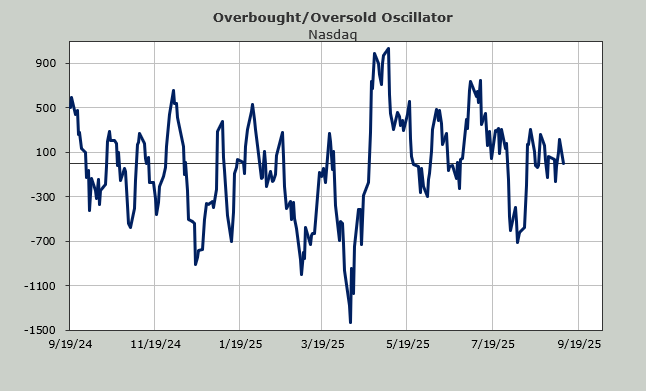
Just take a look at the Overbought/Oversold Oscillator. For a month, it has moved back and forth between +100 and +300. Now look at the rest of the chart: you simply do not see that. For the entire year prior to now, it has done what it is supposed to do: Oscillate.
Notice it got oversold in July, and it spurted upwards and then has just sat there since. I’d love to tell you the math shows it’s overbought or oversold, but even though the next ten days show us dropping green numbers for seven of the ten days (it’s a moving average), it’s hard to say it’s overbought when the numbers it is dropping are +160, -56, +101. I mean, those are truly nothing numbers.
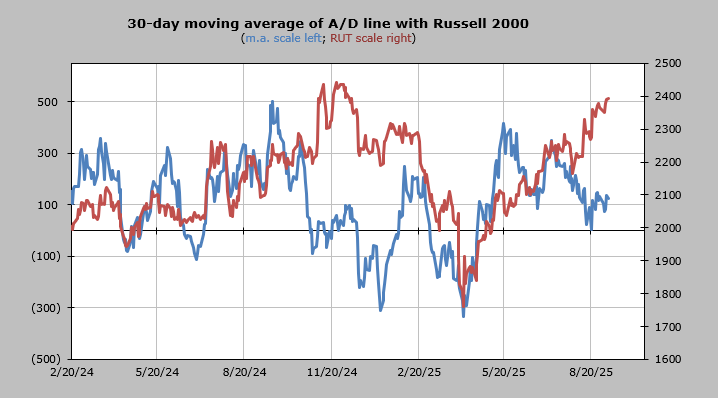
Then I look at the more intermediate-term Oscillator, where I use the 30-day moving average of the advance/decline line. It got a little oversold just before my vacation (remember all those down days in a row?), but considering how far down it had come—to the zero line—the indicator popped and stalled.
Over the rest of the week, it will drop some red numbers, so I suppose we can say it is a little bit oversold. In a few days, it will go back to dropping positive numbers, so it’s hard to believe there will be a lot of follow-through.
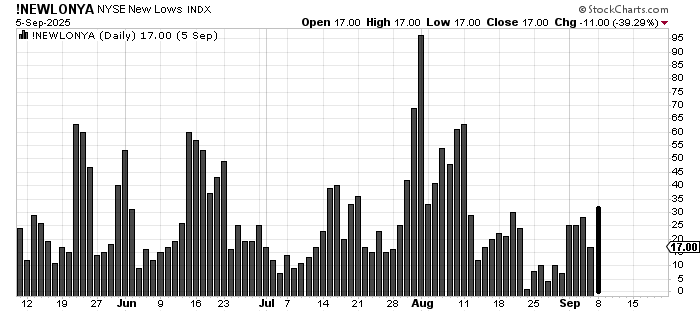
We’ve discussed the new highs that don’t seem to increase much, but how about the new lows? They increased a bit on Monday, to the largest number since early August. I’ve got my eye on this, but mostly this is in the range it has been in for a month now. There is no trend.
We discussed some sentiment measures the other day, but even the Daily Sentiment Index (DSI) feels as if it hardly moves these days. The S&P is at 73, which is neutral. Nasdaq is at 75, also neutral.
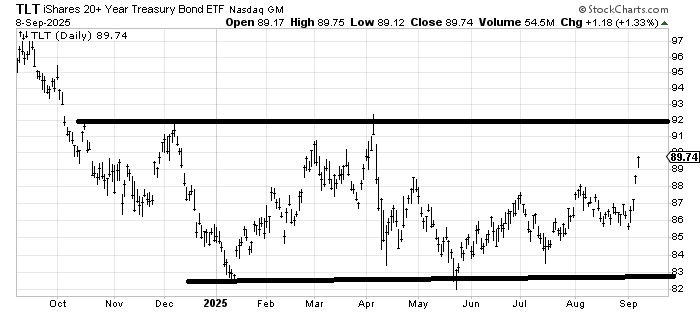
Wait, maybe bonds with that big move show a high DSI. No, not bonds either. That DSI is at 76. Perhaps folks don’t want to go ‘all in’ on the bonds because we get inflation data later this week. But my view has been that TLT should stay in the range that has been in place for a while, which means I think TLT’s top end is around 92-ish. It is possible that a further move toward 92 in TLT will coincide with a DSI that moves into the mid to upper 80s. But so far, it hasn’t changed.
Speaking of the DSI, Gold’s DSI is back to 87. The measured target on GLD (for now) is 340-ish. I feel pretty confident that if GLD can get to 340, the DSI will tag 89 or 90 on such a move, and that would be a reason for some profit-taking in the precious metal.