Software Stock Investors Are Discouraged. Is a Wall of Worry Next?
I've fielded many questions on this market segment. It's a good time to look at the bottoming process to see what could be next.
You've reached your free article limit
You've read 0 of 1 free Pro articles.
 NYSE Trader
Note: I am taking tomorrow off, so my next column will be Monday morning, March 30th.
I’ve fielded so many questions on software and software stocks lately that I think I will begin by addressing this group.
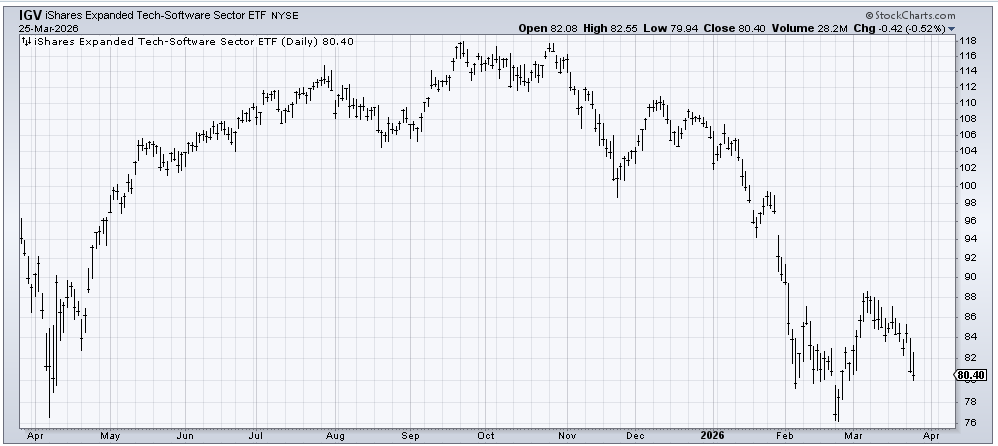
Let me begin by reminding you that when IGV (and all the stocks) began topping out a few months ago, I used this chart of the Sentiment Cycle to explain to you where I thought we were. We have since come down to what I thought of as Panic (in February).
But I noted that I thought that whole process of sorting out the stocks—some will thrive, some will merely survive, others will not—was a process, and that process takes a long time. I suspect we are heading into discouragement now.
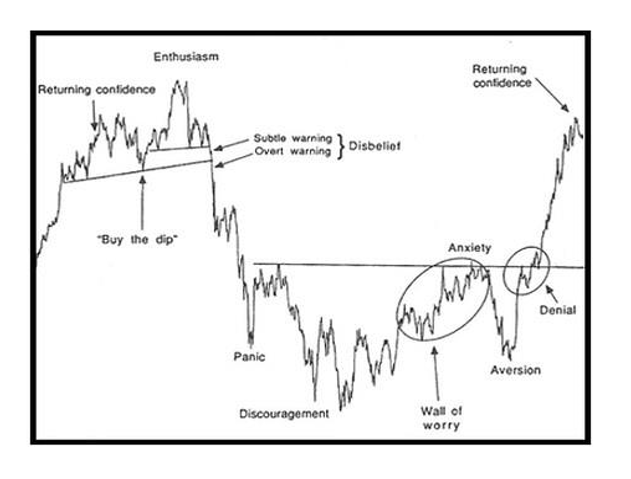
I doubt it will continue to map out so perfectly with this sentiment chart, so I am simply using it as a generalization to show you that the V bottoms everyone seems to believe are a given are not always so.
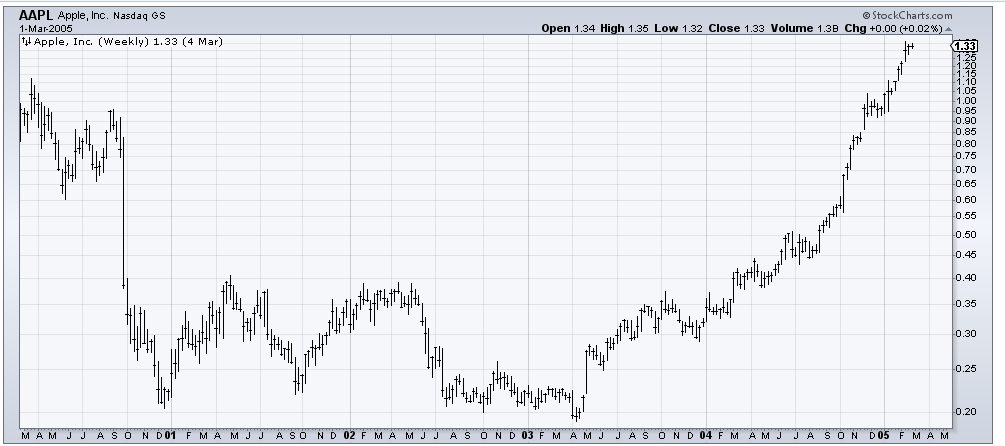
Tech stocks did not always end their corrections in a V bottom. In the time after the Dot Com blowup, a lot of tech stocks took years of sideways action to build bases. Apple wasn’t even a serious darling of the late 90s (not the way it became in the 2010s), and still it took years to base. This is a weekly chart, but you can see how many ups and downs there were before it was finally able to emerge.
I don’t know if software will take years to base, but I do know bases should be built in order to lead to a longer-lasting rally. That having been said, IGV is down ten percent in the last two weeks and has some support in this 80 area, so I would expect a bounce in the next few days.
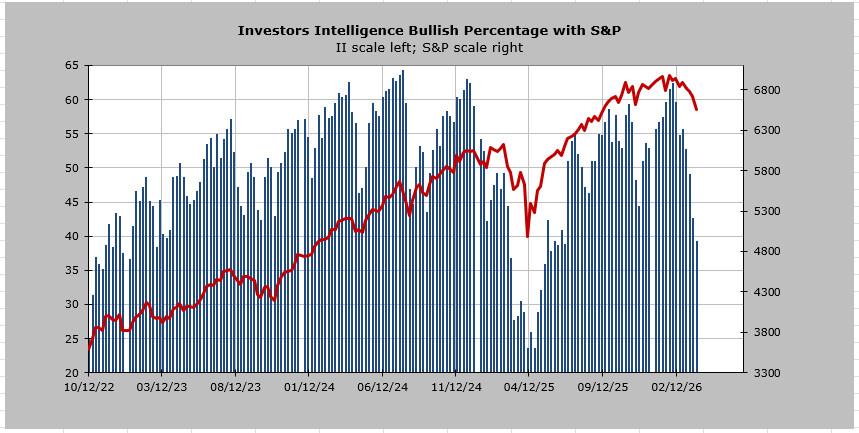
Speaking of sentiment, the Investors Intelligence bulls slipped a bit further and are now at 39%. This is the lowest reading since last May and June. The panic low saw bulls at 23%, but at least you can see how this is no longer complacent and on its way toward ‘bearish’.
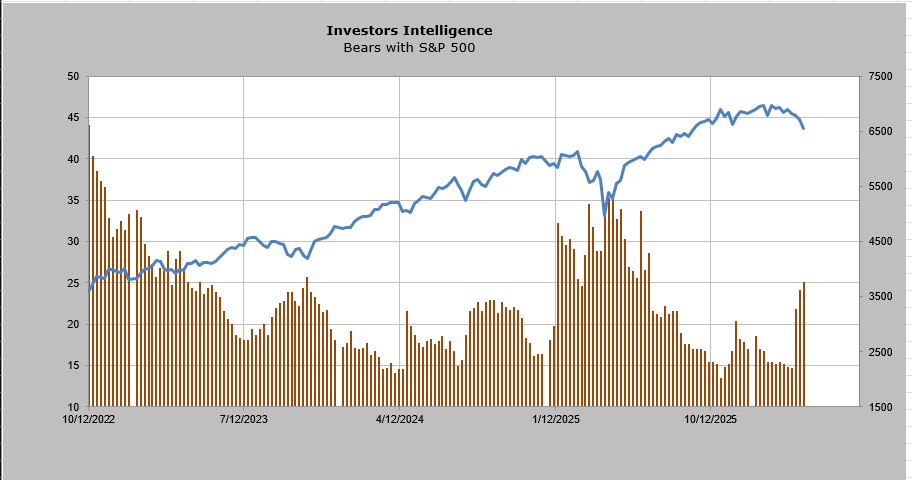
The bears are up to 25%, and that is also similar to May and June, with the peak reading over 35% (and far more bears than bulls) in April at the lows.
Thus far, the Russell 2000 has been the place to be for this oversold rally. It has now rallied for four straight days. I highlight this because it hasn’t gone to five days since coming off the November low.
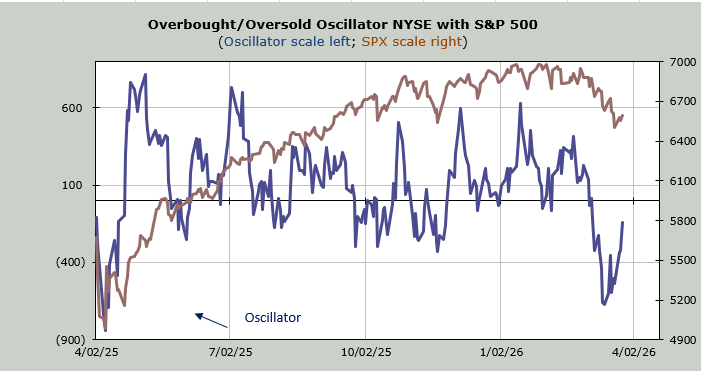
My own Overbought/Oversold Oscillator has been moving up, and you can now see it approaching the zero line. I expect –especially if we get one or two more days of this rallying in the Russell/493 it will be back to short-term overbought by Friday.
Related: This $30 Million Meme Stock Surges 400% as Speculative Action Returns
