Should Consumer Staples Be This Strong in an Up Market?
In the past, people bought Staples because a recession was coming. But now? What's changed?
You've reached your free article limit
You've read 0 of 1 free Pro articles.
Before we get to the market as a whole, I want to ask you to look at a chart. I’ve taken the liberty of drawing a flat line across the tops. There was that breakout attempt in late February, but mostly this is a chart that has gone sideways for the last nine months.
It never broke to a lower low in April (vs. January) and is once again nearing that flat line. Would you buy it? It’s not bad, right?
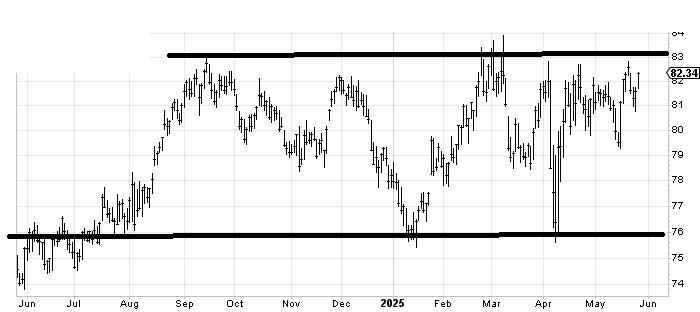
The reason the chart strikes me is because it is the chart of XLP. The Staples. It’s such an odd group to gain traction in a market where it seems everything is about technology, AI, and all those other esoteric speculative groups like nuclear and quantum computing. There was a time that people bought staples because they thought a recession was coming. I have no idea if that is still true.
I am not an economist. I don’t even play one on TV, but this is the chart to watch because I’m not certain anyone has any interest in the staples, and yet, here we are, on the verge of a breakout.
As for Tuesday’s market, sure, I thought the SOX would have a rally, owing to the fact that it was hard to find a time where it had gone eight straight red days, and it came into the week with a seven-day losing streak. What I did not think was that we would see the S&P tack on over one hundred points. But that’s what the market delivered to us.
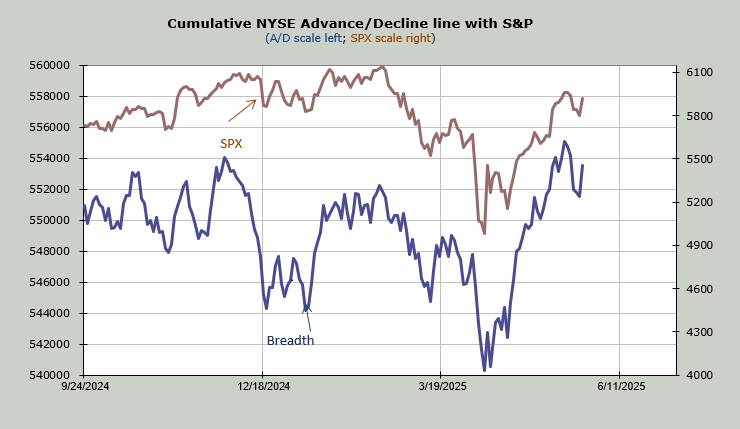
Now we watch breadth. It was fine on Tuesday. But recall back in April, I showed this chart of breadth on a regular basis, noting that it was outperforming. It did not outperform on Tuesday. The blue line is breadth, and the brown line is the S&P. If the S&P makes a higher high and breadth does not, we will have our first minor divergence.
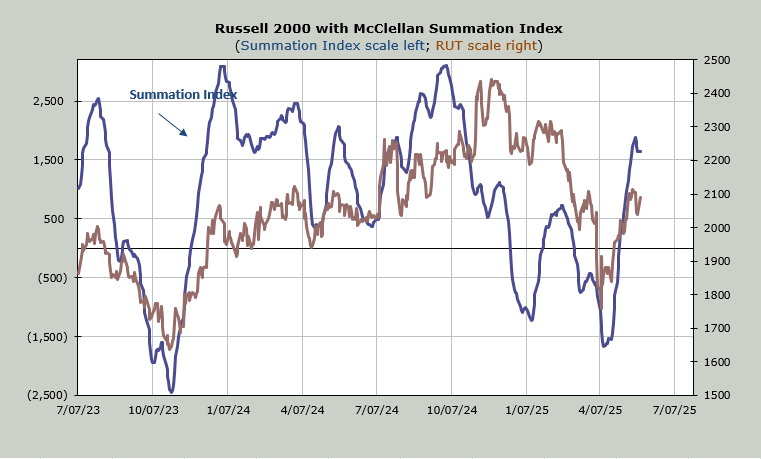
The breadth was good enough to get the McClellan Summation Index to stop going down, but not good enough to get it to turn back up.
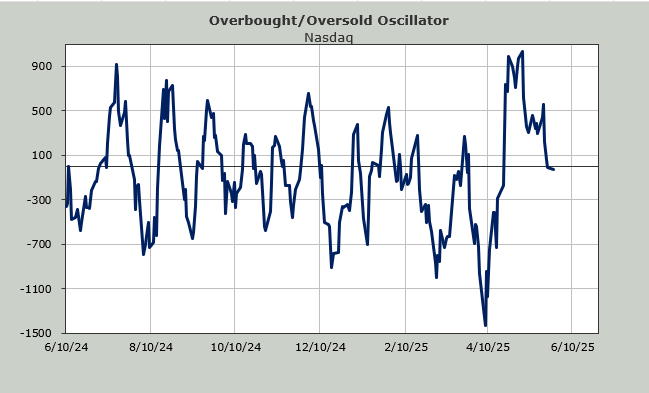
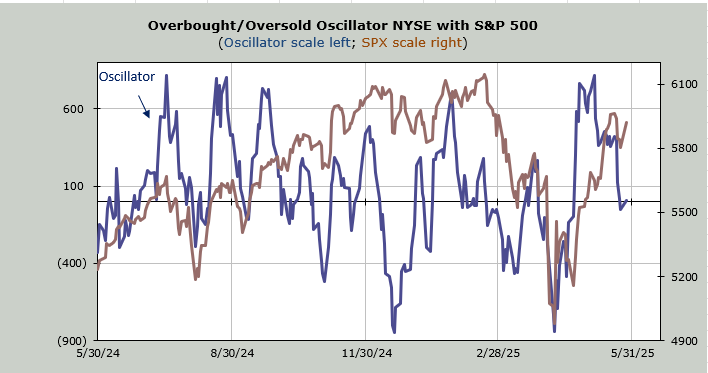
Breadth was good enough to get the Overbought/Oversold Oscillator to barely tick back over the zero line, but it was not good enough to get enough traction to push it over the zero line.
The NYSE had 96 stocks making new highs, which is a minor uptick from the reading of 90 we had two weeks ago. Nasdaq fell short of its reading of a few weeks ago with 167 on Tuesday vs. 169 in mid-May. In both cases, it was not enough to turn the Hi-Lo Indicators back up.
Anecdotally, the sentiment changed, but I did not see it in the statistics. For example, the put/call ratio was .88; in mid-May, it was in the upper 60s.
This means the indicators did not change. And I continue to expect the next few weeks will bring us volatility.