Short-Term Overbought While Bulls Surge
Stocks are short-term overbought and nearly due for a breather.
You've reached your free article limit
You've read 0 of 1 free Pro articles.
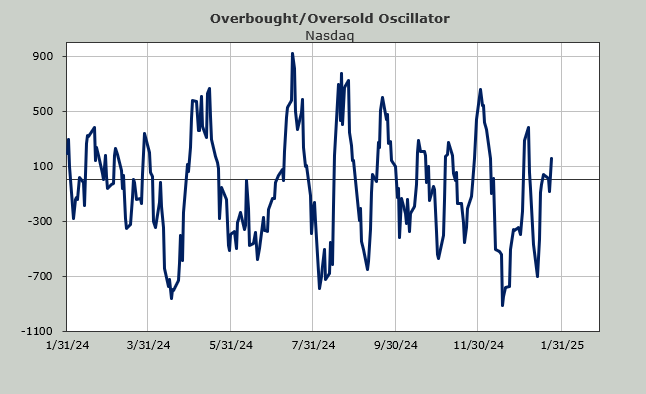
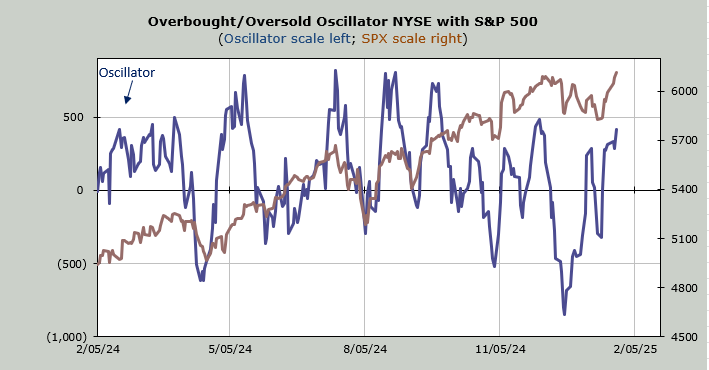
We came into the week with many thinking the market was overbought yet the S&P has run about 120 points this week. We are slowly seeing sentiment shift along with it. But first let’s talk about the Overbought/Oversold Oscillator
As you know I look back ten days ago to see what numbers we are dropping from breadth. It’s not an exact science as you know since we jumped the gun and rallied a few days earlier than the numbers implied but now we look at the Oscillator and see it is nearing the top of the page.
For the next two trading days we will drop two more red breadth days and then I would say the short-term is overbought using this indicator. If the market doesn’t collapse in the next two trading days, it is possible that the Oscillator will get back to levels we saw last summer (all those readings over 500). If breadth can’t get going in the next two trading days then it is likely to fall short of that 500 level.
Why is that important? Because a lower high in the Oscillator means lower momentum and a higher high (over 500, because that’s where we were in December) implies momentum is overextended but not failing. Either way, using this indicator we are getting short-term overbought.
Then there is sentiment. While the Investors Intelligence bulls barely budged this week (up 2), the day traders at the American Association of Individual Investors (AAII) saw the bulls jump 18 points to 43%. On its own, 43% isn’t that high (we were at 50% in December). So I looked back to see other times we had jumped 18 points or more. Going back to 2006 I found seven times we had that sort of a surge.
The dates are interesting because even if the market didn’t keep on rallying immediately, overall it headed higher five of those seven times. Twice it did not. In January 2009 the market plunged into that final low in March of 2009, but the percentage loss was high.
In July 2010 we were coming off the Flash Crash (May 2010), when the bulls jumped. The market hung around on the upside about a week and then we plunged into late August. So, those two times the 18 point jump was not bullish.
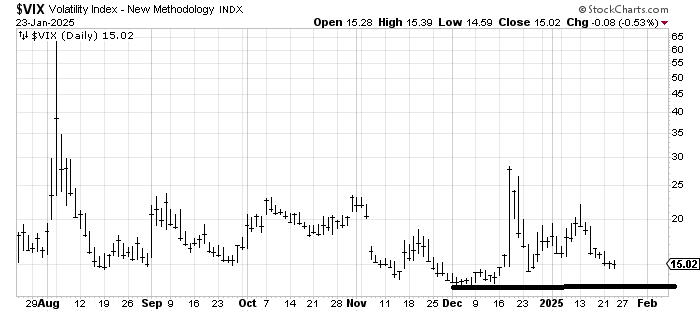
Then there is the put/call ratio for the VIX. What caught my eye is that on Wednesday it fell to .19. We haven’t had a reading under .20 since September. As a reminder, VIX options are often used by pros so we do not view this reading as contrarian. This means there are a lot of bets on a higher VIX.
In late August and early September we had two readings a week apart and the very next day the S&P lost about one hundred points each time. In late May it was more meandering but the S&P lobbed off 65 points over a few days and in late June it was a quick 20 points on the downside before we rallied again.
If we look at the VIX we see that it is at a higher low (vs December). So if we couple the upcoming short term overbought reading with the low put/call ratio for the VIX and the higher low in the VIX I would not be surprised to see a bout of volatility next week.