Semiconductors Have Lagged for a Year. Can Nvidia Help Them Break Out?
The market is intermediate-term overbought, but the indicators aren't giving outright buy or sell suggestions yet.
You've reached your free article limit
You've read 0 of 1 free Pro articles.
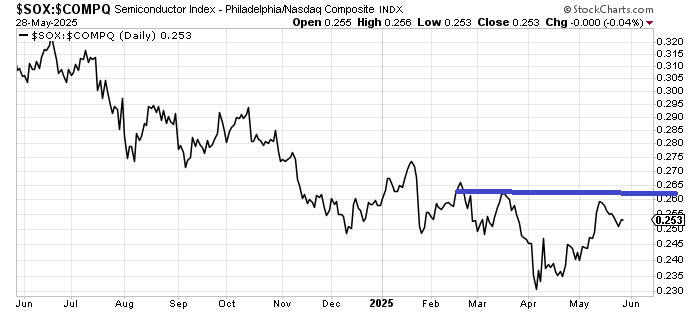
Can NVIDIA change the relationship the SOX has had with Nasdaq for more than a year? When we look at the ratio of the SOX to Nasdaq, we see a downtrend. There hasn’t been a higher high on a relative basis in more than a year. I would say the NVDA earnings after the bell on Wednesday will surely test this.
As an aside, I do so love the folks who tell us as long as the semis are outperforming the market is in good shape, and yet they have been bullish for the last year. Do they not see the same chart I do? Or do they just ignore it when it doesn’t fit their market view?
What would change the downtrend, or at least start the process, would be a higher high, getting this ratio up and over that area where I have drawn the blue line.
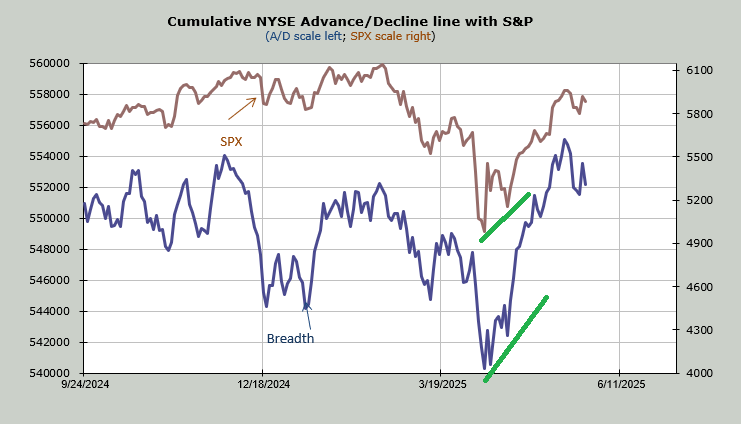
However, rather than focus on just one area of the market, let’s talk about market breadth. I have become quite focused on breadth because it has been weakening. It made a higher high in mid-May (bullish), but in the last few weeks, you can see how breadth has really tailed off. It is most obvious from Wednesday’s trading, where you can see the blue line (breadth) is now pennies away from last Friday’s low, but the S&P is far away from its low last Friday.
At the low in April, I showed this chart several times, noting that breadth was outperforming the S&P (green lines). This is one reason I am watching breadth so closely now. Bulls do not want to see it falter much more.
We have seen the McClellan Summation Index turn down. It’s not in a full-blown downtrend yet, but it takes an awful lot to turn this down and keep it down, which is why I’m watching it so closely.
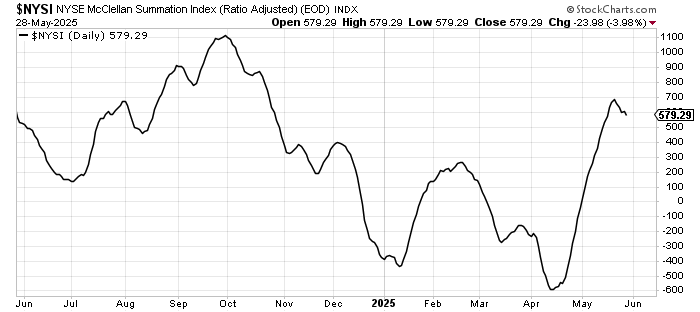
Notice how smooth this indicator line is compared to the gyrations we get in both breadth and the indexes. It now needs a net differential of +1300 advancers minus decliners on the NYSE to halt the decline. Tuesday’s rally did not have enough breadth to overcome the decline.
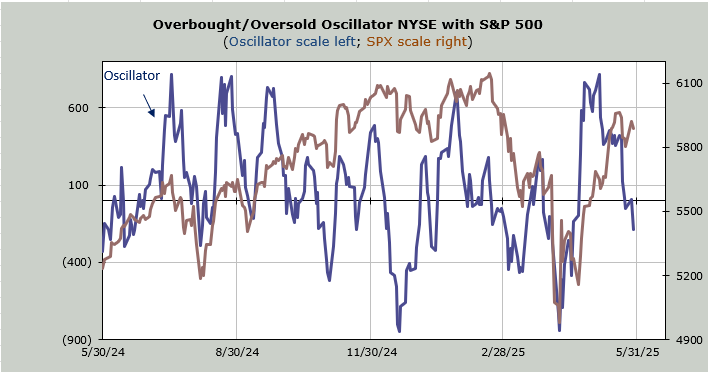
So, in addition to seeing if NVDA and its fellow SOX members can start outperforming the Nasdaq, we have to see if breadth can right itself. You see, it has been red for six of the last seven trading days. You’ll notice that is why the Overbought/Oversold Oscillator is now below the zero line. Hey, at least it is heading toward an oversold reading!
In any event, Tuesday’s action or Wednesday’s action this week has much to deter me from thinking the next several weeks should see a pick-up in volatility. Too many of the intermediate-term indicators are overbought, but we need to see some persistent weakness to look for more than volatility.