S&P Losing Steam?
Let's check the S&P's close at the same level a week ago Wednesday, but with more new lows and fewer new highs — and staying in very tight range. Will earnings push things around?
You've reached your free article limit
You've read 0 of 1 free Pro articles.
I noted yesterday that we were no longer overbought and someone questioned that view. I meant no longer short-term overbought. You can look at my Overbought/Oversold Oscillator, which isn’t based on price but on breadth, and you can see how much it has come down.

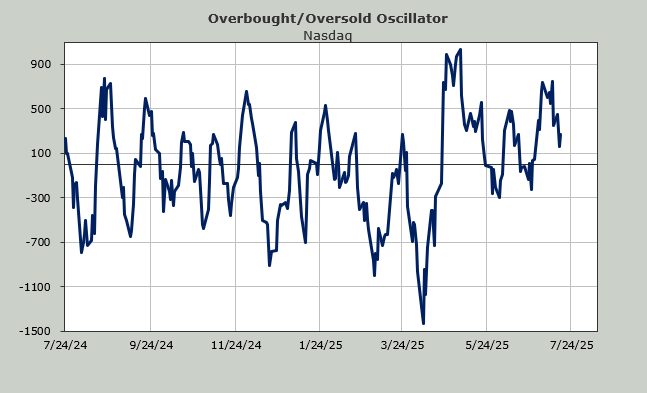
It is not oversold. But overbought and oversold are momentum indicators and for the last week or so the market has been stuck, it has lost the upside momentum. In fact on July 9, the S&P closed at 6263, the same level it closed on Wednesday. If that is not a loss of upside momentum, I don’t know what is.
For the market to actually go down, we need to see some weakness, some selling. There has been very little selling in the indexes, but in individual stocks there has. On July 9, when we last closed at 6263 there were 83 stocks making new highs on the NYSE. Now there are 48.
But it’s also that a week ago the number of stocks making new lows was a mere 11 issues. Now that number stands at 40. For most of the day on Wednesday there were actually more new lows than highs on the NYSE but that shifted late in the day to give us eight more highs than lows.
Yet the market itself doesn’t seem to want to go down. Of course as I noted a week ago, just when you think it will never go down again, it somehow manages to do so.
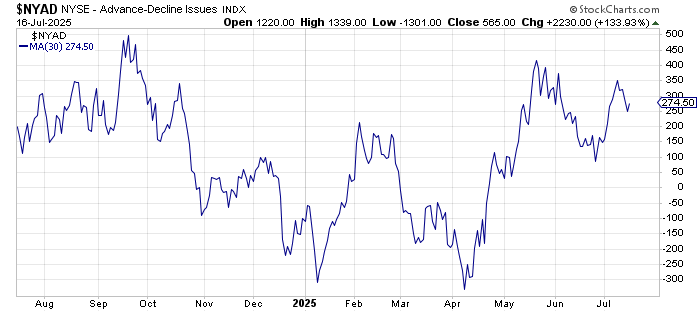
The intermediate-term is still overbought. Here you can see the 30-day moving average of the advance/decline line. It made a lower-high than May and remains well above the zero-line.
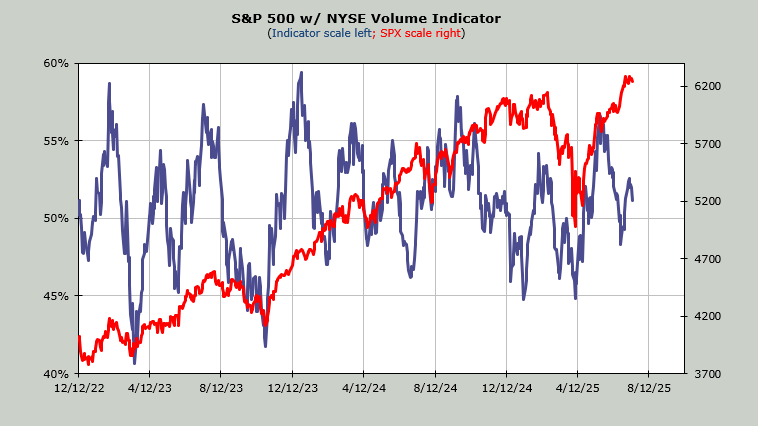
The Volume Indicator had a similar move in that it peaked in May at 56% and the highest it got this time was 52%. It now stands at 51%. To get this to an oversold condition it would have to get to (around) 47%.
Nearly two weeks ago, I drew this line on the chart of the S&P, indicating resistance. It still has not breached it. The line is rising so it now comes in just over 6300. Now look on the right side of the chart and you can see I have blown up the last couple of weeks in the market. Do you see how we have bounced off 6200 on both of the days we had a downdraft?
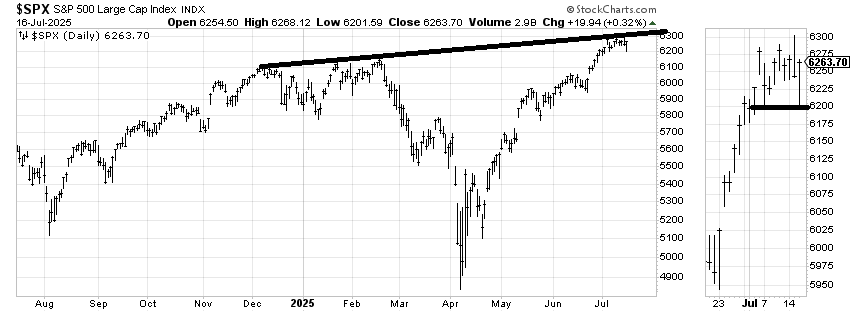
That’s a very tight range for the market to be in for this long, 6200-6300. Perhaps we will need to wait for the index movers to report their earnings and move the S&P. There is some weakness underneath but thus far not enough to get the index to break support.
