Ring in the New Year and Wring Out the Bullishness
Sure we're oversold, but sentiment remains the problem as we go sideways. But here's what will bring a great opportunity.
You've reached your free article limit
You've read 0 of 1 free Pro articles.
So that was the Santa rally? A big giant sideways?
Yes, I know most will say that the market was down the last week of the year. Well they should really say the S&P 500 was down because most stocks went sideways. The best I can tell, everything changed — or so I am told — on the day of the FOMC meeting, December 18.
But the S&P, Nasdaq — and heck— the Russell 2000 are all flat since that day. Even interest rates are pretty flat. The yield on the 10-Year Treasury ended that day at 4.5% and now stands at 4.57%. Not exactly a massive move.
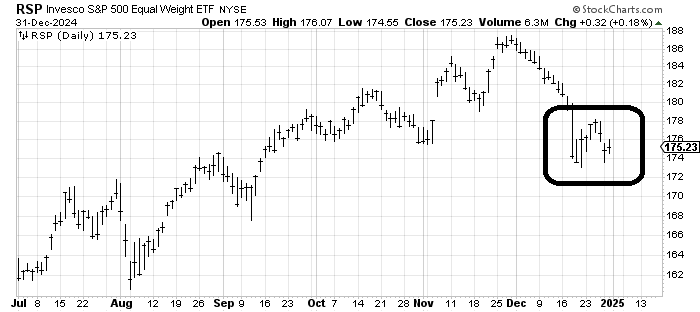
Folks like to use RSP, an equal weight ETF for the S&P, so take a look at it: It’s actually up a smidge from that FOMC meeting. The last two weeks saw a pop and drop —sideways. It made no progress up or down. So what really changed at the FOMC meeting? The realization that they might not be cutting rates as much as folks thought?
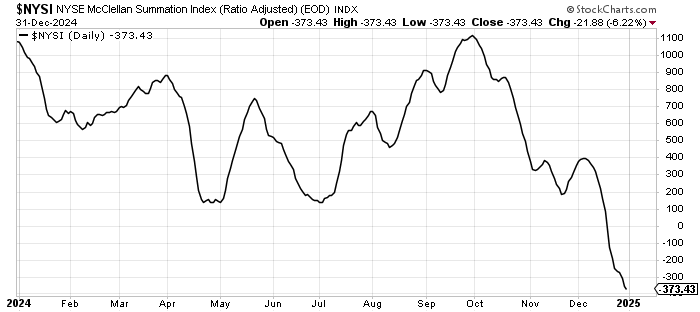
It has been my contention that the majority of stocks peaked in the early October time frame. There were some that enjoyed quite a pop after the election but they gave that up quickly. That means the downtrend in the majority of stocks did not start in December — and it certainly did not begin post the FOMC meeting. Rather it started nearly three months ago. We see that in the McClellan Summation Index; most stocks are well into their declines.
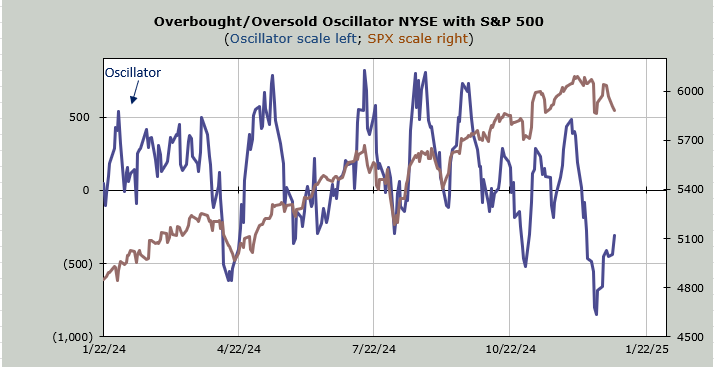
Despite the oversold condition in the market giving us nothing but a respite from the decline and this indicator continuing to head down, instead of needing a net differential of +3,500 advancers minus decliners on the NYSE, it now needs +1,000 so a decent day of breadth could finally halt the decline.
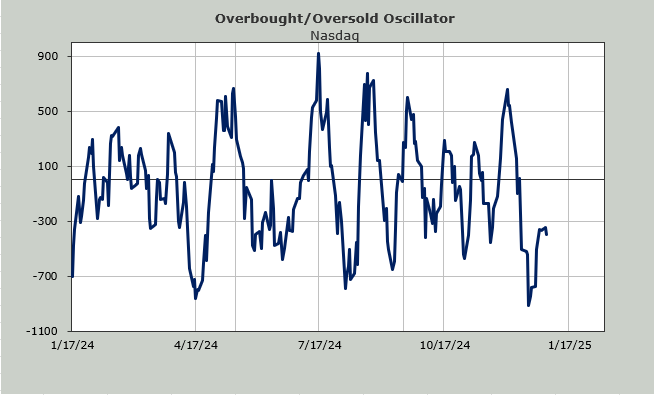
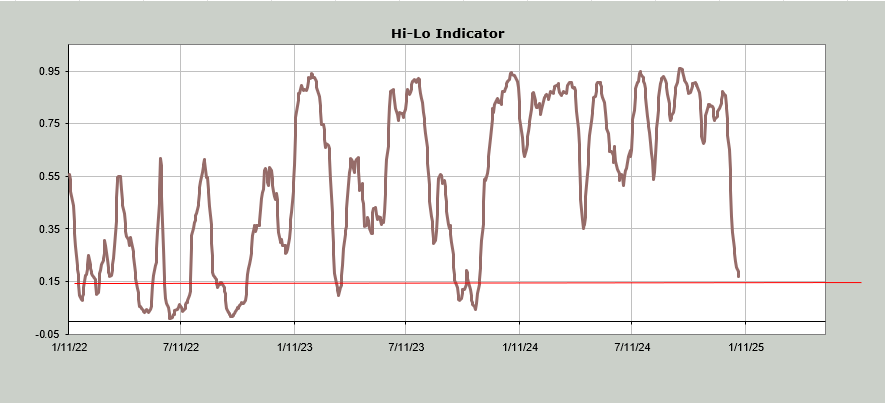
The NYSE’s HiLo Indicator is now at 0.17. Under 0.15 and it gets oversold. The Nasdaq’s is still at 0.33, though. We already know the Volume Indicator is oversold (not shown)
Thus far we are using up the short-term oversold condition by going sideways (see that chart of the RSP above). The intermediate term is pushing toward an oversold condition. The problem (for me) remains sentiment. There is still too much bullishness for my taste.
Here’s the perfect example. Typically, after we’ve seen four straight red days for the S&P, when the S&P loses nearly 3% in a few trading days, we would see the put/call ratio jump. But on Tuesday the equity put/call ratio sunk to 0.46, the lowest reading since the FOMC meeting. But there is another place we see it. In Nasdaq volume. I have discussed the speculative fever in the market for nearly two months now but it’s not just in crypto.
I like to use Nasdaq volume as a sign of speculation. Would it surprise you to know that despite the whack in Nasdaq over the last week or so net volume (up minus down) on Nasdaq has not been red one day? Not one.
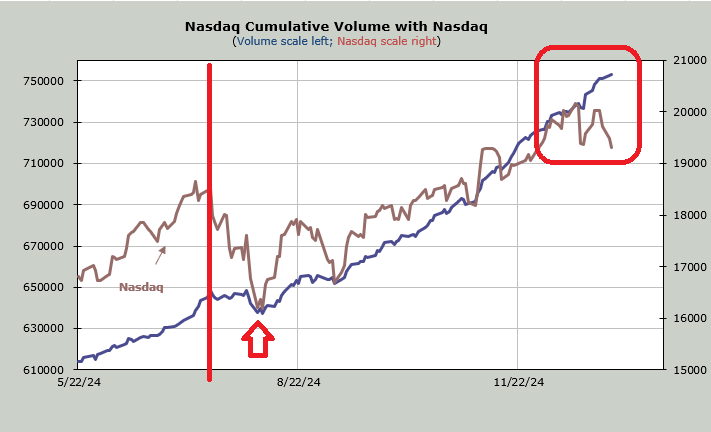
On the chart below I show the cumulative volume in blue (constructed the same way I would cumulative breadth, or the advance/decline line) with the Nasdaq (brown). Look at July (left side of the chart). The speculation eased as the index began to come down (red line), but in early August even the speculators were shaken out (red arrow) as the volume fell in that last whoosh.
But look at the present day (red box). There has been no easing whatsoever in volume while Nasdaq has taken a spill. At least in July it went sideways but now it continues to rise.
Can we rally the first few days of 2025? We could/should if only because I had originally thought we should see the rally through the end of this week. But I maintain that this bullishness needs to be wrung out. Get it wrung out with an oversold market and we should have a great trading opportunity.