Recent Selling Doesn't Feel Extreme, but the Indicators Tell a Different Story
Let's examine key breadth indicators to see what the rank-and-file stocks are doing and whether this could be a turning point.
You've reached your free article limit
You've read 0 of 1 free Pro articles.
There was a time, before we had social media, that charts were not shared as readily as they are today. But today we see all sorts of charts shared, and some really catch your eye. Of course, one of my pet peeves is when someone shows a chart and says look at that move in (fill in the blank) and the chart is some intraday chart, and the move only looks dramatic because it’s an intraday chart.
Well, today I have a chart to share with you that is not an intraday chart, but is eye-catching as if it were one of those intraday charts.
For the last few days, we’ve been discussing Nasdaq’s volume. First, it was those incredibly high-volume days thanks to all those penny stocks. Then it was the string of high-volume days (again, thanks to the penny stock craze). Typically, on Fed days, we see volume rise because the days tend to be volatile. For example, the NYSE had its highest volume in a week on Wednesday. But Nasdaq had its lowest in nearly two weeks.
I believe it is because the penny stock traders took the day off. If we see a day with Nasdaq’s volume over ten billion shares it’s usually due to penny stocks. Wednesday was the first sub-10 billion share day in eight trading days. It was also the first time since February that we saw net volume (up minus down) on Nasdaq red for three straight days.
I did not think there was that much selling taking place under the hood. Sure the number of stocks making new lows on Nasdaq has been over 100 for two days now but while the charts feel droopy and several have had big gaps down, the selling doesn’t feel extreme. It certainly doesn’t have charts similar to March and April.
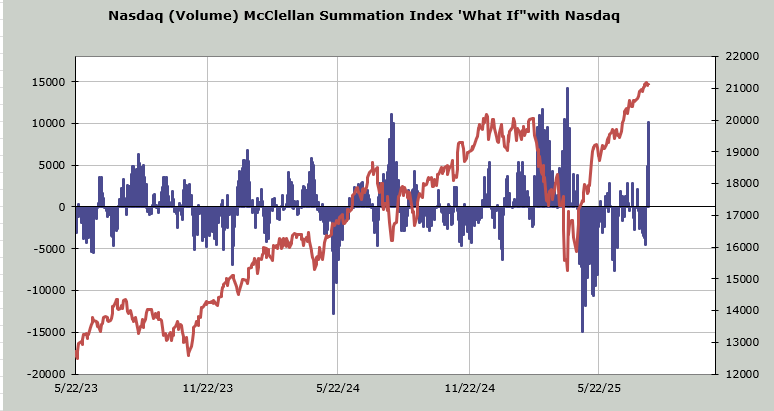
I calculate the McClellan Summation Index for Nasdaq using volume. It has been straight up but it did turn lower this week, by a smidge. Yet take a look at what three down days (for volume) has done here. This indicator now needs a net differential of +11 billion shares (that’s up minus down volume) to halt the decline. That is extreme.
It is so extreme it is closing in on what it needed on March 3rd (+12 billion shares) and April 8th (+15 billion shares). What the chart is saying is that the majority of Nasdaq stocks are short term oversold.
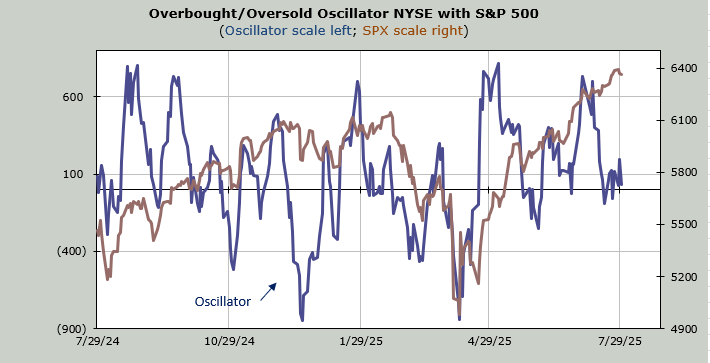
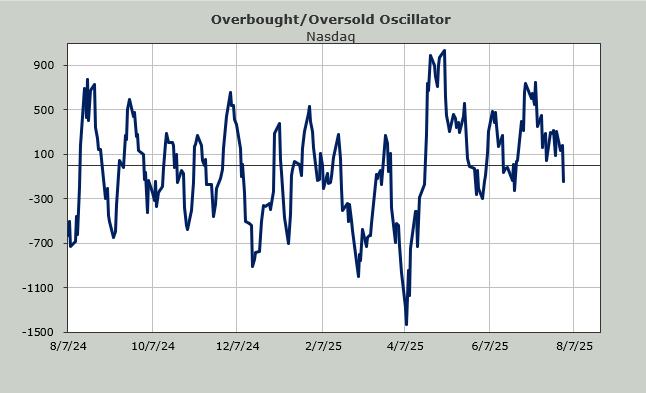
While I am skeptical of this, I really do hate to rationalize an indicator. Especially when the Overbought/Oversold Oscillator for Nasdaq is now back below the zero line. The math here does not say ‘oversold’. Rather it says there has been weakness under the hood.
It seems that Meta and Microsoft will drag the market indexes higher on Thursday. Let’s see if they have any coattails to drag other stocks up with them. If not I fear we’re going to set up for a narrow market that lifts the indexes and leaves the rest behind.