Rangebound, With Lots of Chop
Stocks are anything but trending right now. It's just a chopfest. Let's look at the indicators to see when we might get to overbought again.
You've reached your free article limit
You've read 0 of 1 free Pro articles.
The every-other-day market continues. Oh, maybe we can just call it chop. I really did think we were going to make a try for a breakout on Thursday, but once again, it stayed in the range.
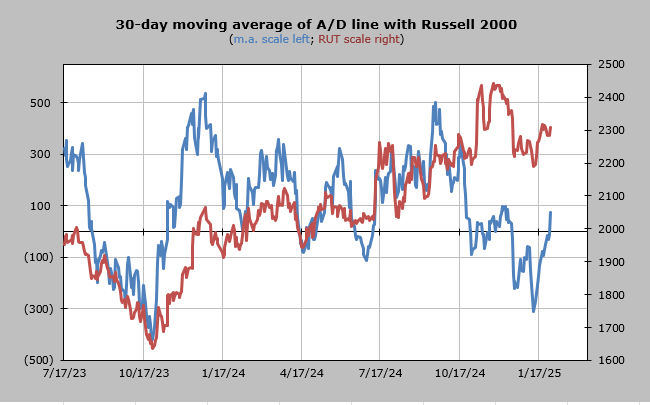
We have discussed the short-term overbought condition and how I expected a chop from it, and that’s what we have had, but let’s talk about the intermediate-term oscillator where I use the 30-day moving average of the advance/decline line. It finally (!!) crossed over the zero line. I have earmarked early February for a period when it ought to get to an overbought condition again, likely mid to late next week.
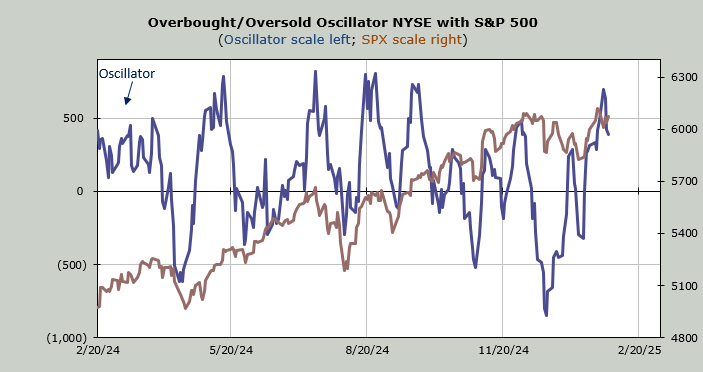
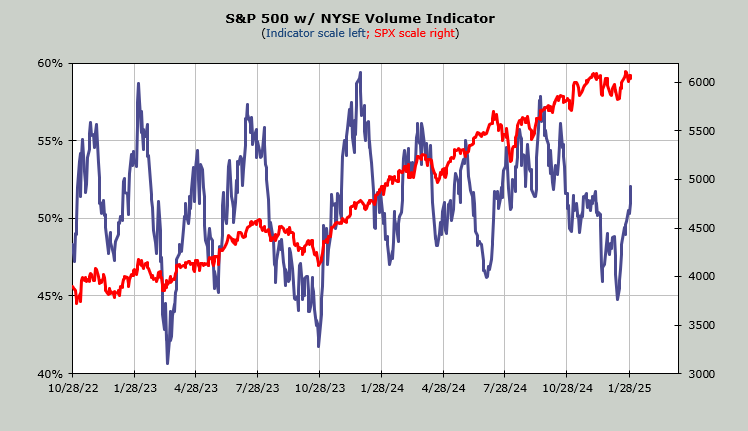
The Volume Indicator is now at 52%. It will get overbought in the mid-50s. I expect it will get there in early February as well. As you can see, the S&P has rarely responded to the overbought conditions, but the rest of the market has. Since the Index movers are no longer working as a pack, it will be interesting to see if the S&P can budge out of its range.
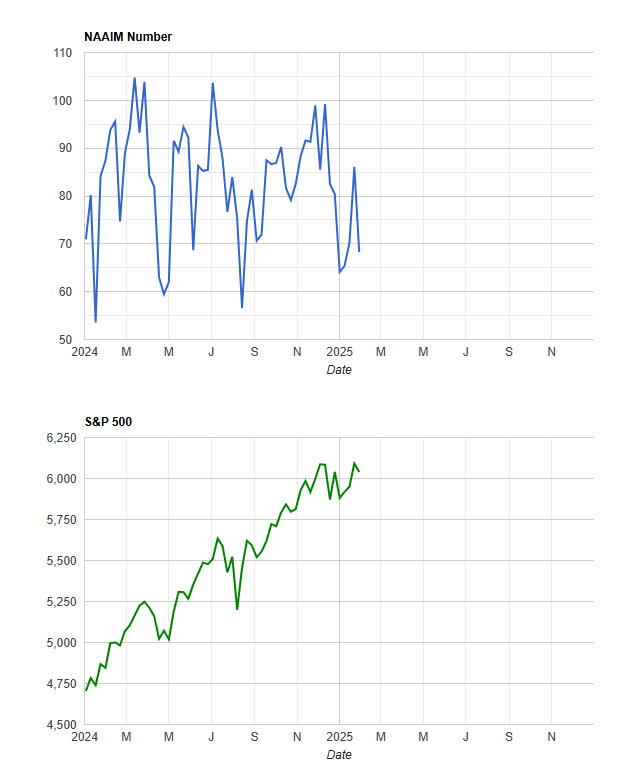
But, it’s sentiment we have to get back to. The good news is that I believe the National Association of Active Investment Managers proved me correct this week. It has been my view that they live and die by the Index movers/Mag 7, not the overall market. They took their exposure down to 68 this week, down from 86. I suspect that Monday’s market and the AI question scared them.
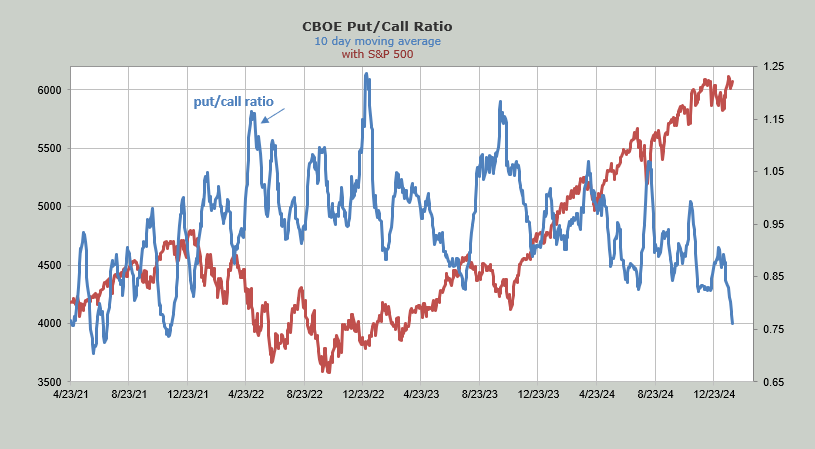
But then we get back to the put/call ratio. This week we looked at the ten-day moving average of the index put/call ratio, as it is the lowest since 2019. Thursday we saw the total reading chime in at .70. That’s pretty low. And it took the ten day moving average down to .76. It is now closing in on the November 2021 reading of .74.
However, you can see that in the summer of 2021 we had two similar low readings, so I thought we’d go back and check in on them. First of all, it is unusual to have two such low readings one month apart, but it happened.
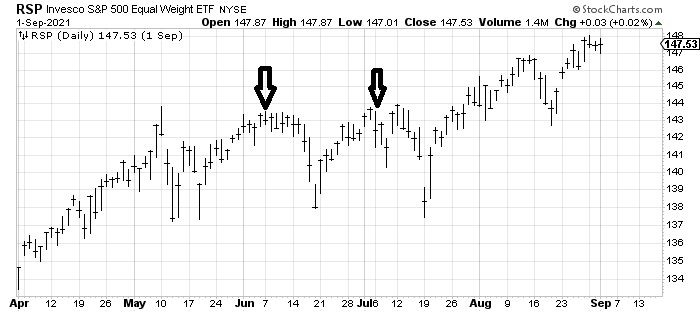
I took at a look at the RSP from back then to see if it mattered and, lo and behold, you can see it on the chart. Neither cared immediately but within a week or so the RSP fell 3-4% in a hurry.
I would be remiss if I did not note that the put/call ratio for the VIX sunk back under .20 again on Wednesday. This is the second Wednesday in a row, so my antennae are perked up—why Wednesday? Either way, once again folks are betting on a higher VIX. Since I have been eyeing early February as a time we should get intermediate term overbought, I would look for another bout of volatility in early February.
2025 is shaping up to be a trading market.