Rally, Rest, Repeat. Is Breadth Strong Enough to Keep the Pattern Going?
Too many sectors aren't keeping up. Does that put the rally in jeopardy?
You've reached your free article limit
You've read 0 of 1 free Pro articles.

You know all those complaints I had a week ago? About the industrials not keeping up. About the banks not keeping up. About the Utes not keeping up. About breadth in general not keeping up. Those issues haven’t gone away. In fact, the action on Wednesday made them worse.
For weeks now, my view has been that pullbacks and/or chops in the market should lead to more rallying. And that’s what we’ve gotten. The problem is that the rally wasn’t that widespread to start with, and it has gotten even narrower.
RSP, an ETF to be long the equal-weight S&P, hasn’t even made a new high. Notice, though, that it did what it was supposed to do coming off the low. It rallied, then rested (chopped), then it rallied and rested (circles on the chart), then it rallied, and now it is resting.
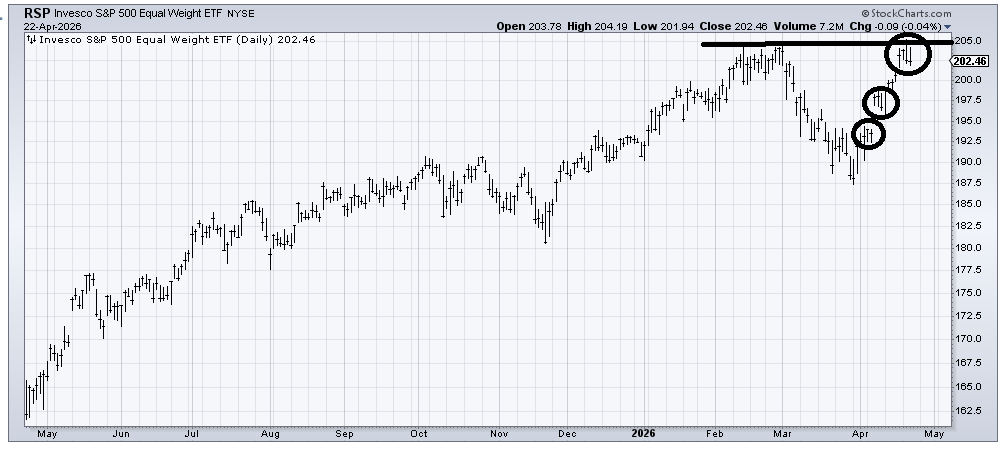
The question is if this is a rest or it’s done. We are clearly still short-term overbought, and it is manifesting itself in this broad group of stocks. We are not yet intermediate-term overbought, though, which is why I want to keep the door open for this to be another resting spot.
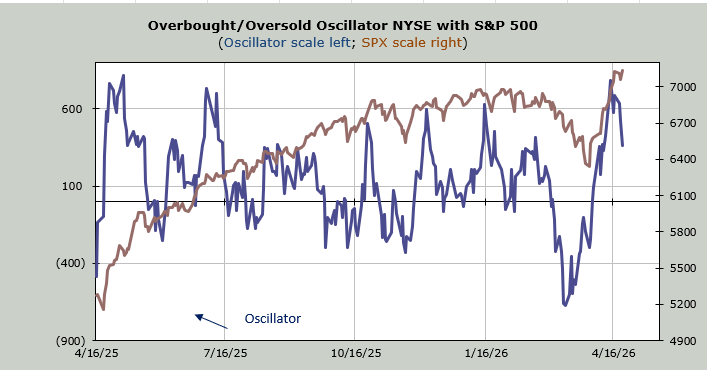
But the number of stocks making new highs has not increased, not on the NYSE, not on Nasdaq. The McClellan Summation Index is still rising—and to me, this is key. If it rolls over, then I will take the lack of a new high in the RSP as a change worth fussing over. It will take a net differential of -1500 advancers minus decliners on the NYSE to halt the rise in the Summation Index, so this means breadth is important.
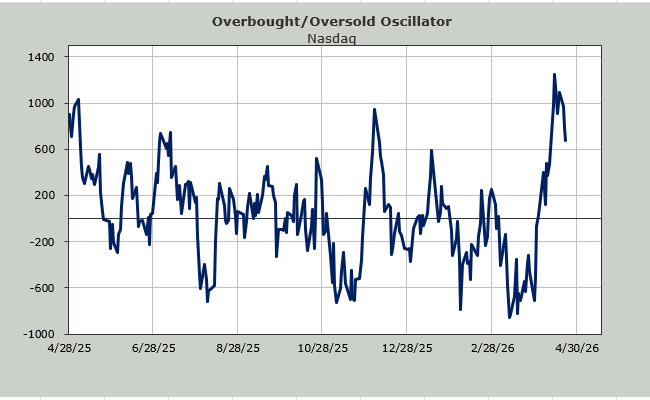
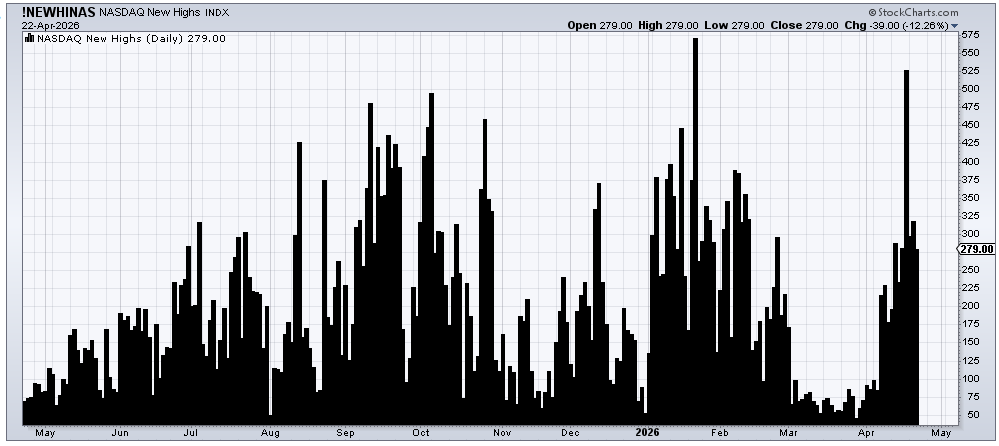
I realize that it’s all tech and semis in the rally camp, so let’s check in on the new highs on Nasdaq. Wednesday’s ramp brought us 279 new highs. Last week, there were 527. In early January, there were 567. I realize it is difficult to maintain that many stocks at new highs (over 500) for extended periods of time, but 279 is lower than Tuesday, when there were 318, and Nasdaq was down nearly 150 points on Tuesday.
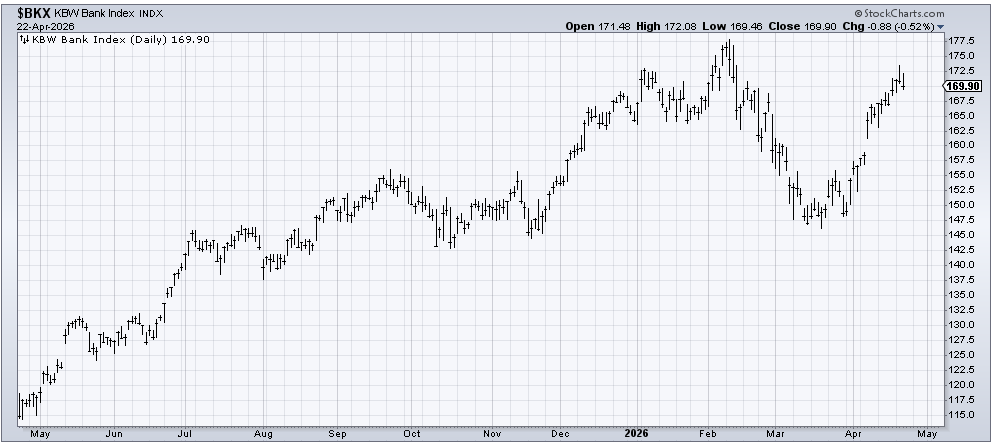
The Bank Index is where it was the first week of January.
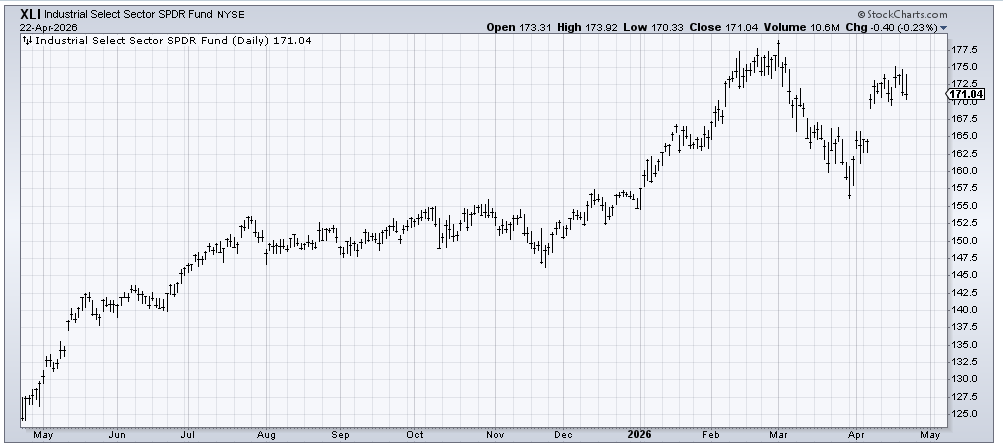
The Industrials have made no headway in more than two weeks.
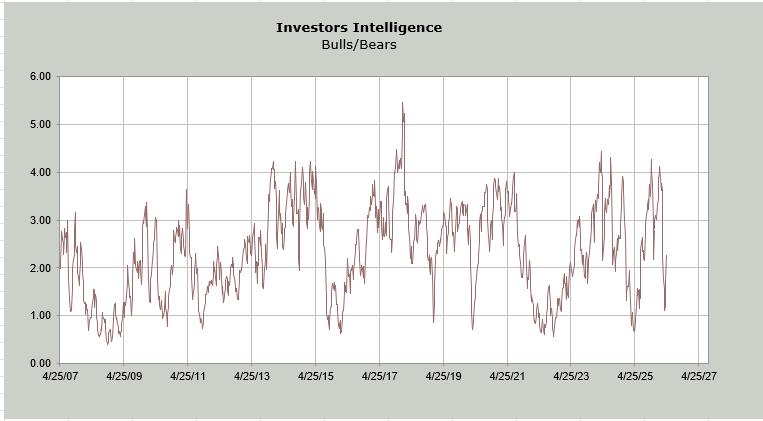
The Investors’ Intelligence bulls are now at 48.1% with the bears at 21.1%. Neither is extreme. The ratio of bulls to bears is 2.2, which I consider neutral.
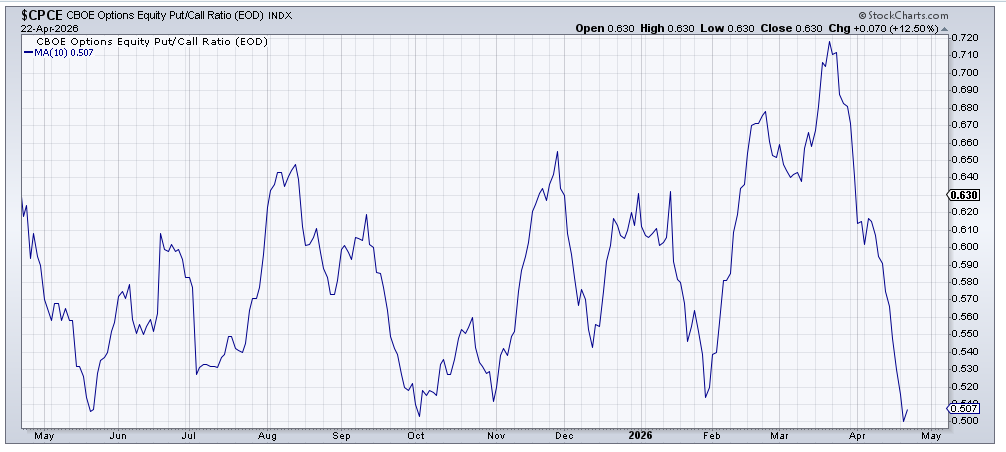
The equity put/call ratio’s 10-day moving average is now at .50. In the last year, we’ve seen it get down here twice before: mid-May last year and early October. If this is mid-May last year, then breadth had better start expanding because this week has been all tech all the time, and that’s just not healthy.