Patience Over Instant Gratification: Decoding QQQ’s Triangle Setup
Many traders are looking at this pattern, but they're not paying attention to the rules.
You've reached your free article limit
You've read 0 of 1 free Pro articles.
We all like instant gratification when it comes to trading. Who doesn’t want to buy a stock and see it rally as soon as we’ve got our position filled? Most of us are not known for our patience. I know I am not.
I also know it has taken a lot of patience on the part of the bulls when it comes to the QQQs. This ETF, loaded with mega-cap tech stocks, is the same place it was in October. Oh, sure, there have been trades to be had, but when you are so used to this particular ETF trading as it did in September (nothing but up) you might lose your patience with the action in the fourth quarter and the first few days of January.
Yet I see the many drawing this triangle on the chart (black lines). Some are calling for a breakout to the upside, while others believe it will break to the downside. I feel as though I might disappoint everyone because the best breakouts for a triangle come somewhere between halfway and three-quarters of the way into the apex, and this one has gone beyond that.
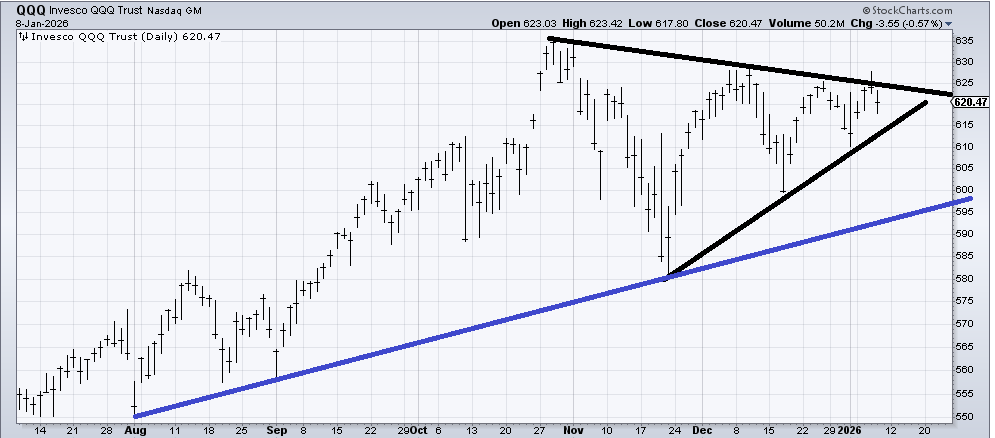
A triangle is a pattern of indecision, so there tends to be very little instant gratification. And then when we get this far into the apex, it’s typical not which way the breakout comes but rather IF we get one. More often than not, these charts tend to meander into the apex, and new lines must be drawn. Or they break out one way and immediately return and go back into the pattern.
One final point is that I suspect at some point we will see the QQQs test that blue line. Will it be before, during, or after earnings? I don’t know, but it surely feels like sometime in the first quarter that blue line gets tested. I can only hope the indicators will tell us.
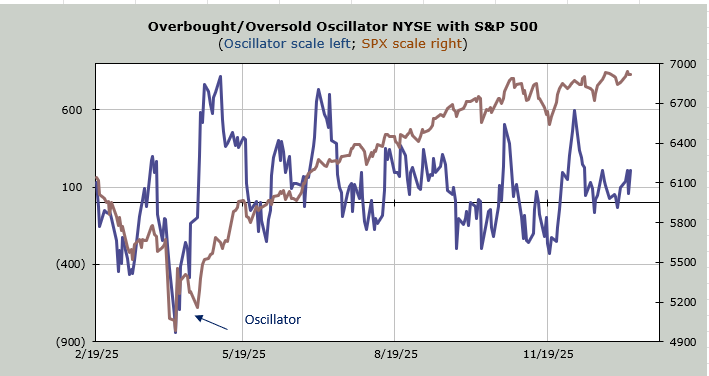
In the meantime, none of the indicators changed after Thursday’s action. None of the ratios changed either. We had group rotation because NVIDIA sat it out, which meant everything else could rally.
But did those 493 make much progress? Not much. We can see it in the number of stocks making new highs. Tuesday, there were 227 new highs on the NYSE, and Thursday there were 165.
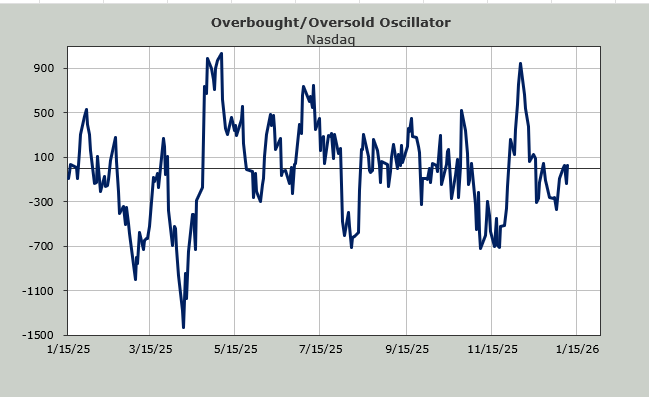
Nasdaq fared similarly. The new highs on Tuesday were 379, while Thursday brought us 241 new highs. But it’s not as though the new lows expanded either. If your stock was up Tuesday and down Wednesday, then it was up Thursday, giving us a pattern that looks like this:

And if your stock soared on Tuesday, saw no follow-through on Wednesday, and came down on Thursday, it looks like this:

The end result is a whole lot of stocks doing a whole lot of nothing except rotating the groups.