Parsing the 'Red Sea' and Charting the S&P 500 and Nasdaq
What does it mean when one major index confirms a downtrend and another one does not? Is this is a blip ahead of the next leg of the bull market or something more ominous?
You've reached your free article limit
You've read 0 of 1 free Pro articles.
Call it "Ugly Monday." Maybe just call Monday "The Red Sea" as most screens, or maybe it was just mine, reflected a sea of red for most of the day.
The longer the day wore on, the deeper the shade of red. That is until late in the session, when Fed Governor Christopher Waller spoke in London and sounded quite dovish. Waller broke with what most Fed speakers have been saying publicly of late and referred to U.S. labor markets as being near "stall speed."
Waller was blunt on Monday, pointing out that the FOMC needed to reduce the target range for the Fed Funds rate by 25 basis points on December 10 in order to "provide additional insurance against an acceleration in the weakening of the labor market." Waller was appointed to the Federal Reserve Board of Governors by President Trump during the president's first term and is known to be a finalist to succeed Jerome Powell as Fed Chair in May.
This dovish talk did have a late impact on the keyword-reading algorithms that control the momentum trade in 2025 and took U.S. equity indexes, which, for the most part, closed sharply lower on Monday, off of their session lows.
Fed Vice Chair Philip Jefferson, who is not considered to be a candidate to ascend to the top job in May, also spoke publicly. Jefferson, who is highly respected, was cautious. He said, "The evolving balance of risks underscores the need to proceed slowly." While admitting that current policy is "somewhat restrictive," Jefferson sounded, at least to me, as if he would be fine with leaving short-term rates where they are for the balance of this calendar year.
Strong Economy?
I wouldn't get all that excited about a couple of stray data points, but then again, I am not a keyword-reading algorithm. Reacting in microseconds and chasing at high speeds is what they do. When it comes to the debate over monetary policy, these trading algorithms behave in a way that would be counterintuitive to someone new to financial markets. Bad is good because it increases the probability for a dovish policy response, while good is bad as good increases the likelihood for a hawkish response.
On Monday, the economic numbers that did cross the tape were surprisingly strong. The Census Bureau, after the long shutdown, finally got around to publishing August Construction Spending. Yes, August. Well, for that long-forgotten month, construction spending printed at +0.2%, month over month, from July. Expectations had been for -0.2%, so this was indeed a huge beat. Remember the guys in the colored jackets that used to populate trading floors? Well, contrary to popular opinion, most of them had some common sense. They would not have reacted to three-month-old data. Algorithms? No common sense whatsoever. The chase to the downside was on.
Making matters worse, for the markets, or better for the economy, the New York Fed released the Empire State Manufacturing Index for November on Monday morning. This is a regional survey of New York-based manufacturers, and it printed at much better levels than expected. At the headline, the survey crossed the tape at 18.7. Wall Street had been looking for a 6.1 print. For November, in New York, New Orders accelerated greatly, while shipments and inventories picked up the pace as well.
Average workweek for manufacturers moved from contraction in October into expansion. Hmm... that's really huge. Increased workweeks are what usually comes ahead of a hiring spree. Even inflation, while still present, appeared to decelerate. Was this a one-off? Was this a mirage? We'll find out Thursday. That's when the Philadelphia Fed will release their very similar regional manufacturing survey. Philly, for those unaware, on the national manufacturing scene, is more important than New York, and is coming off of an awful October.
Marketplace
The sellers once again leaned into the tech/AI trade on Monday as news broke that, according to his 13F filing, billionaire investor Peter Thiel had completely exited his Nvidia (NVDA) stake. Though Thiel sold the stock in the third quarter, the news hit the tape just days ahead of Nvidia's Q3 earnings release this Wednesday afternoon. The stock gave up 1.9% and the entire group followed. Additionally, Dell Technologies (DELL) was pummeled for a loss of 8.3% after a downgrade at Morgan Stanley. DELL was the worst performer across the S&P 500.
For the day, the S&P 500 surrendered 0.92%, posting a third consecutive losing session and is now down 3.6% from its recent high which was made on October 29. The Nasdaq Composite gave back 0.84% on Monday, posting a sixth losing session in its past eight. The Nasdaq is now 5.5% lower than its late October high.
The small-to mid-cap indexes all lost between 1.84% and 2.21% on Monday. The Russell 2000 closed down 8% from its October high. I think it's safe to say that U.S. equity markets have entered into a correction at a minimum.
Whether this is a blip ahead of the next leg of the bull market or something more ominous has to now be debated. I won't pretend that I did not enter November bullish, amid expectations for a holiday season rally. I did. I was positioned for it as well, so while I am not anywhere near losing my summertime gains, I have relinquished enough of those late-autumn gains that if I am honest, I realize simply came too easily.
I have aggressively increased my cash position for the moment, partially so I can see which way the wind blows and not take a severe beating while doing so, and partially because I am very likely getting close to a divorce settlement. I don't need questions about a sharp drop in the market value of my kingdom just ahead of splitting it up. "They" don't always seem to understand that traders and investors who live off the land without the safety net of a salary or any kind of base pay, don't have a steady income or even an average month. Oh, we can figure out what an average month is mathematically, we just don't ever seem to actually have one. The courts don't "get" the feast or famine lifestyle.
Breadth
Ten of the 11 S&P sector SPDR ETFs closed out the Monday session in the red. Four of these funds, the Financials (XLF) , Energy (XLE) , Technology (XLK) and the Materials (XLB) all lost more than 1.5% but less than 2% for the day. The Utilities (XLU) posted a gain of 0.9% and were the day's only winner. Defensive sector funds took four of the five top slots on the daily performance tables.
The action was awful for the day. Losers beat winners by almost five to one at the NYSE and by just about three to one at the Nasdaq. Advancing volume took a 38.3% share of composite Nasdaq-listed trade, which is weak enough, but just an 18.2% share of composite NTSE-listed trade. That suggests a coming period of increased economic weakness. On the bright side, though recessions are awful and close to recessionary periods, which the U.S. experienced from 2008 right into 2016, are also tough, they are deflationary.
So, do we have confirmation of the downside reversal of trend? Very possibly. Aggregate trade was up 3.2% on Monday from Friday. After Thursday's Day One reversal and Friday's light volume pause, the S&P 500 would appear to confirm the downtrend.
Take a look:
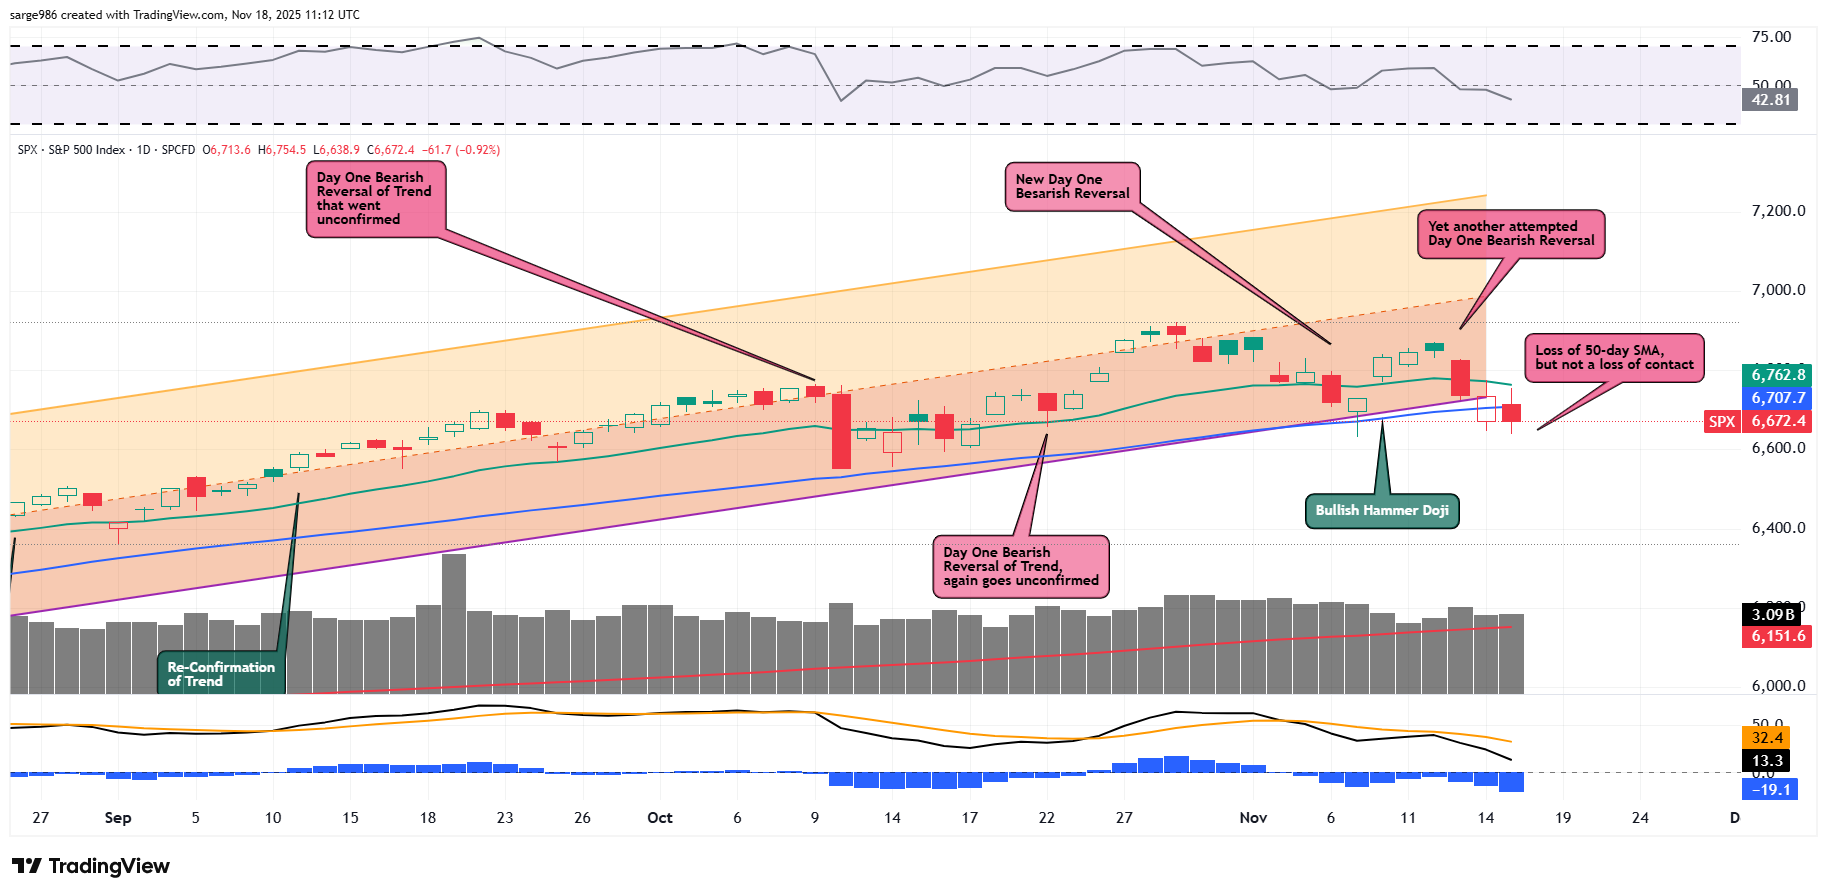
In just a few days, the S&P 500 has lost its 21-day exponential moving average (EMA), the lower trendline of our Raff Regression model and its 50-day simple moving average (SMA). That said, with a fairly gnarly looking daily moving average convergence divergence (MACD), the index has not yet lost contact with its 50-day SMA. Hence, the line has not yet been "officially" lost.
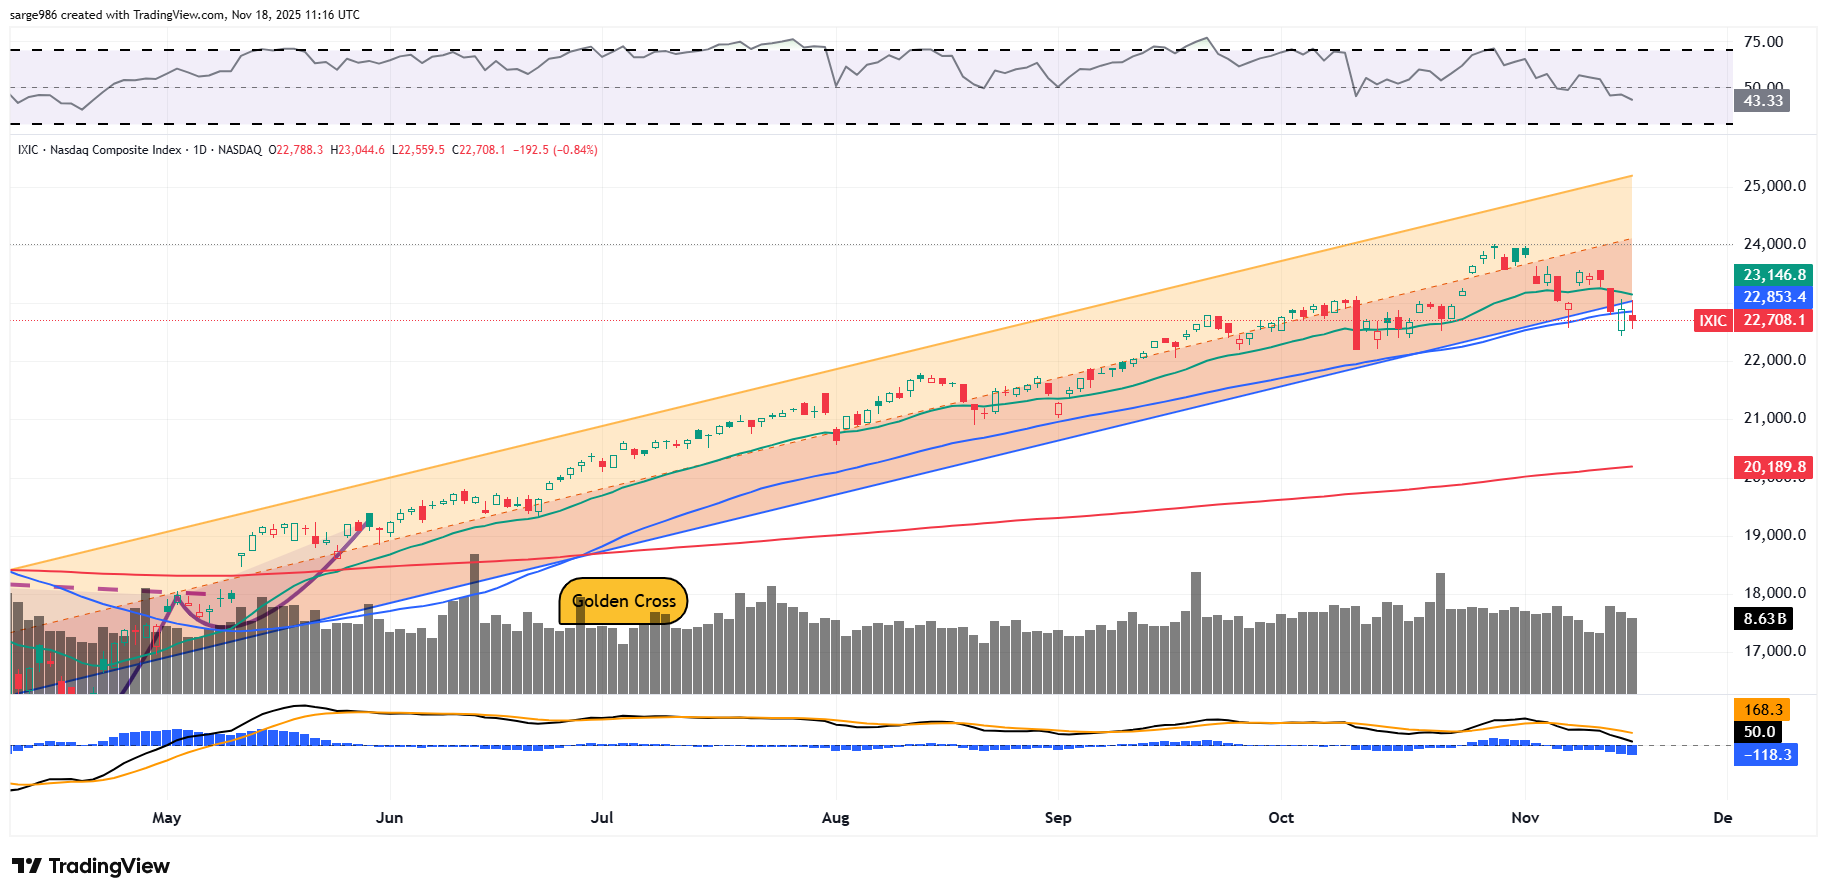
Switching over to the Nasdaq Composite, below, we see that this index also bears a nasty-looking daily MACD, while also losing its 21-day EMA, lower trendline of our regression model and its 50-day SMA, but without losing contact. Additionally, look at the bottom of the chart. Aggregate trading volume across the Nasdaq Composite failed to confirm the bearish change of trend despite the S&P 500 having already confirmed.
What Does That Mean?
Maybe nothing. Maybe one major index confirming and one major index failing to confirm negates the whole thing or just puts confirmation on hold. Or maybe, and this is just me spit-balling here, so don't get carried away, maybe there is a whiff of a major or close to major stimulus package in the air as the economy weakens.
The Fed still needs to be convinced, but the rest of the world's major central banks could be already thinking of going there. Should there be a larger, coordinated period of dovish policy or even a renewed period of quantitative easing, the U.S. would have to participate just to keep dollar valuations in check. That would rekindle already warm inflation. That would also artificially goose M2 Money Supply (which, globally is already at record highs) and thus, asset prices.
In other words, that would be a good reason to return to lower cash levels and own something tangible such as real estate or equities, growth over value, growth and cyclicals over defensives. Though the economy is slowing and markets are struggling, if there is a coordinated easing of policy that aligns with the lower taxes and decreased regulation of the One Big Beautiful Bill, we do not need to be cowering in a hole somewhere. We are going to have to be aggressive.
Economics (All Times Eastern)
08:15 - ADP Employment Report (Weekly): Last 11.25K.
08:55 - Redbook (Weekly): Last 5.9% y/y.
10:00 - NAHB Housing Market index (Nov): Expecting 36, Last 37.
16:30 - API Oil Inventories (Weekly): Last +1.3M.
The Fed (All Times Eastern)
11:30 - Speaker: Reserve Board Gov. Michael Barr.
Today's Earnings Highlights (Consensus EPS Expectations)
Before the Open: (HD) (3.83), (MDT) (1.31)
At the time of publication, Guilfoyle was long NVDA equity.
