Overbought, Despite Four Down Days
The market is intermediate-term overbought and we can expect lots of volatility in the month ahead.
You've reached your free article limit
You've read 0 of 1 free Pro articles.
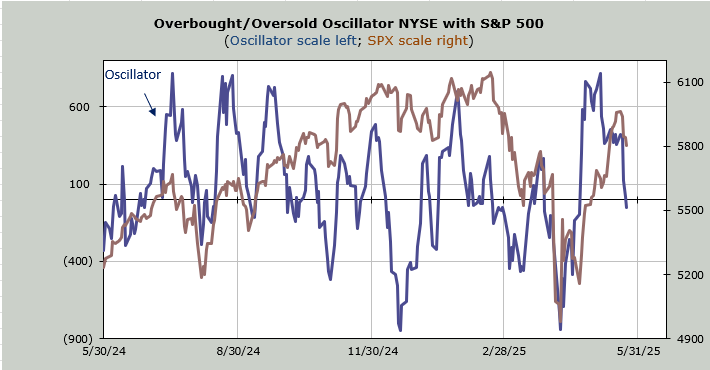
We are now intermediate-term overbought.
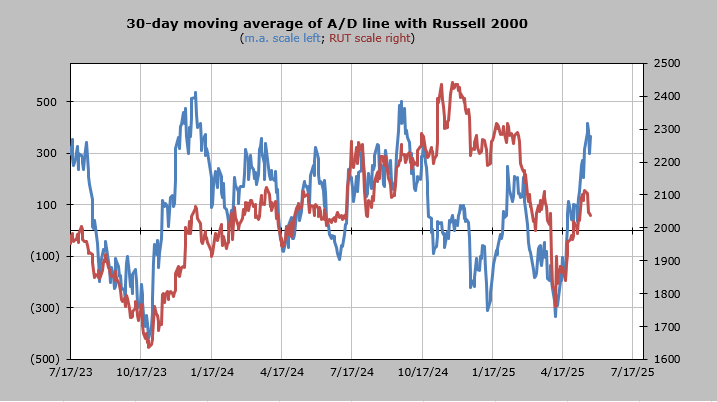
If I use the Volume Indicator, which reached 57% (overbought is mid to upper 50s) last week, it is considered overbought. If I use the 30-day moving average of the advance/decline line, it is overbought.
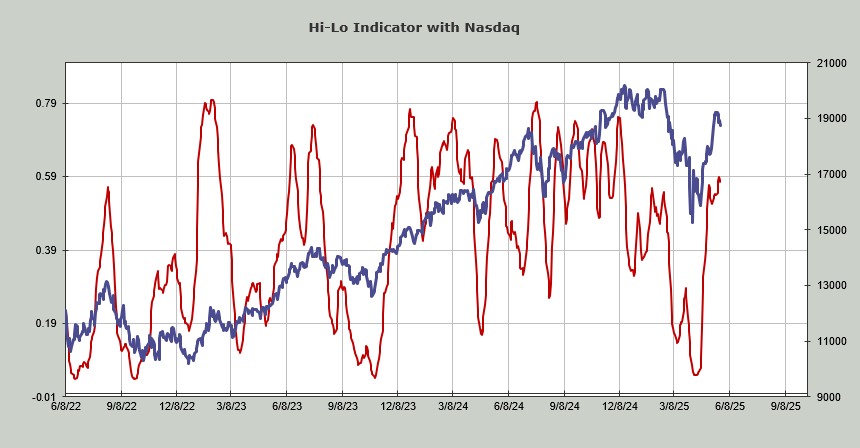
If I use the Hi-Lo Indicator, we see that despite making a minor higher high Nasdaq’s has rolled back over. The NYSE’s Hi-Lo Indicator also rolled over late last week.
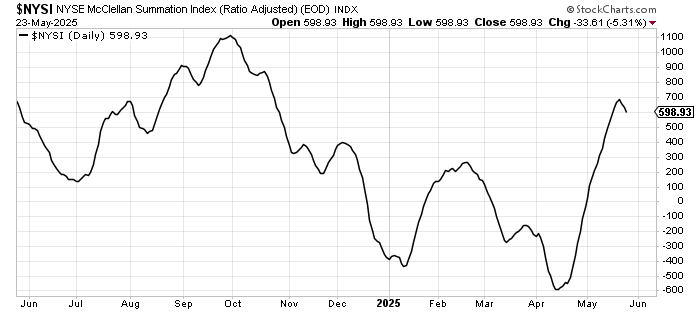
If we look at the McClellan Summation Index, which is a good determinant of breadth because it smooths out the daily fluctuations, it has rolled over.
Yet the S&P has been red for four straight days already. Here’s something curious: it hasn’t done so since the final week of 2024. That means the entire (almost) 20% decline in the S&P never saw one stretch with the S&P down four straight days.
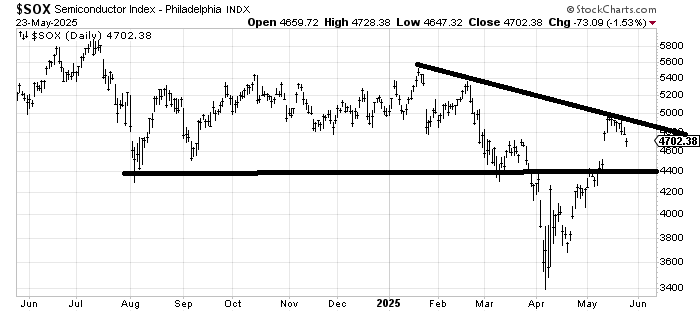
The Beloved SOX has been red seven straight days. And it is down six percent already. Not only that, the SOX has pushed into the gap from the day we were told there was an agreement with China.
The Russell is also already down five percent. In other words, there has already been quite a bit of selling. So, when I say at times over the next month or so that I think we can/should bounce, please understand I think it is within the context of short-term bounces.
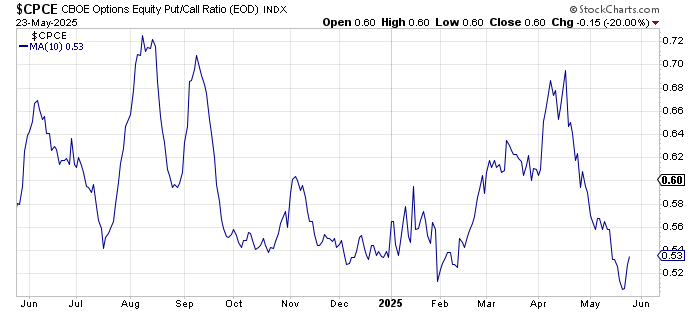
I have used the term volatility, not decline, for what I expect in the month of June. One of the reasons is that while I think sentiment has shifted quite a bit from March/April, I believe most folks are not ‘all in’ or complacent. Just witness how fast the equity put/call ratio zipped right up to .75 on Thursday. In a complacent market, that would have stayed low.
Yet we did see, much to my surprise, the AAII survey shows more bulls than bears for the first time since February. We saw the NAAIM Exposure jump back to 80 this week. I’ve already noted that the Investors Intelligence survey showed more bulls than bears, and we know that the ten-day moving average of the put/call ratio has gotten quite low.
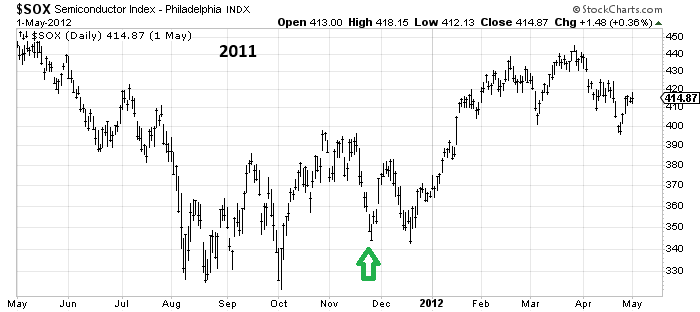
The SOX has been red for seven straight days, something that is actually quite rare. In the last fifteen years, it has only occurred four other times. I realize four instances are not a lot of data (but also shows us how rare it is), but three of those times there was a bounce and further selling (anywhere from 7 to 20% more). Once it was part of a bottoming process in 2011. I think the chart of the SOX today looks quite different than it did back then.
I did not find one instance where the SOX managed to make it eight straight red days, so yes, I expect a bounce. I know NVDA’s earnings will move the Semiconductor Index, but over the next month, I would think at best the SOX chops in a wide range (4400-5000).
I said at the start of 2025, I think this is a trading market, and I still think it is. It’s also why I believe we are in for more volatility in the coming weeks.
Finally, I recorded a podcast with Liz Ann Sonders of Schwab early last week. If you would like to listen, the link is here: https://podcasts.apple.com/us/podcast/navigating-the-funky-market-environment-with/id1711806955?i=1000709545912