Oracle's Wild Ride in 2025 Mirrors Market Trends. Here's What it Means.
Let's recap the crazy year that Oracle investors have endured. The stock's highs and lows have told the story of 2025.
You've reached your free article limit
You've read 0 of 1 free Pro articles.
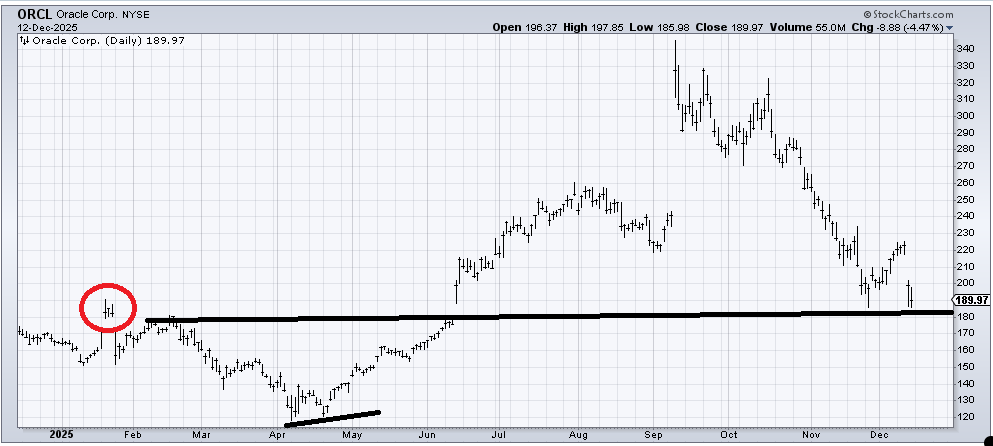
To me, the chart of Oracle (ORCL) encapsulates the year we have had in the market.
It began the year with an island top in January. An island is when we have a gap up and a gap down, leaving ‘water’ around the pattern (red circle). When it occurs at a high it is bearish; conversely, at lows, it is bullish. The stock fell thirty percent from there.
Then it had a double bottom in April, which was positive, and that was followed by a breakout on a gap in June. It had a terrific run off that breakout, which measured to 240-ish. It got to 260 in July (before it peaked—so many peaks in July/August this year).
It corrected, and then, in the fall, when speculation was running amok, Oracle joined the fray, gapping up one hundred points on an announcement about something that was years in the future. Isn’t that what biotech stocks with no earnings do, not old-fashioned, well-known tech stocks? Thus, my speculation terminology.
And we know that was speculation, as I documented almost daily with the penny stock trades, the rocket stocks, the quantum stocks, anything having to do with AI flying. I likened it (and still do) to the SPAC speculation we saw in early 2021.
But back to Oracle. The excitement over the AI announcement began to leak, slowly at first, and then an attempt at a rally in October followed by that relentless decline in November, where folks were citing the credit default swaps (CDS) of Oracle almost daily (they are back to that, but let’s focus on November for now).
The stock then enjoyed an oversold rally, and now it is back to testing that November low and support. My view is that we typically get a short-term bounce off a spike low, but if we think about Oracle’s path this year, it follows the narrative of the year.
In the first quarter: Oh my, tech will get crushed with tariffs, sell it all. Ok, maybe tech will be ok, buy tech. Then the summer showed a slowing job market and some more inflation than expected. Yikes, that’s not good (summer correction). But in the fall, all this new economy stuff was going to catapult us upward forever and a day (the gap up). Then reality sets in, and, huh, maybe cash to burn has found a match with all this spending.
And now we find ourselves with beloved tech no longer able to rally on good earnings (see NVDA a few weeks ago and now AVGO Friday). Group rotation has been intact in this market since that summer peak, and it remains in place for now.
As for Friday, I did not see any panic (the put/call ratio could not even get over 1.0). The VIX was barely up. The volume on the QQQs was 75 million shares, but a few weeks ago, we saw back-to-back days of 100 million shares. Yet nothing broke down, nothing broke uptrend lines or 50-day moving averages.
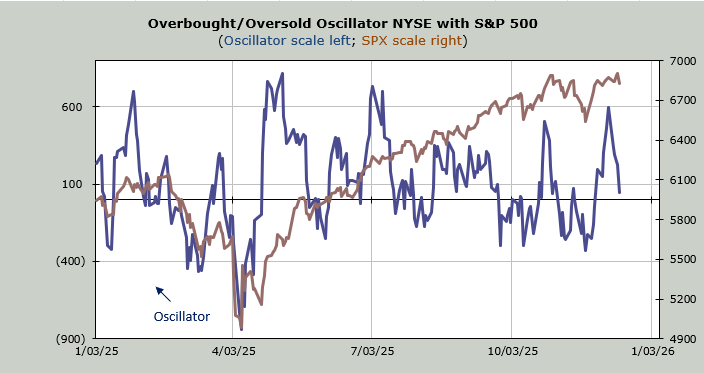
I don’t think the volatility is done yet. In the last eight weeks, the S&P is flat as a pancake. At least we’re working off that overbought reading.