Oil Services Built a Textbook Base. Has the Ensuing Energy Bull Run Its Course?
Let's take a look at the energy markets.
You've reached your free article limit
You've read 0 of 1 free Pro articles.
 Getting Ready to Buy Energy Stocks on Weakness
Let’s talk energy. Why not? Everyone else is.
I have mostly refrained from it because as you may recall I was a fan of energy last fall. I had no idea we would have a war in the Middle East, but the charts said basing and the sentiment was bearish.
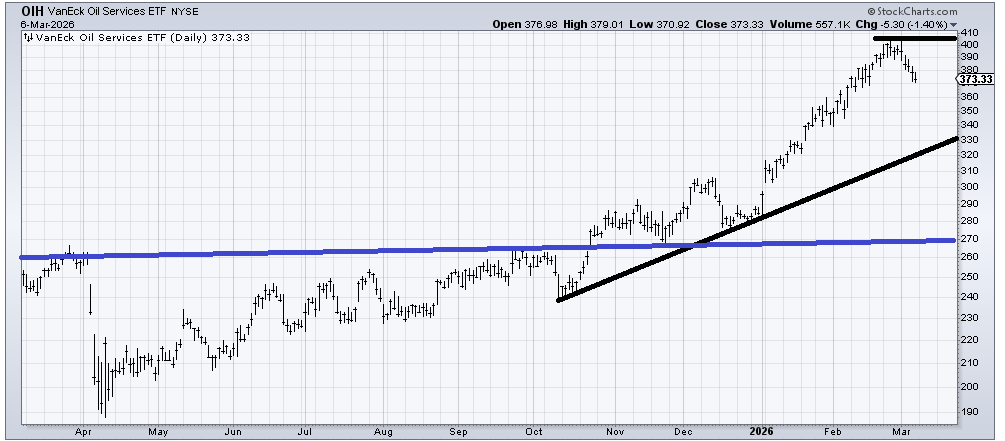
Look at OIH, an ETF to be long oil service stocks, it did so much back and forth from early 2025 until October (software fans, take note, that’s how bases are built). It broke out in October (crossed the blue line), tested the breakout in November, and then continued to make higher lows until January, when it took off like a rocket.
But two weeks ago—before the war began—it began sputtering. And in the last two weeks, it is down just over ten percent.
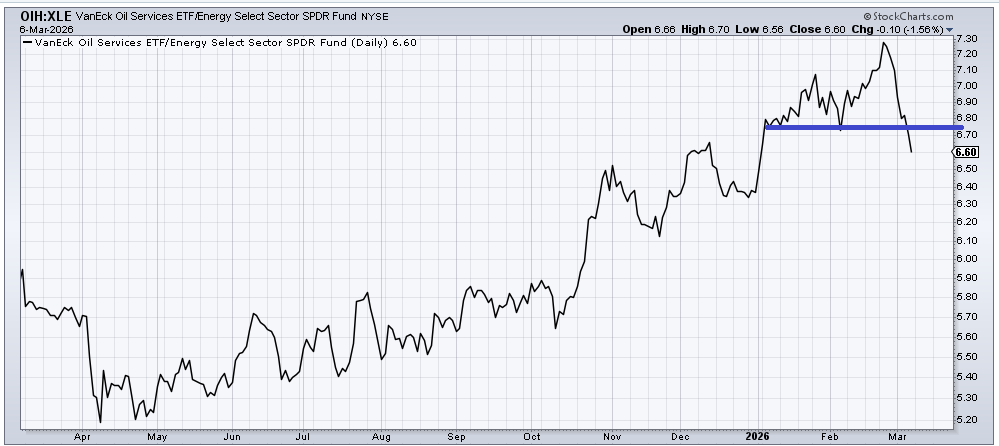
Oh, maybe it’s oversold a bit down here, but long-time readers will know I like to look at the ratio of OIH (higher beta) to XLE (lower beta) to see how willing folks are to go out on the risk curve. When OIH is outperforming, energy is generally okay. When OIH is underperforming, XLE energy is generally not great.
So, while everyone is marveling over the price of Brent, or WTI, or Gasoline (and those moves are eye-popping), OIH relative to XLE has collapsed in the last two weeks, with it now clocking in where it was in December. Maybe this is a minor correction in a much longer-term uptrend, but I am inclined to think energy stocks are not the place to be, despite the news and the price of the commodity.
Let’s go back to 1990, to the period of time when Iraq invaded Kuwait. It happened in the first few days of August. We didn’t have these ETFs then, but we did have Schlumberger (SLB) and Exxon (XOM). Notice the ratio had been rising since the prior spring. Notice the ratio peaked in mid to late July. Oh, it had another try upward in late August, but could never get over that prior high. A perfect picture of the old axiom, ‘buy the rumor, sell the news’.
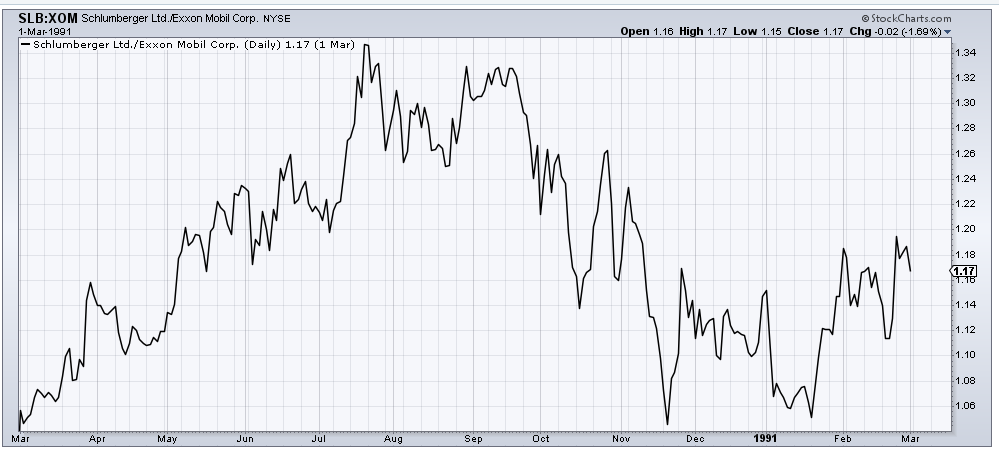
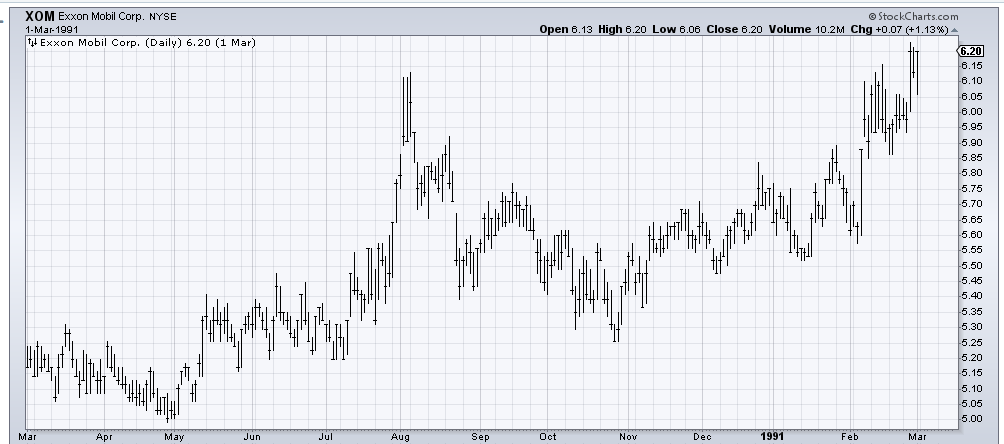
Now look at Exxon from back then. When did it peak? On the invasion, in early August. By the time the US actually got involved in January 1991, the stock was down ten percent (off the lows from down 15%).
I have no strong view on oil prices themselves. The DSI is currently 87, so it’s close to getting extreme, but at some point, the stocks no longer move on the news or with the commodity, and I think we’re close on that score. And they are part of the 493, which is still an area I am staying away from for now.
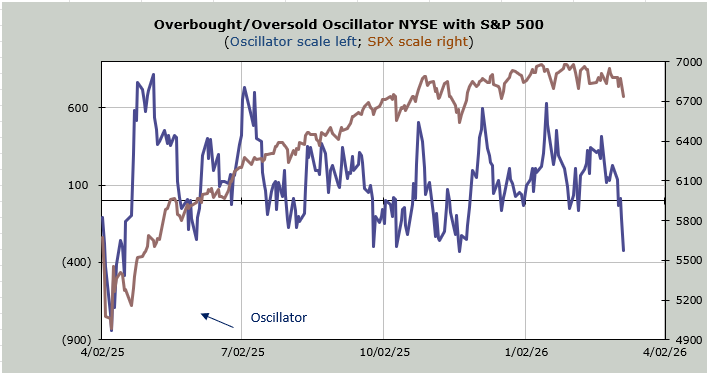
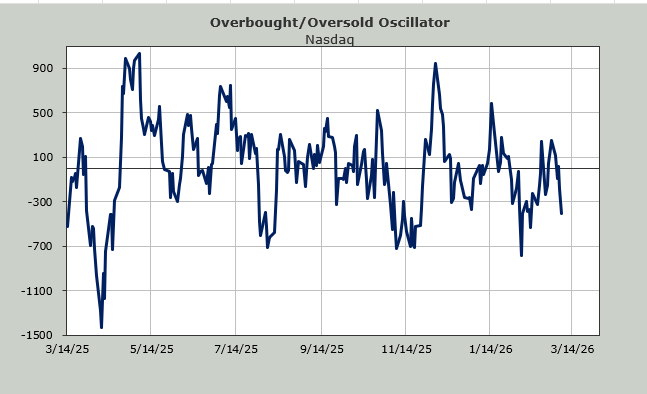
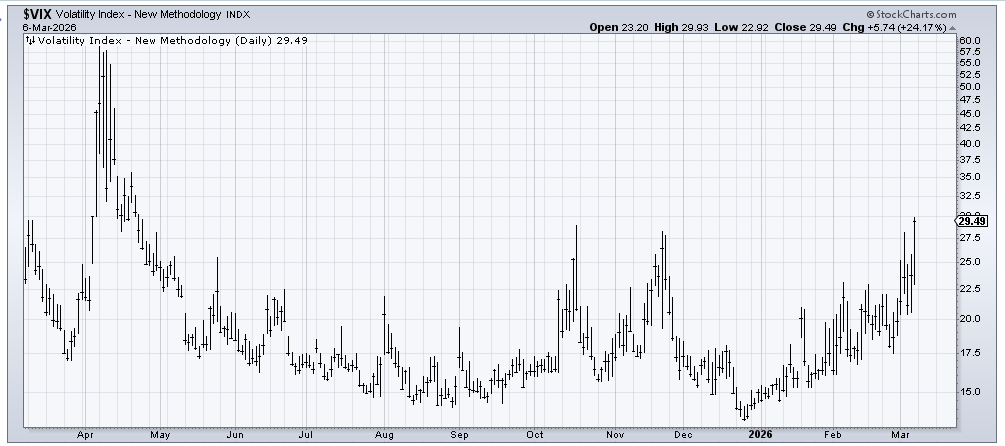
Aside from that, the Overbought/Oversold Oscillator is getting closer to oversold, and the VIX is on the verge of getting jumpy. And the folks on television who were complacent earlier last week are now concerned and cautious. That ought to show up in the sentiment indicators soon.
Related: Beating the S&P 500 Won’t Save Your Retirement — But This Will
