Nvidia’s 'Herculean Effort' and the One Chart You Need to See Right Now
Let’s gain some perspective on recent market activity.
You've reached your free article limit
You've read 0 of 1 free Pro articles.
 Trump Jr.'s GrabAGun Stake Worth $4 Million Even After 20% Drop
The major stock indexes have been in consolidation mode for months, but are slowly breaking down. At least that’s what the daily charts are telling us.
The worst offender in the group is the Dow Jones Industrial Average. On Thursday, the venerable index closed at its lowest level in over three months. The Dow closed just 0.5% above its next major support level, the 200-day moving average (red).
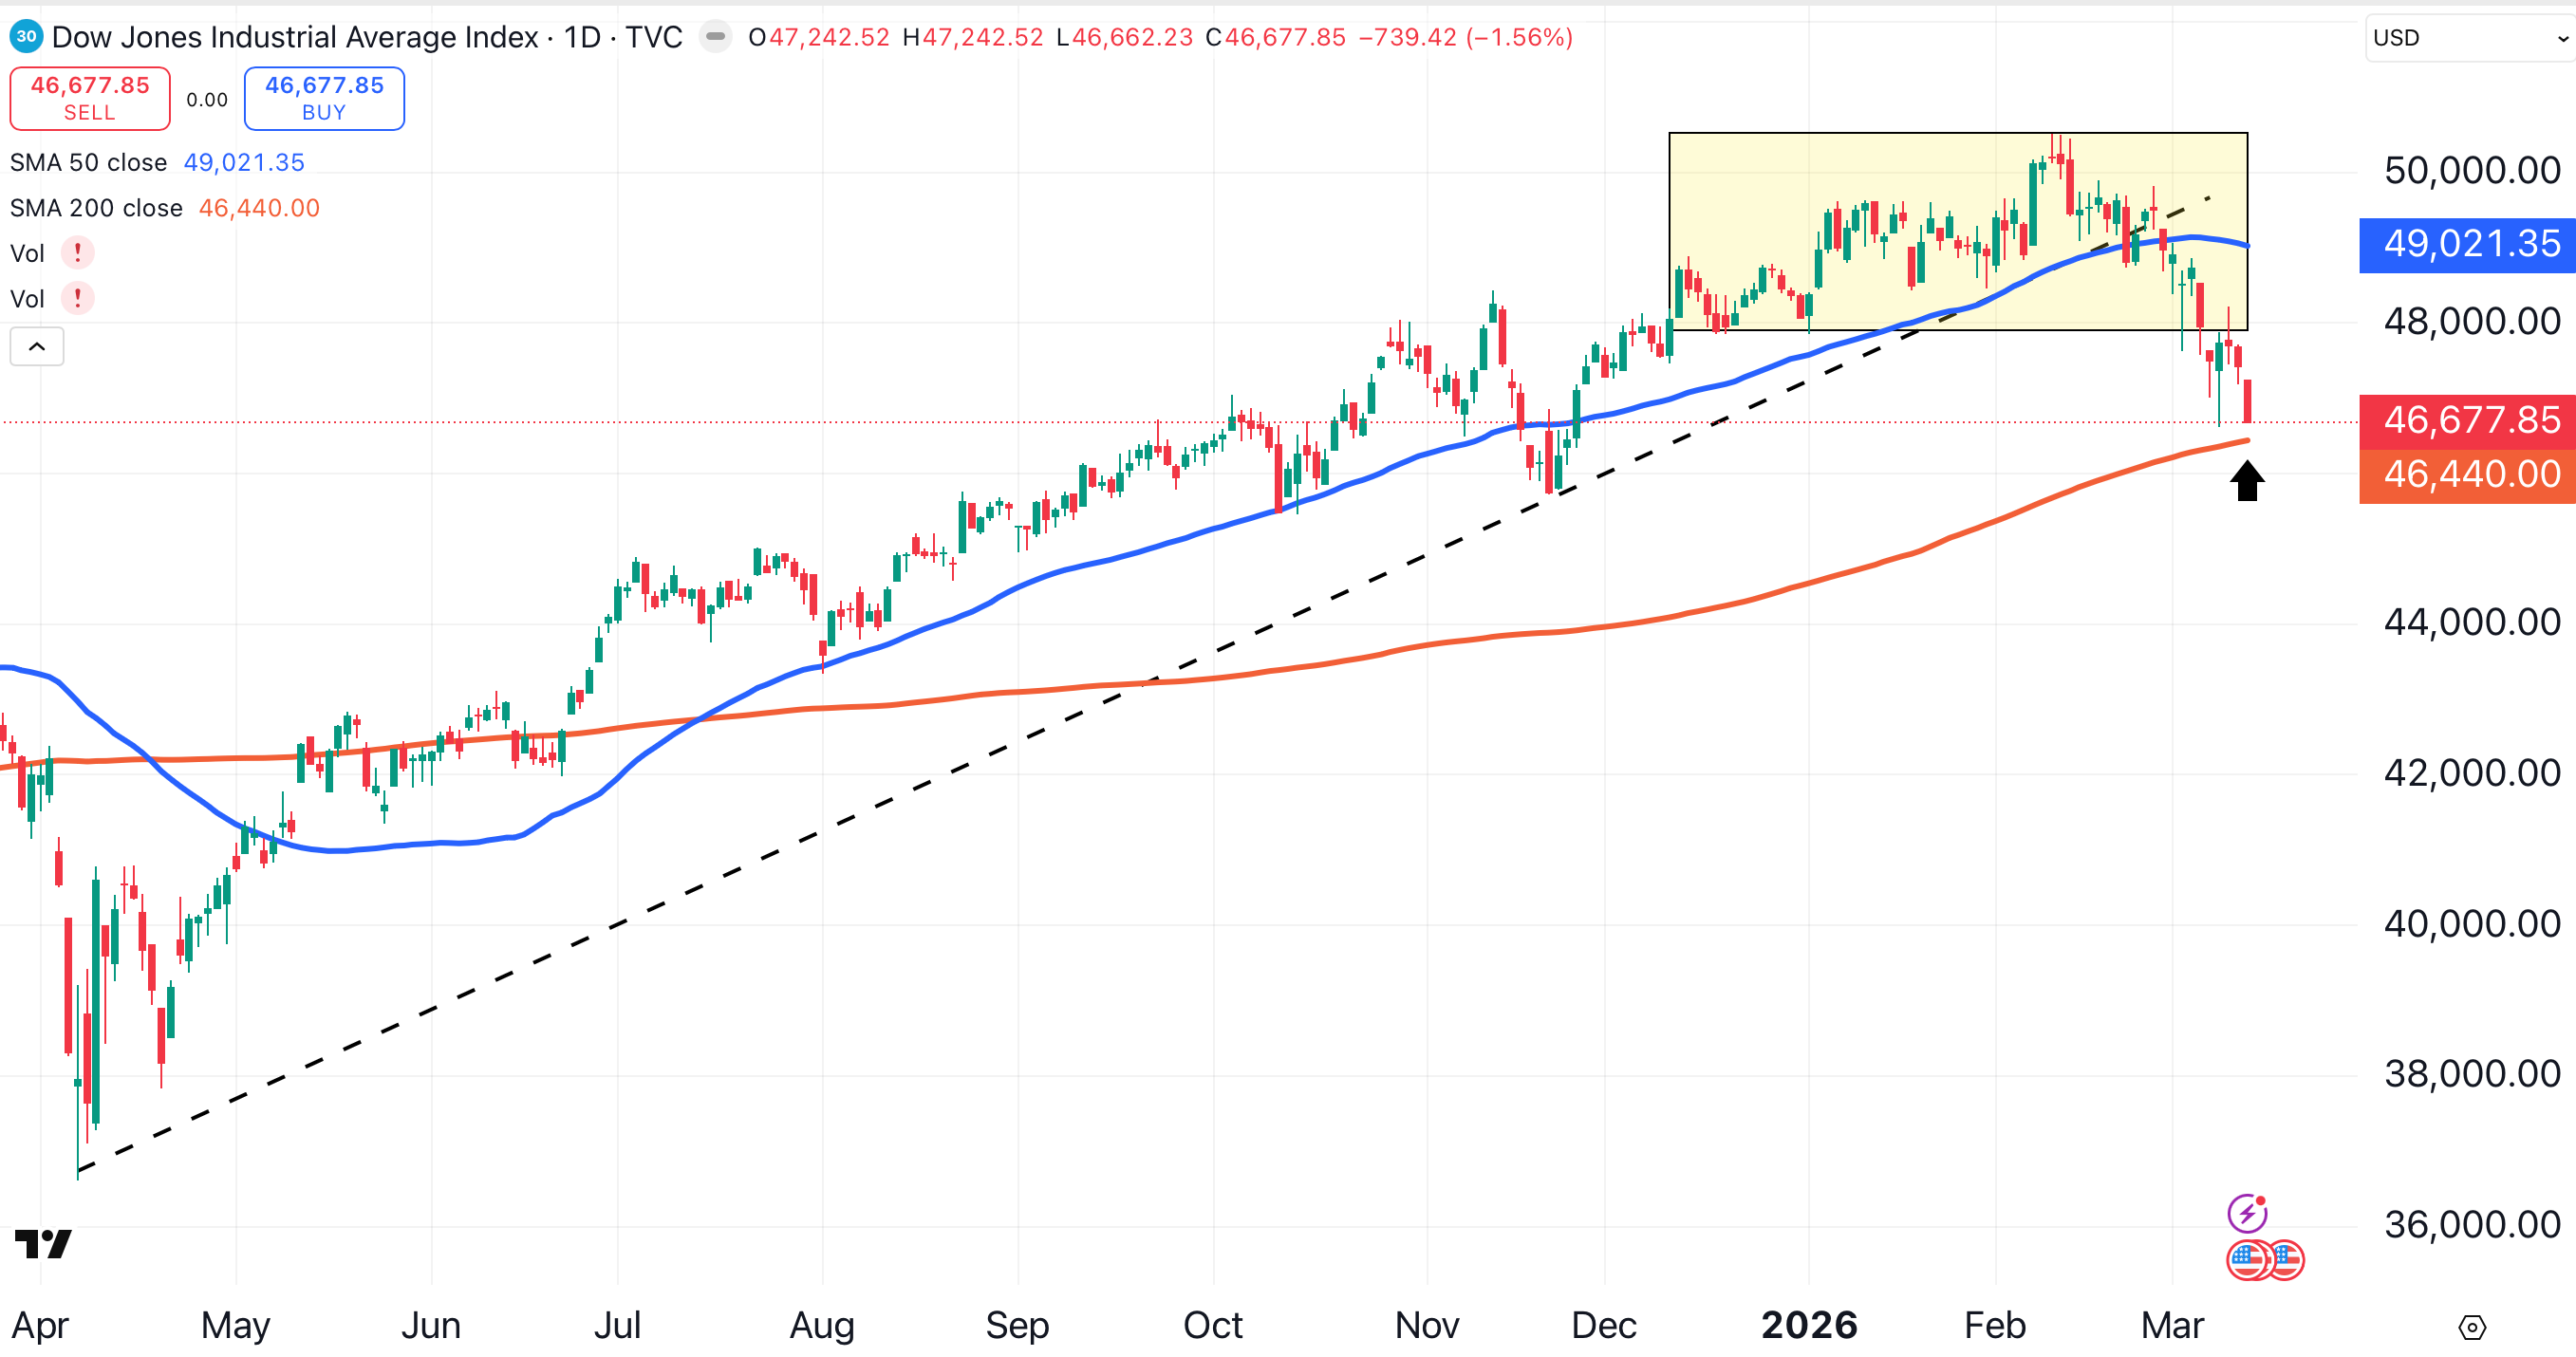
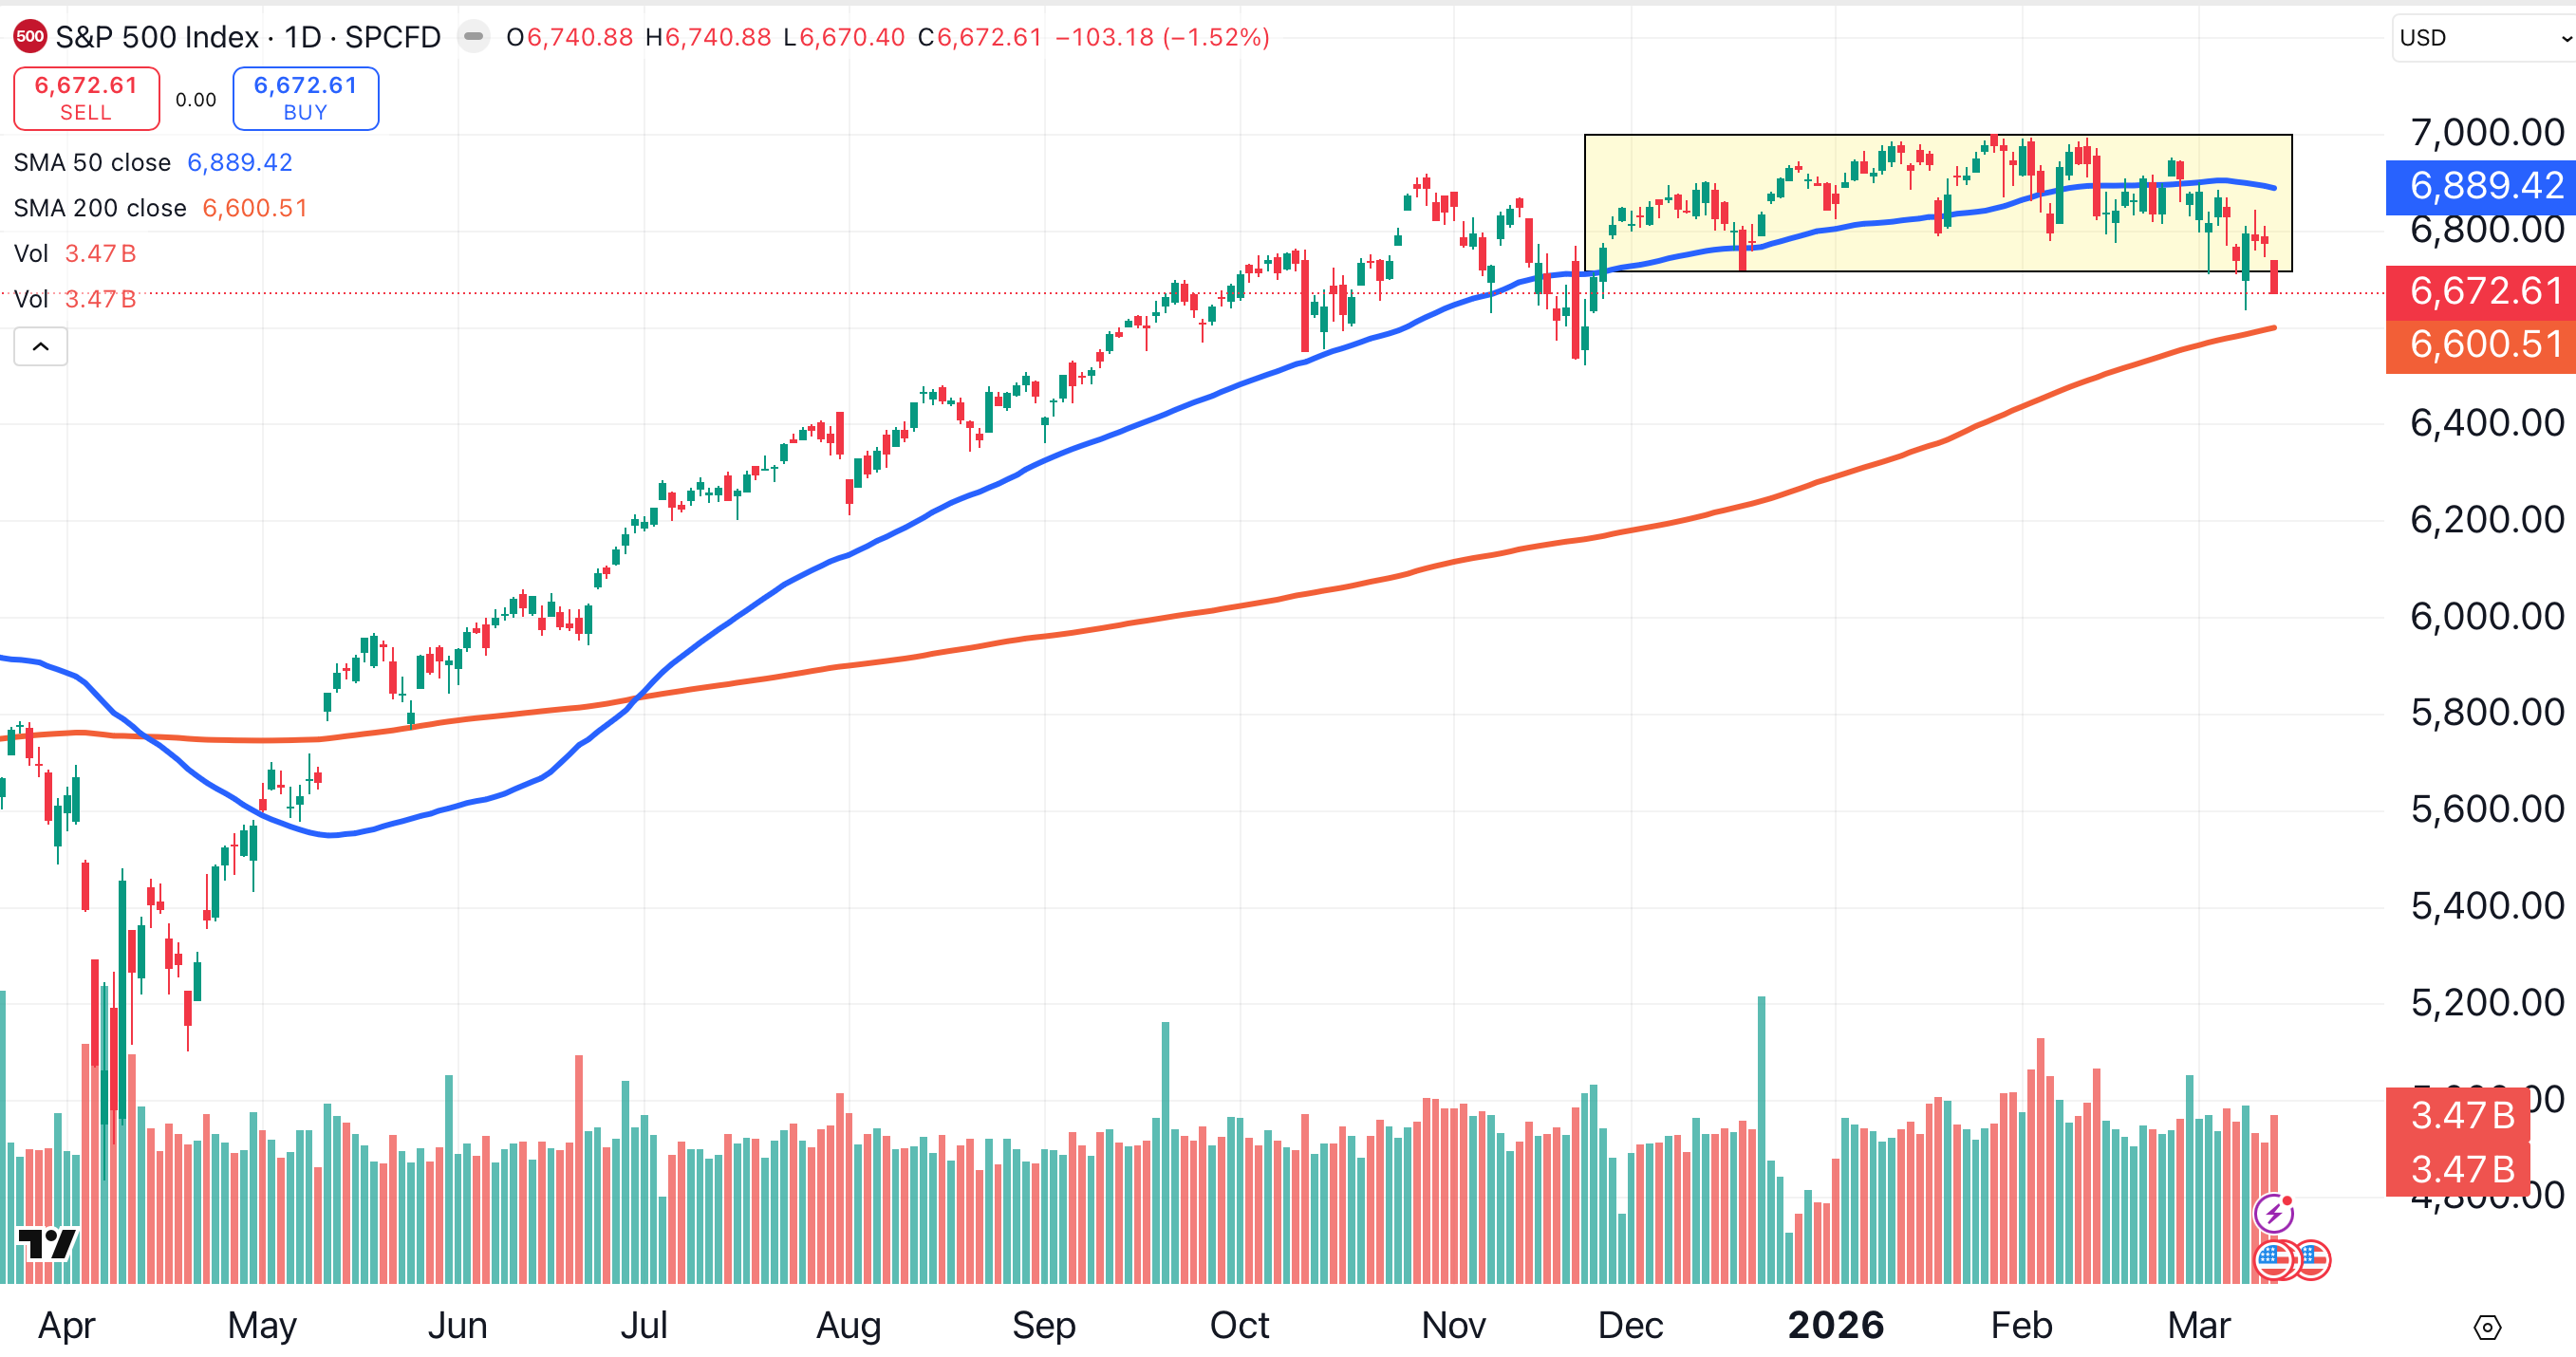
The S&P 500 has also slipped out of its consolidation zone (shaded yellow) to close at a three-month low. On Thursday, the large-cap index closed about 1% above its 200-day MA (red).
The Chart You Need to See Right Now
It may not seem like it, but the recent pullbacks in the major averages have been shallow.
If you don’t believe me, check out the monthly charts of the Dow Jones Industrial Average (left, below) and the S&P 500 (right, below). Hopefully this provides investors with some perspective on current market activity.
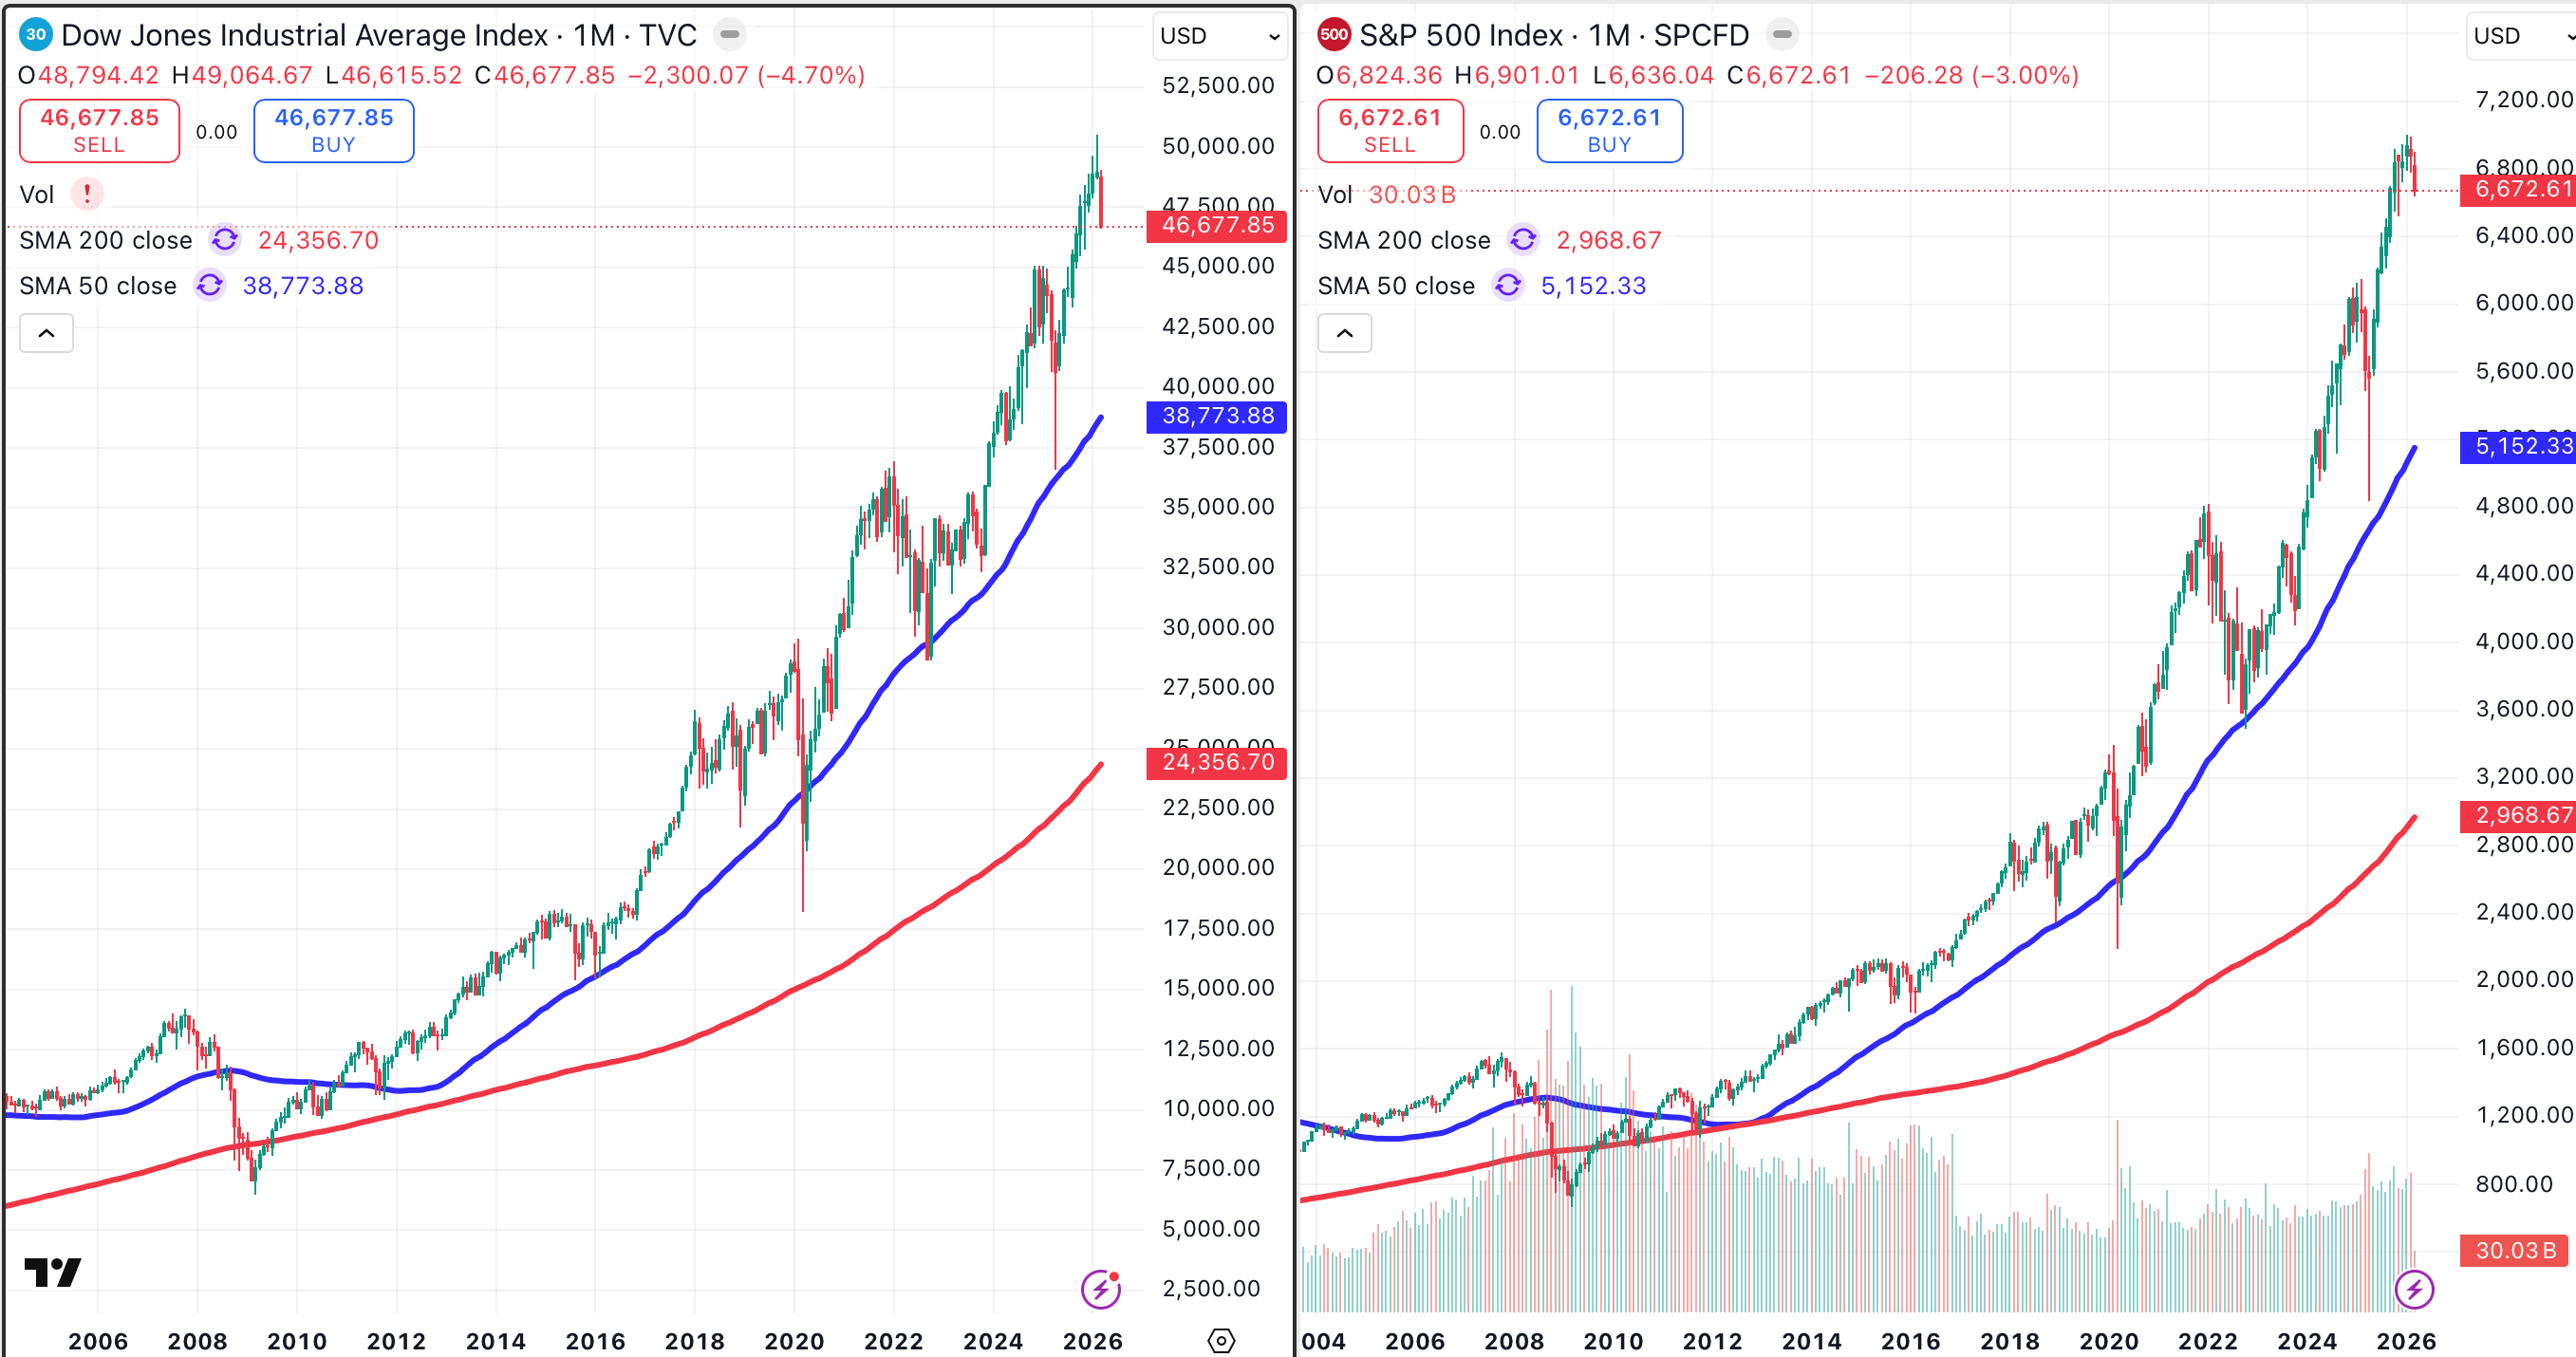
If you saw only the two charts above, you’d be a buyer — that is, unless you were concerned about buying too high. You might be waiting for a deeper pullback, but you’d certainly be bullish.
Nvidia’s Herculean Effort
The indexes would be in worse condition if not for the Herculean efforts of Nvidia (NVDA) . Nvidia is a Dow component, as well as the largest stock on the market-cap weighted S&P 500 and Nasdaq Composite indexes.
Unlike the major indexes, Nvidia refuses to break down from its consolidation zone (shaded yellow). This stock has bounced sharply from its 200-day MA (red) on two recent occasions (arrows).
This bullish activity tells us that Nvidia is stronger than the broader market right now. This stock has been a pillar of strength, but can Nvidia continue to support the major indexes?
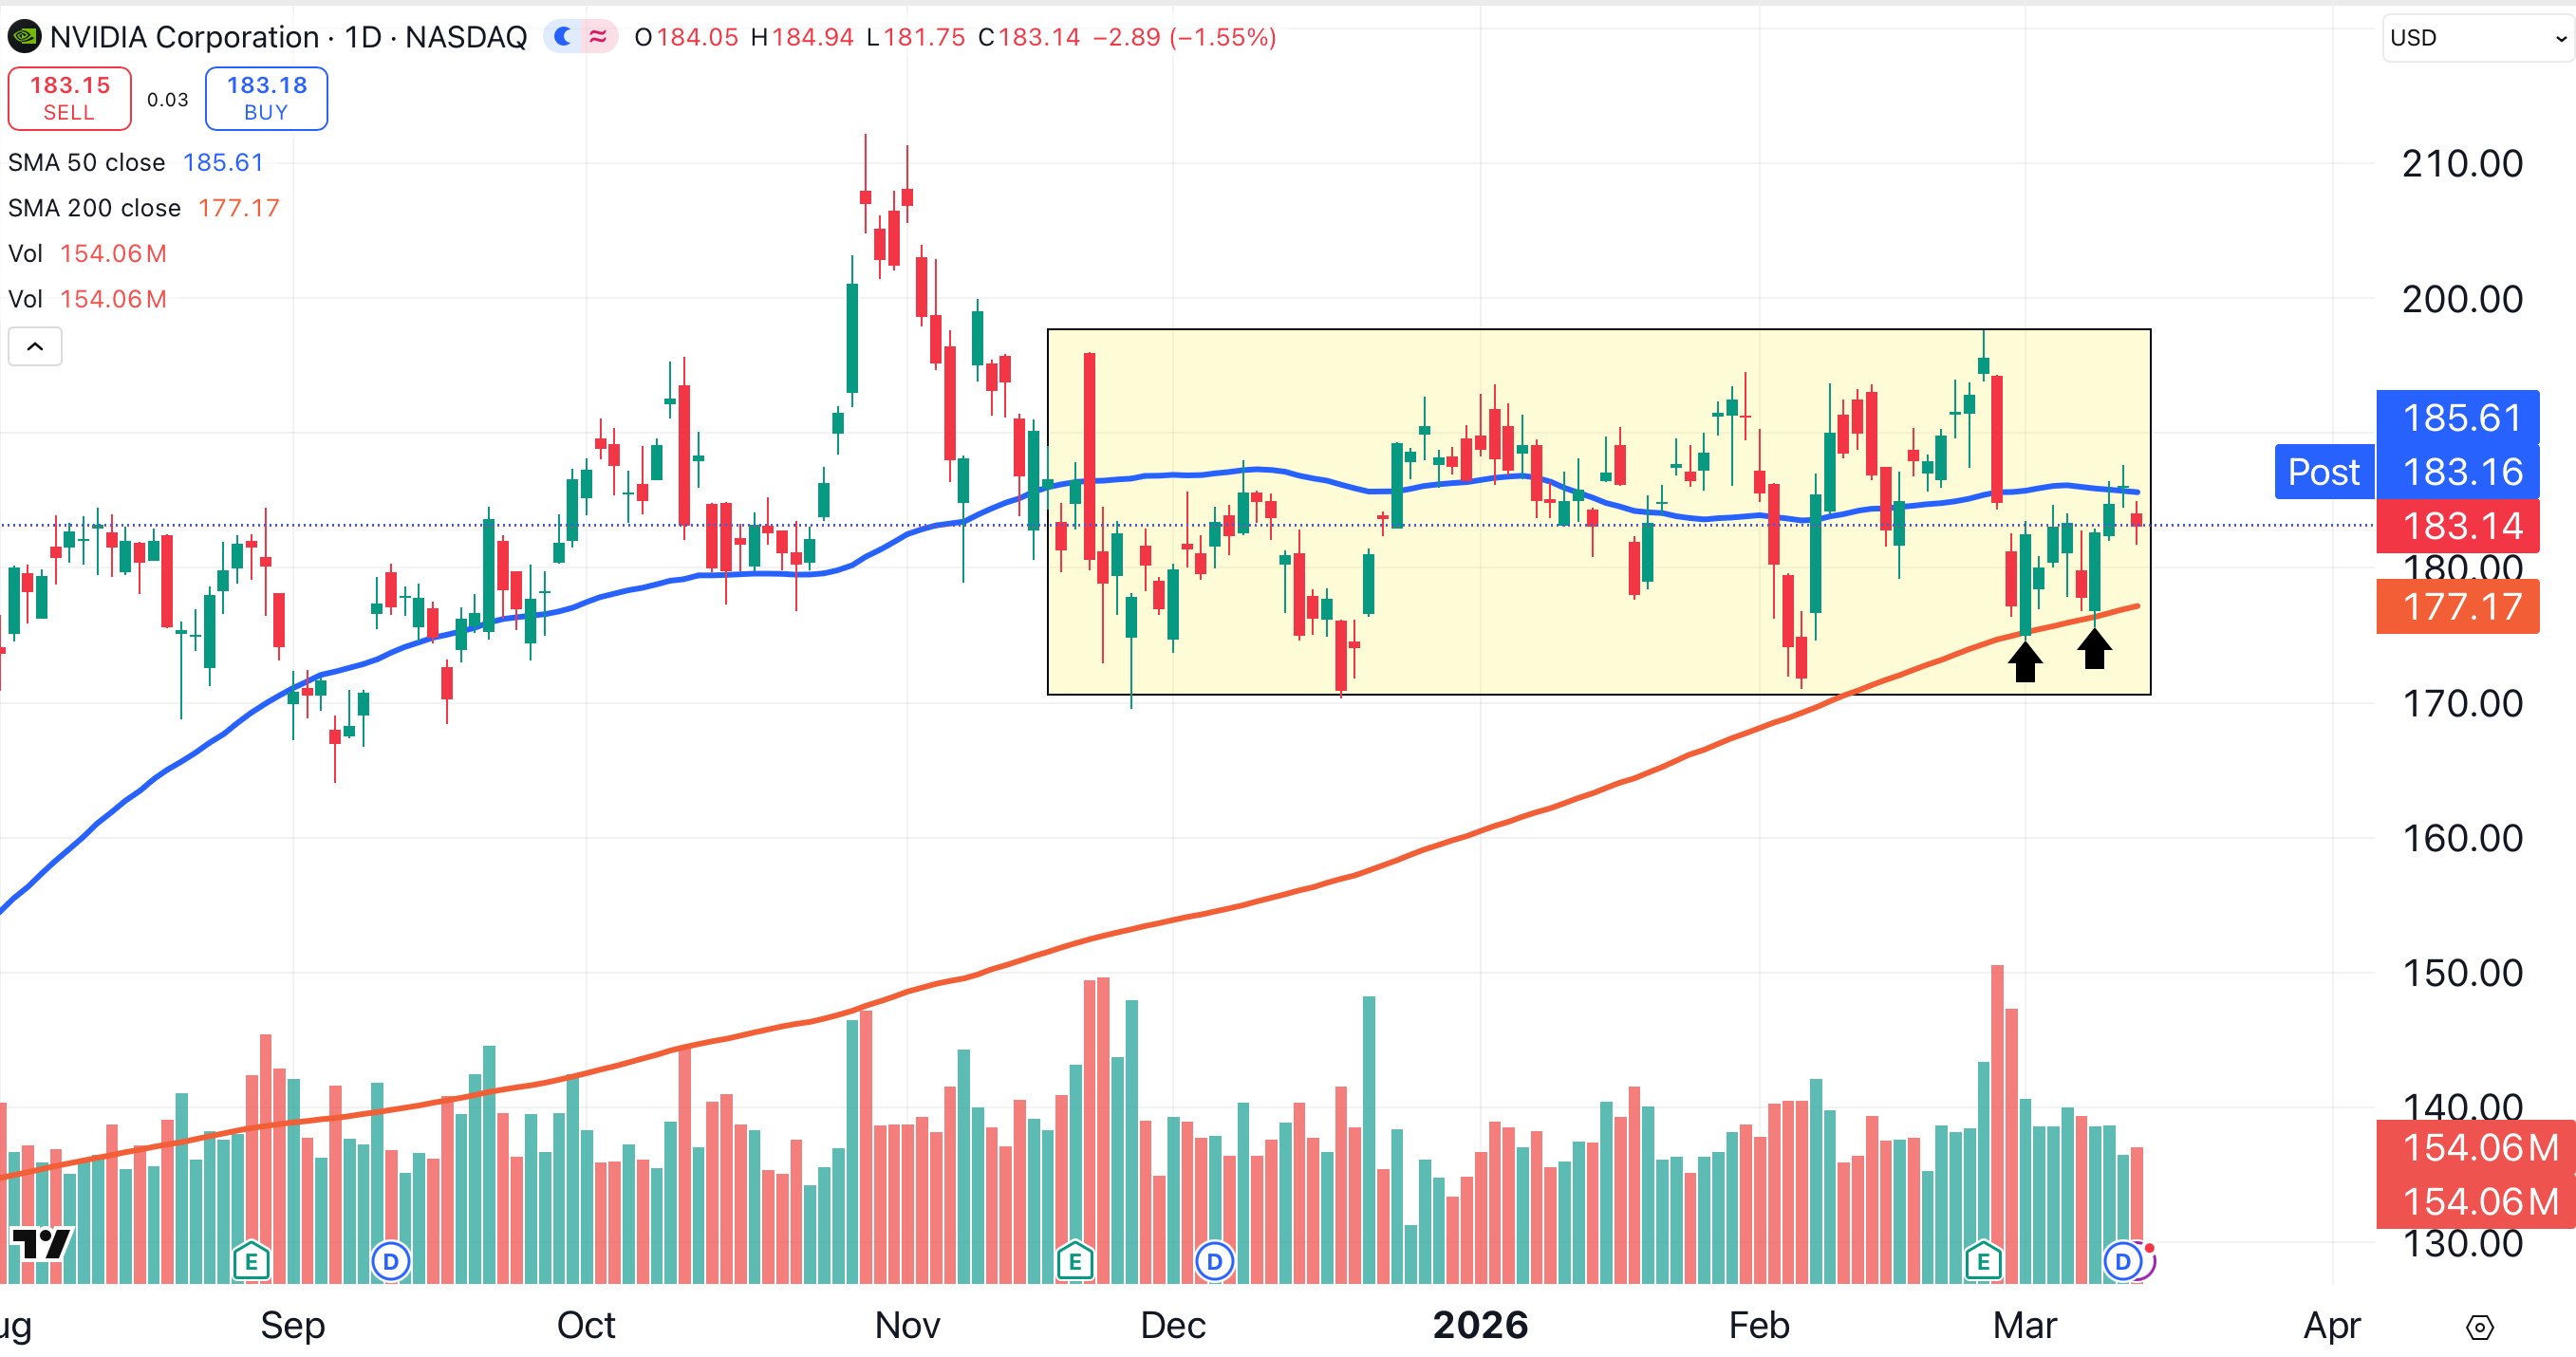
In order to remain within that consolidation zone (shaded yellow), Nvidia needs to stay above $170. Nvidia’s last close below $170 occurred on September 8 of last year.
Update on Callaway Golf
Yesterday, I received a note from a reader asking for an update on Callaway Golf (CALY). When we bought the stock in December, we liked Callaway’s decision to sell a 60% majority stake in Topgolf.
The stock’s chart agreed, so we took a long position at approximately $11.50. The stock subsequently climbed to $16.65, a rally of 44% in just one month.
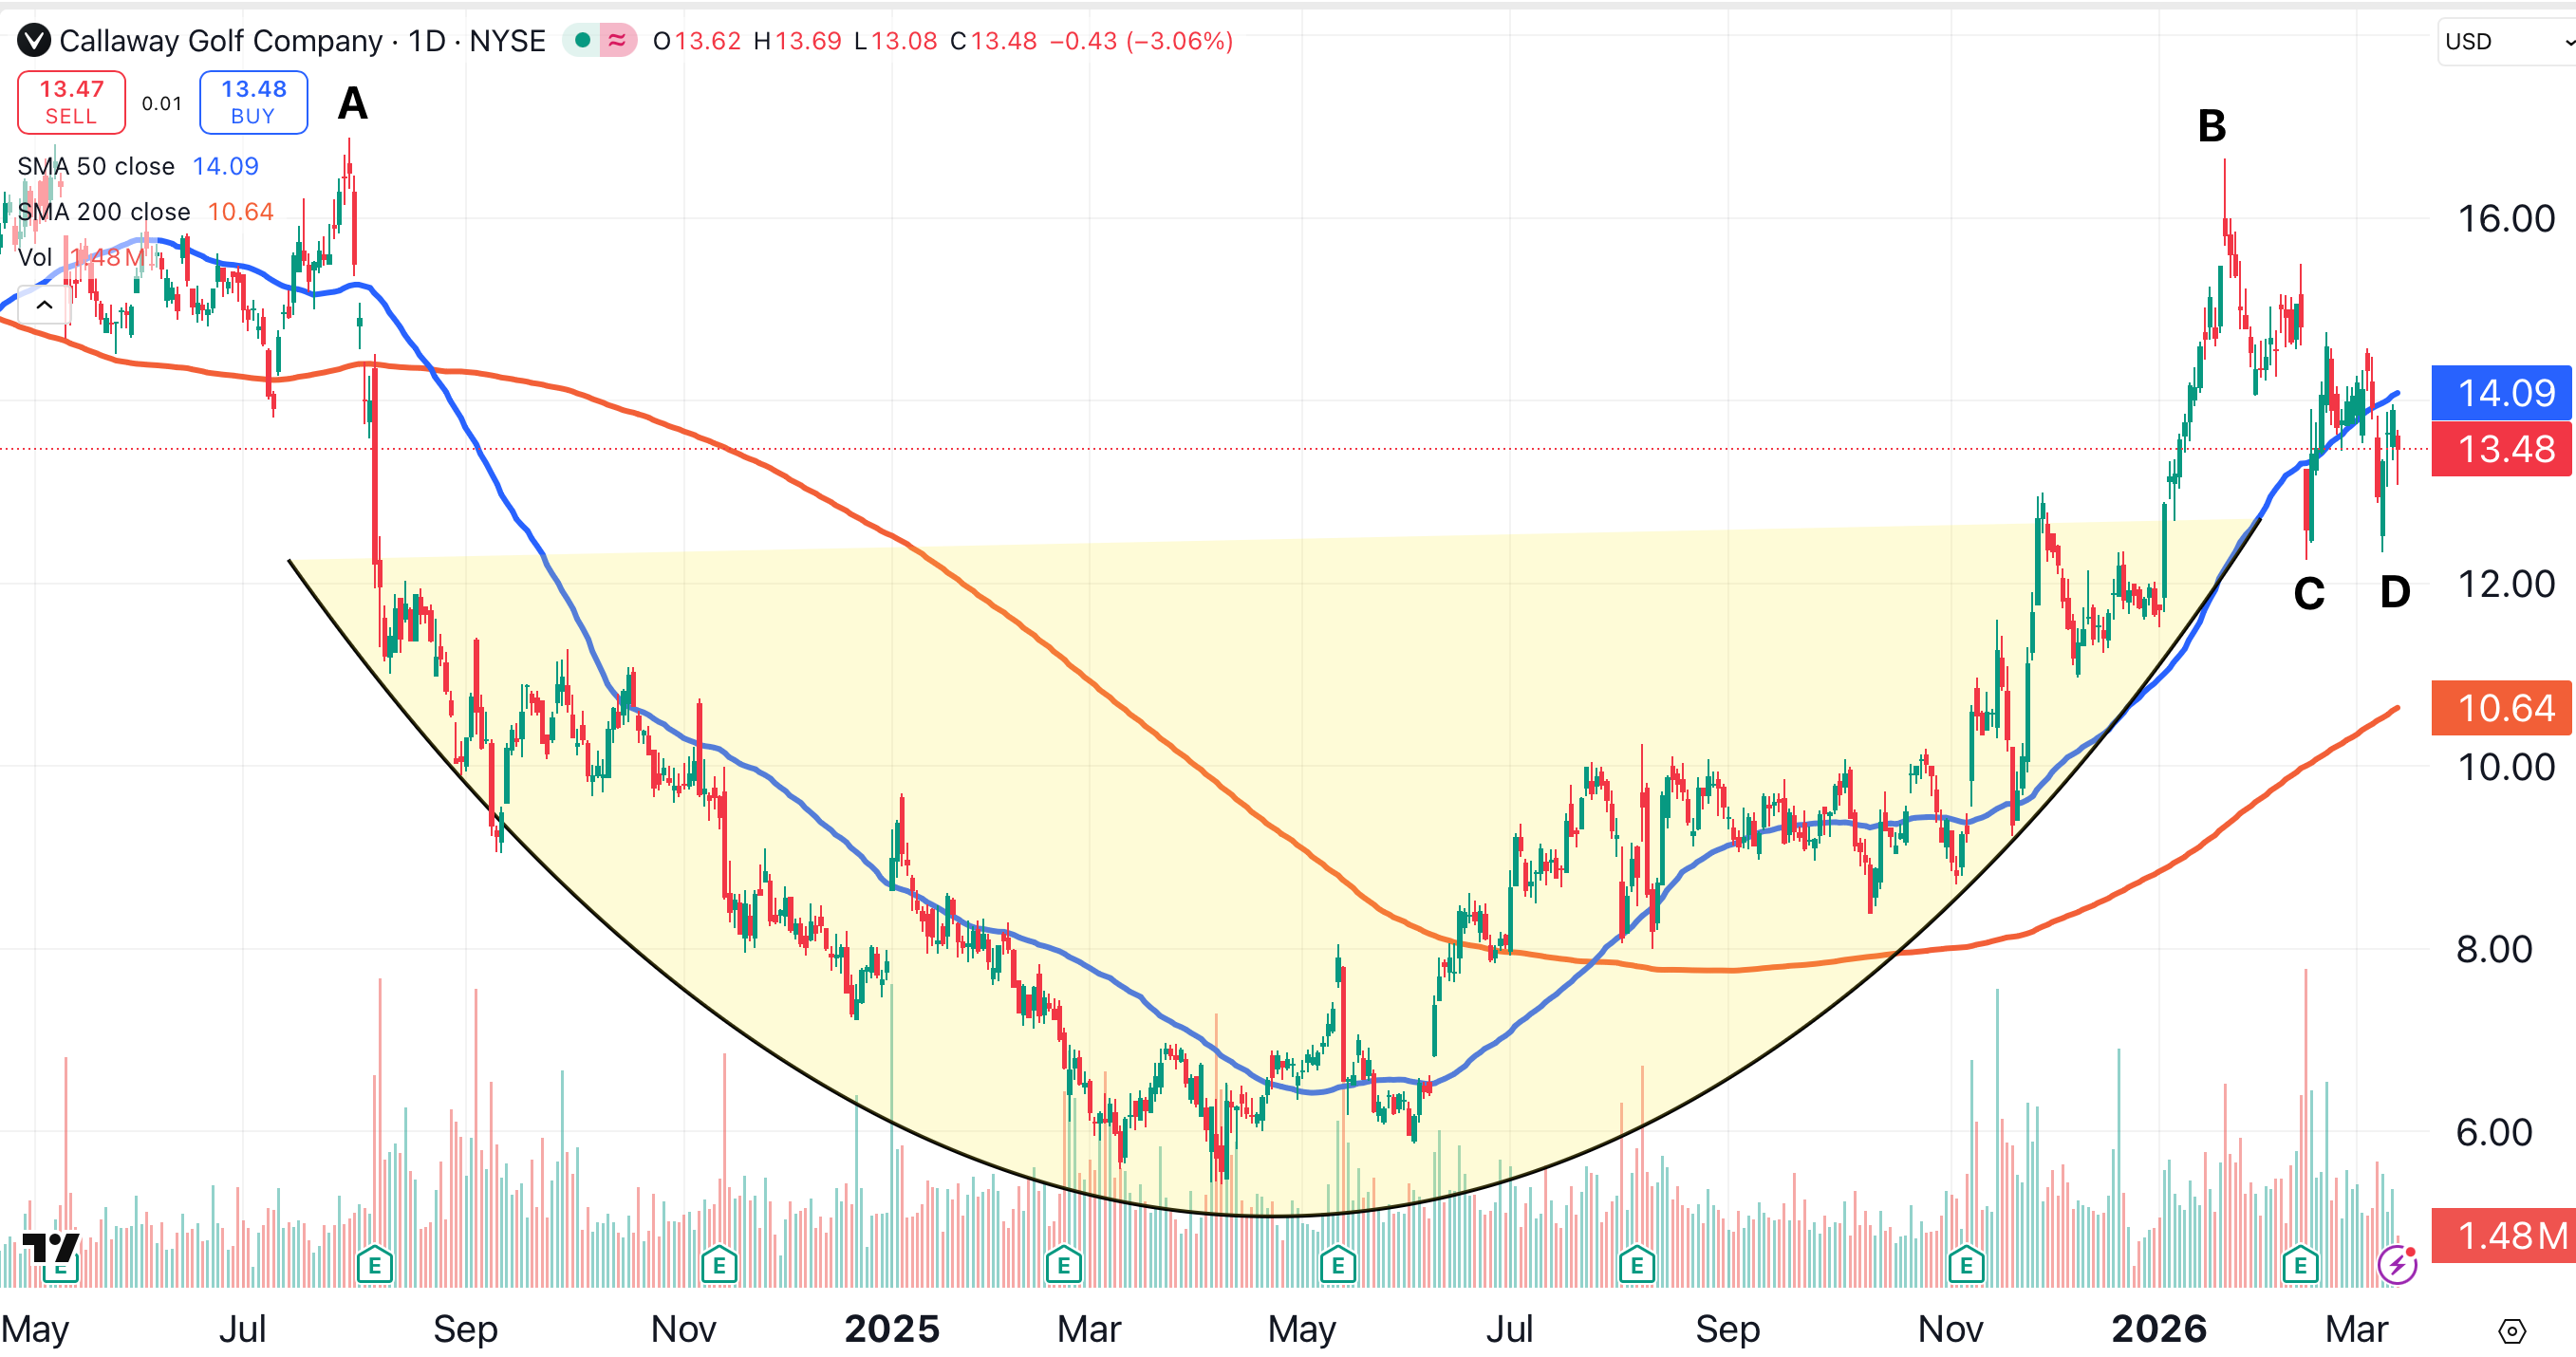
The stock’s next resistance level was $16.89, the July 2024 high (point A). Callaway’s recent failure to breach that level (point B), combined with the opportunity to take a quick short-term gain, led to closing half of our position.
More recently, Callaway found strong support just above $12.25 (points C and D). If the price breaks below that level, we’ll close the remainder of the position. This is a fairly typical example of trade management.
Related: The Biggest Market Obstacle: Oil Is Still Too Cheap
At the time of publication, Ponsi was long NVDA and CALY.
