No Longer Overbought, but Don't Get Comfortable Here
The indicators have backed off a little, but let's review key charts to see what's next.
You've reached your free article limit
You've read 0 of 1 free Pro articles.
I want to begin by reporting that I am no longer typing 2025 at the top of my pages. My fingers have finally found the 6 key, so that it now feels natural to type 2026. But does that mean that 2026 is shaping up like 2025? I still believe the answer is no. I still believe the pattern will be different.
The most obvious difference is that the 493 have been the leaders in the first two weeks of the year, which was not the case last year. And they did not get hit nearly as much as the index movers and tech in general on Tuesday. But that doesn’t mean you should get comfortable.
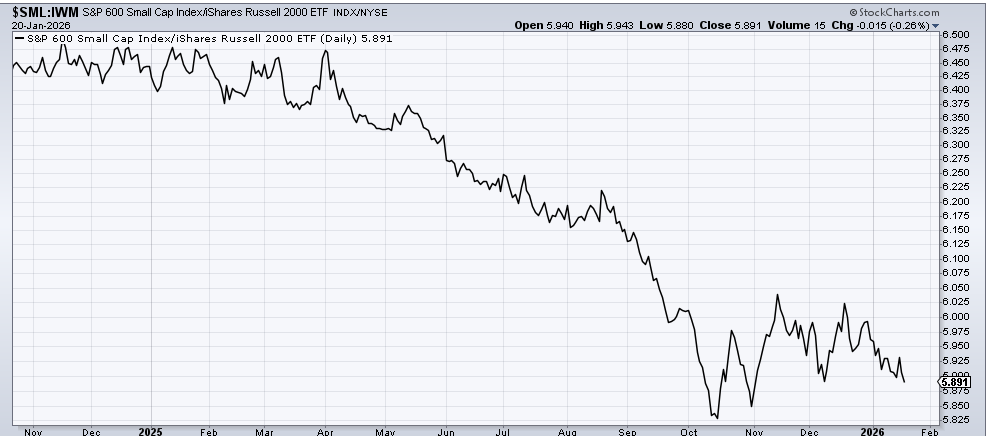
Let’s go back to the chart of the Small Caps that are profitable (SML) compared to the IWM (unprofitable). That ratio peaked a month ago and has been making lower highs and lower lows since. Tuesday, that continued. So maybe we should stop saying ‘small caps’ because it’s clear not all small caps are created equal.
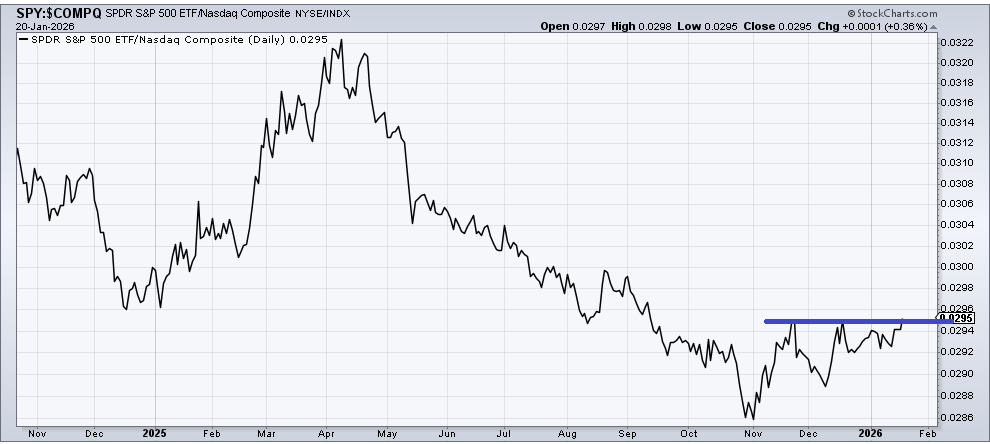
In any event, it is time to check in on the ratio of the S&P to Nasdaq because it has inched back up to the level it has failed at in both November and December. If it breaks out like it means it, that tends to be overall bearish for the big-cap indexes. It did that in early 2022, and it did so in February last year.
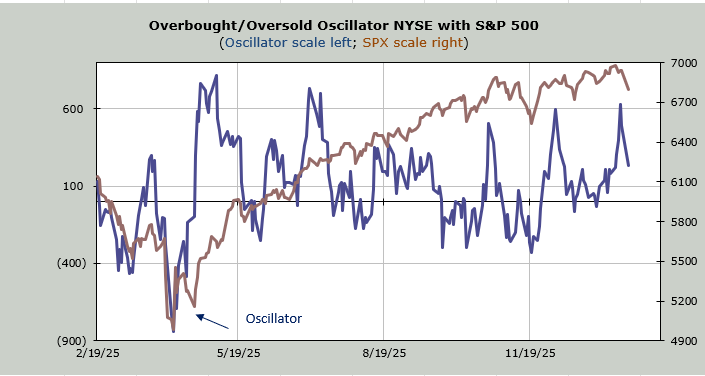
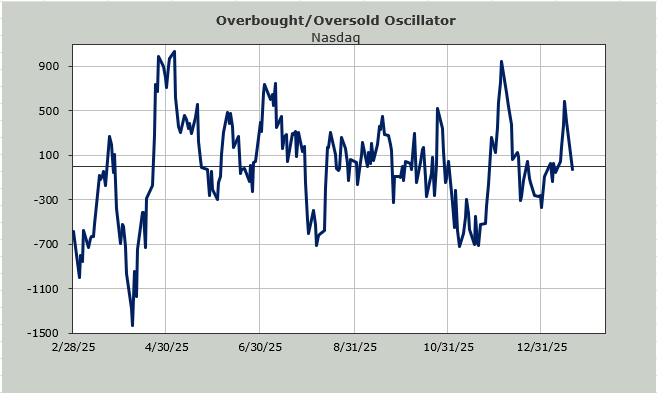
As for Tuesday’s sell-off, it certainly took the Overbought/Oversold Oscillator off the extreme overbought reading, but we are still overbought, or at least not oversold. To get oversold, we are going to need more than two days of negative breadth readings.
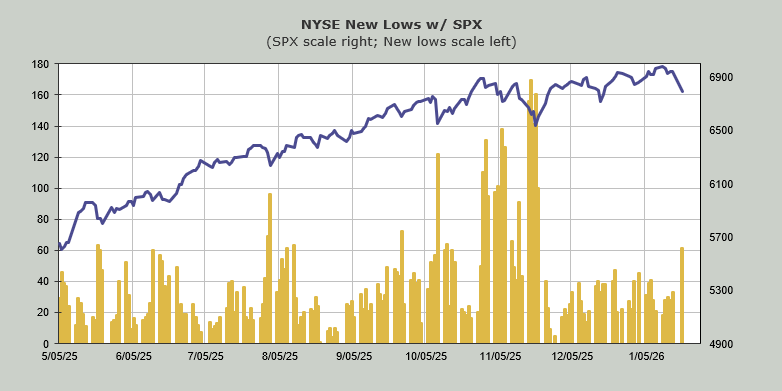
The number of stocks making new lows on the NYSE nearly doubled from Friday, and now number the most since the November sell-off.
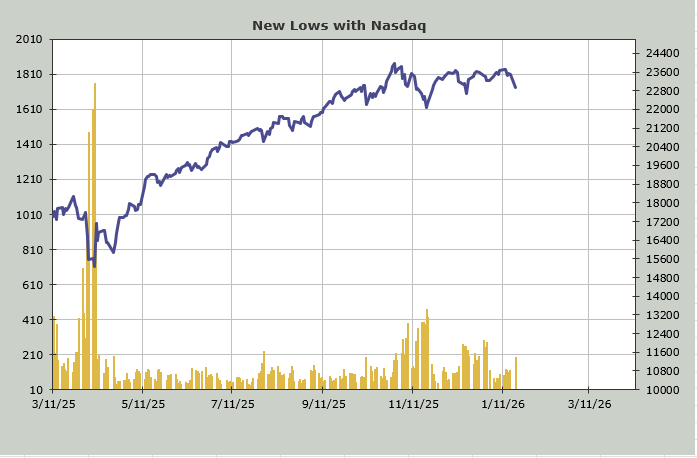
Here’s the interesting part: Nasdaq, where supposedly all the selling was, did not see a similar surge in new lows. Its new lows –for now—remain under the mid-December readings.
I think sentiment did not get cautious or panicky. We saw the put/call ratio elevate to .87. The S&P fell more than two percent, and we couldn’t even get a put/call ratio over .90.
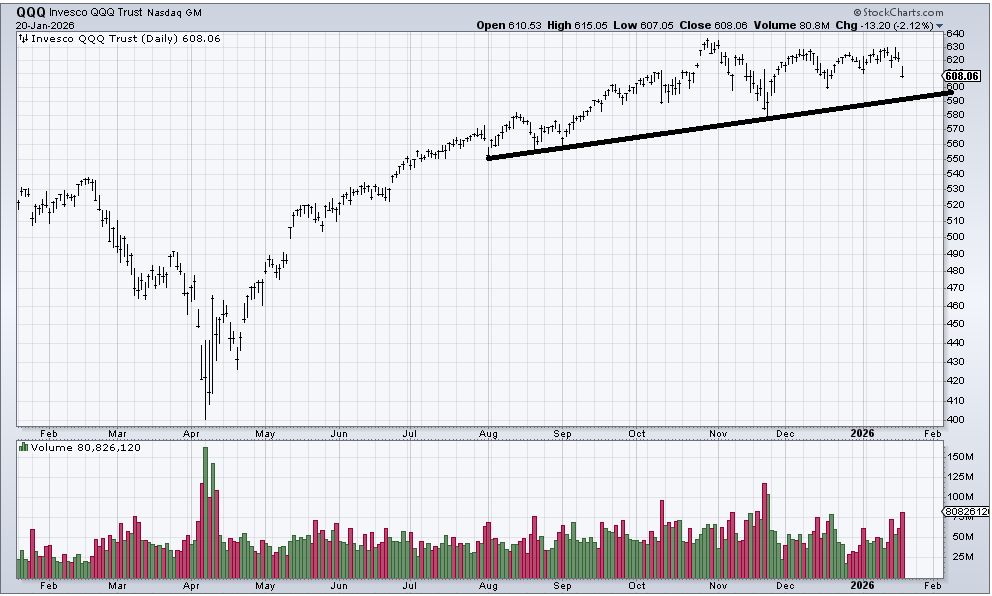
We saw some level of concern creep into the QQQs as volume topped 80 million shares. We got to over 100 million shares in November. At the time, I said that was not panicky the way it was in April, but it was enough to get a bounce. We ought to see more volume in the QQQs before this correction is done, but this is a step in the right direction.
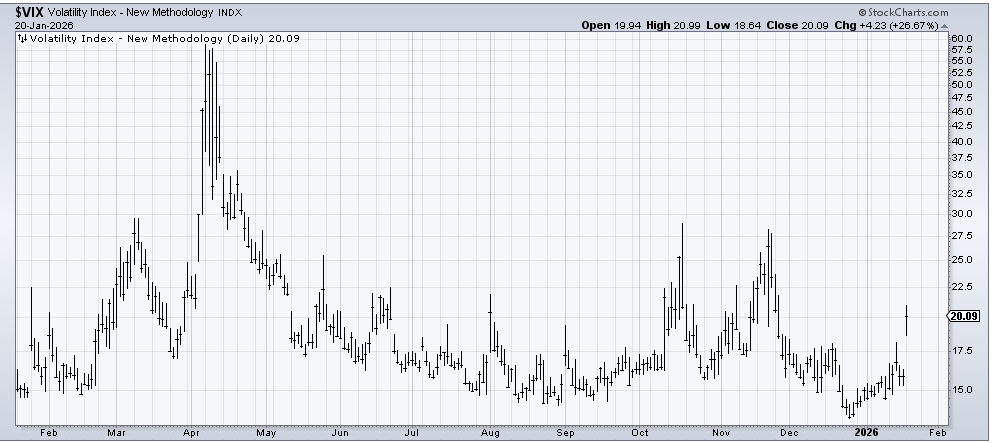
Finally, there is the VIX. I have been expecting a surge in volatility for a few weeks now. One reason was the pattern that I saw shaping up, but another was that almost every month has seen a surge, and December had not seen one, so we were due.
I don’t see this as ‘jumpy’ just yet, but at least it has started the process of getting there, and we can be on the lookout.