New Lows Have Told the Story of This Market
Keep a watchful eye to see they continue to contract.
You've reached your free article limit
You've read 0 of 1 free Pro articles.
The market got short-term oversold the first week of March. It took a bit of time for it to find its footing, but it did so.
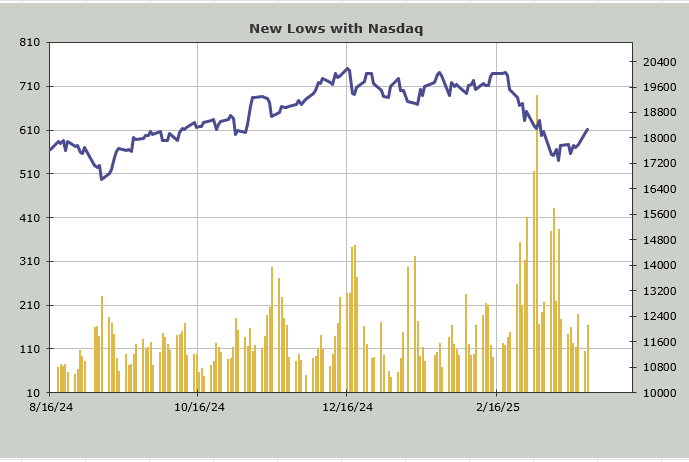
First, we saw the number of stocks making new lows contracting, showing their downside momentum had slowed considerably. By the time Nasdaq was down another thousand points, the majority of stocks were making higher lows. That’s what this chart tells us.
The chart also tells us to keep a watchful eye on new lows again because despite Nasdaq not being red on Tuesday, the new lows increased somewhat. Bulls do not want to see this rising up over 200 again, and they certainly don’t want to see that happen while Nasdaq is heading upward.
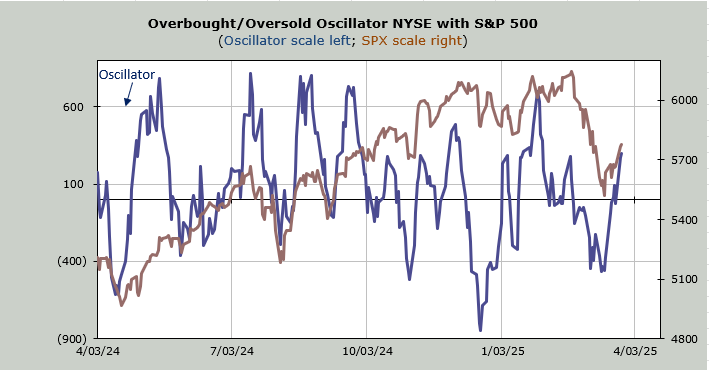
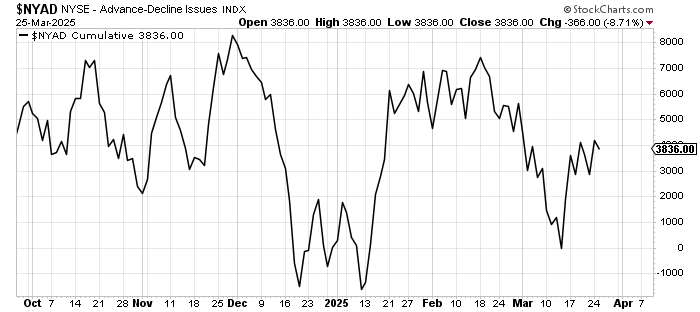
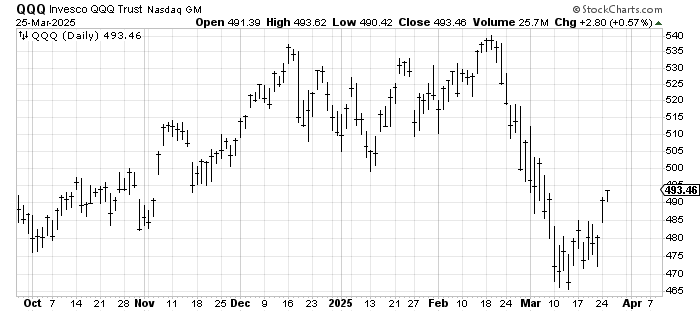
Now, take a look at the chart of breadth on the NYSE and the QQQs. To me, the QQQs contain most of the index movers (not all since the QQQs do not contain financials, and there are several financials that help move the index along). They are almost the opposite of each other.
Coming off that oversold low, the breadth of the market shot up. But since then, it has been a chop fest.
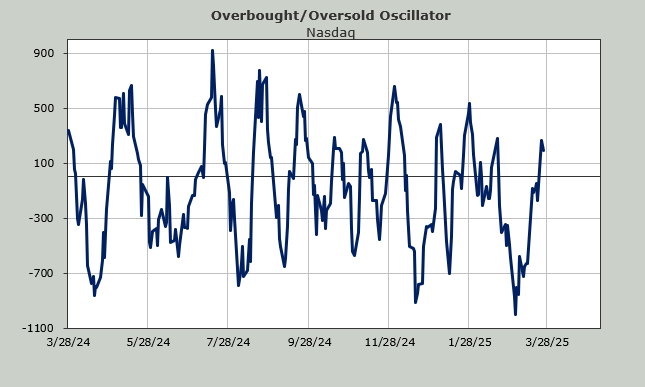
Coming off that oversold low, the QQQs did an awful lot of chopping about. It has only been in the last two days they have shot up. Seems to me we’re back to an Either/Or Market.
Something else was different on Tuesday. Nasdaq was solidly green, but net volume (up minus down) was red, and not by a marginal amount. Upside volume on Nasdaq was 42%. You might recall how I harped away for weeks back in January about all that volume on Nasdaq, and no matter if Nasdaq was up or down, volume was exorbitant and leaned to the upside. I considered that wild speculation.
Since then, we can all agree much of that speculation has been taken out of the market. But with Nasdaq green the last three days, net volume has only been positive one of those days. I am open to comments as to whether I should consider that positive or negative.
It’s positive because I take it to mean the speculators are not rushing in headfirst as they have. But I take it as negative because it also means the rally was narrow!
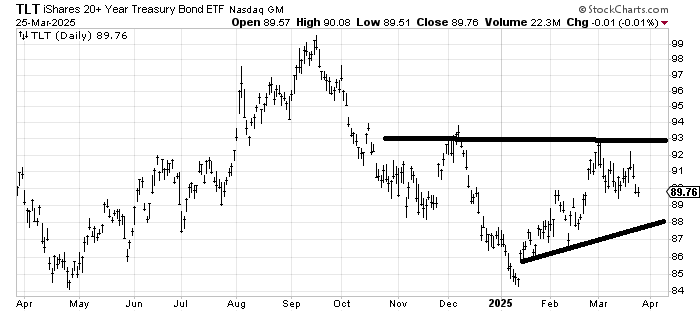
There is one more chart that has captured my attention this week. It’s the Utes. I haven’t said much about them lately because they have mostly been sideways but that is quite a tumble on Tuesday (while bonds were mostly steady). For now, my inclination is that the lower line will hold (around 970-ish), but the Utes haven’t made a higher high since that January rally, so this is concerning.
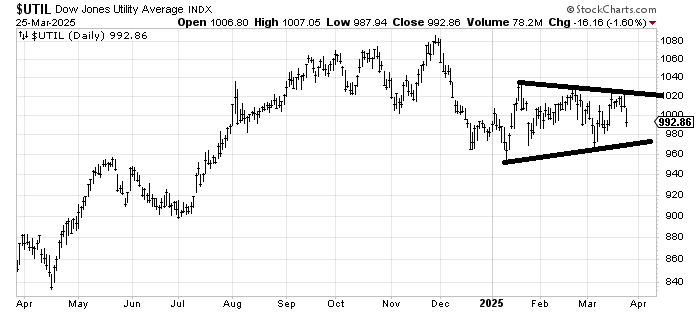
I bring this up because my view on the bonds, using TLT, has been that we’re in a trading range between 88 and 93 for the time being. If the Utes break down, then that raises the chance that TLT breaks down (not my base case).