Narrow S&P Trend Suggests a Breakout Is Imminent
Let's combine two measures of volatility and an analysis of the Fear & Greed index to see what's coming for stocks.
You've reached your free article limit
You've read 0 of 1 free Pro articles.
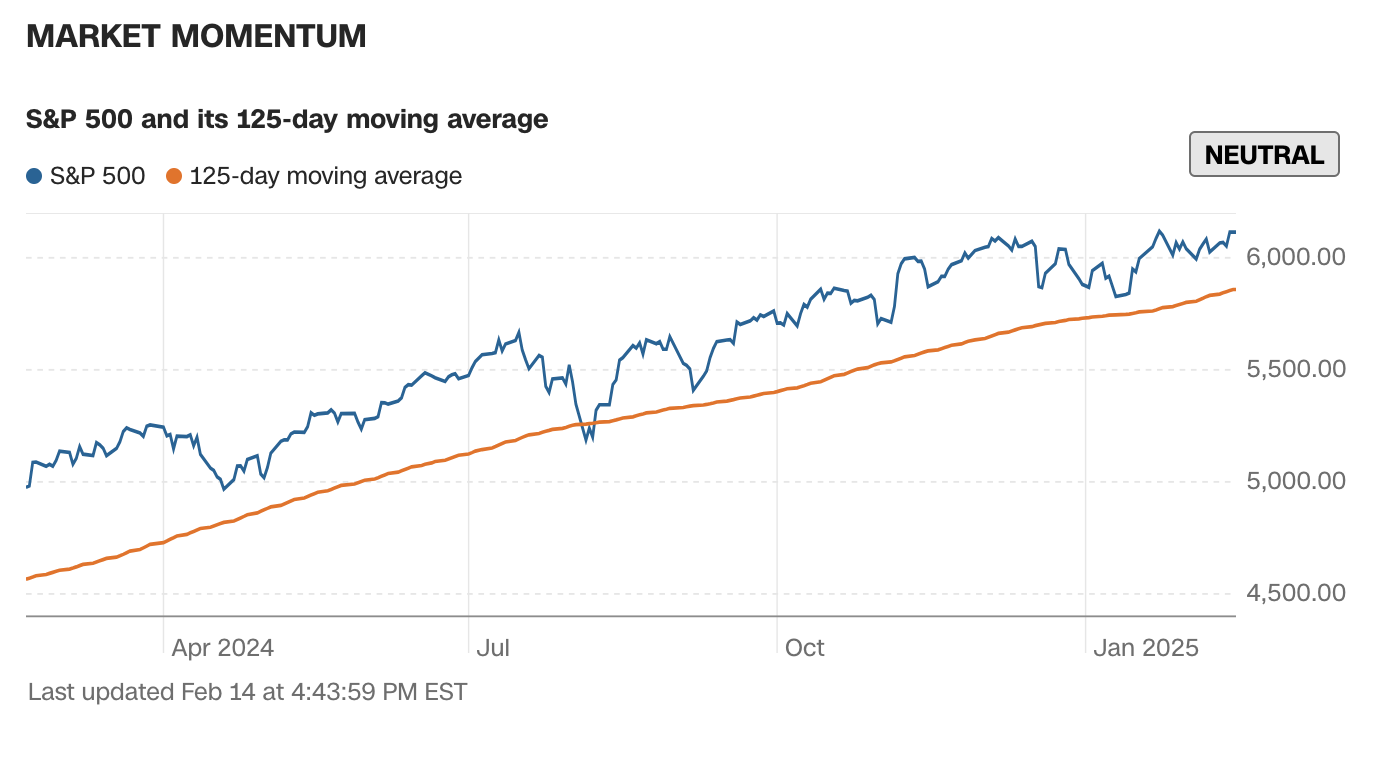
I shared this chart of the S&P 500 in my Weekly Wins column this weekend and wanted to expand upon it to include some discussion of CNN's Fear & Greed Index.
Since election day, the S&P 500 is up just 3%. What’s more, it’s traveled sideways, rather than up, due to some rotation out of at least a few of the Mag 7 names.
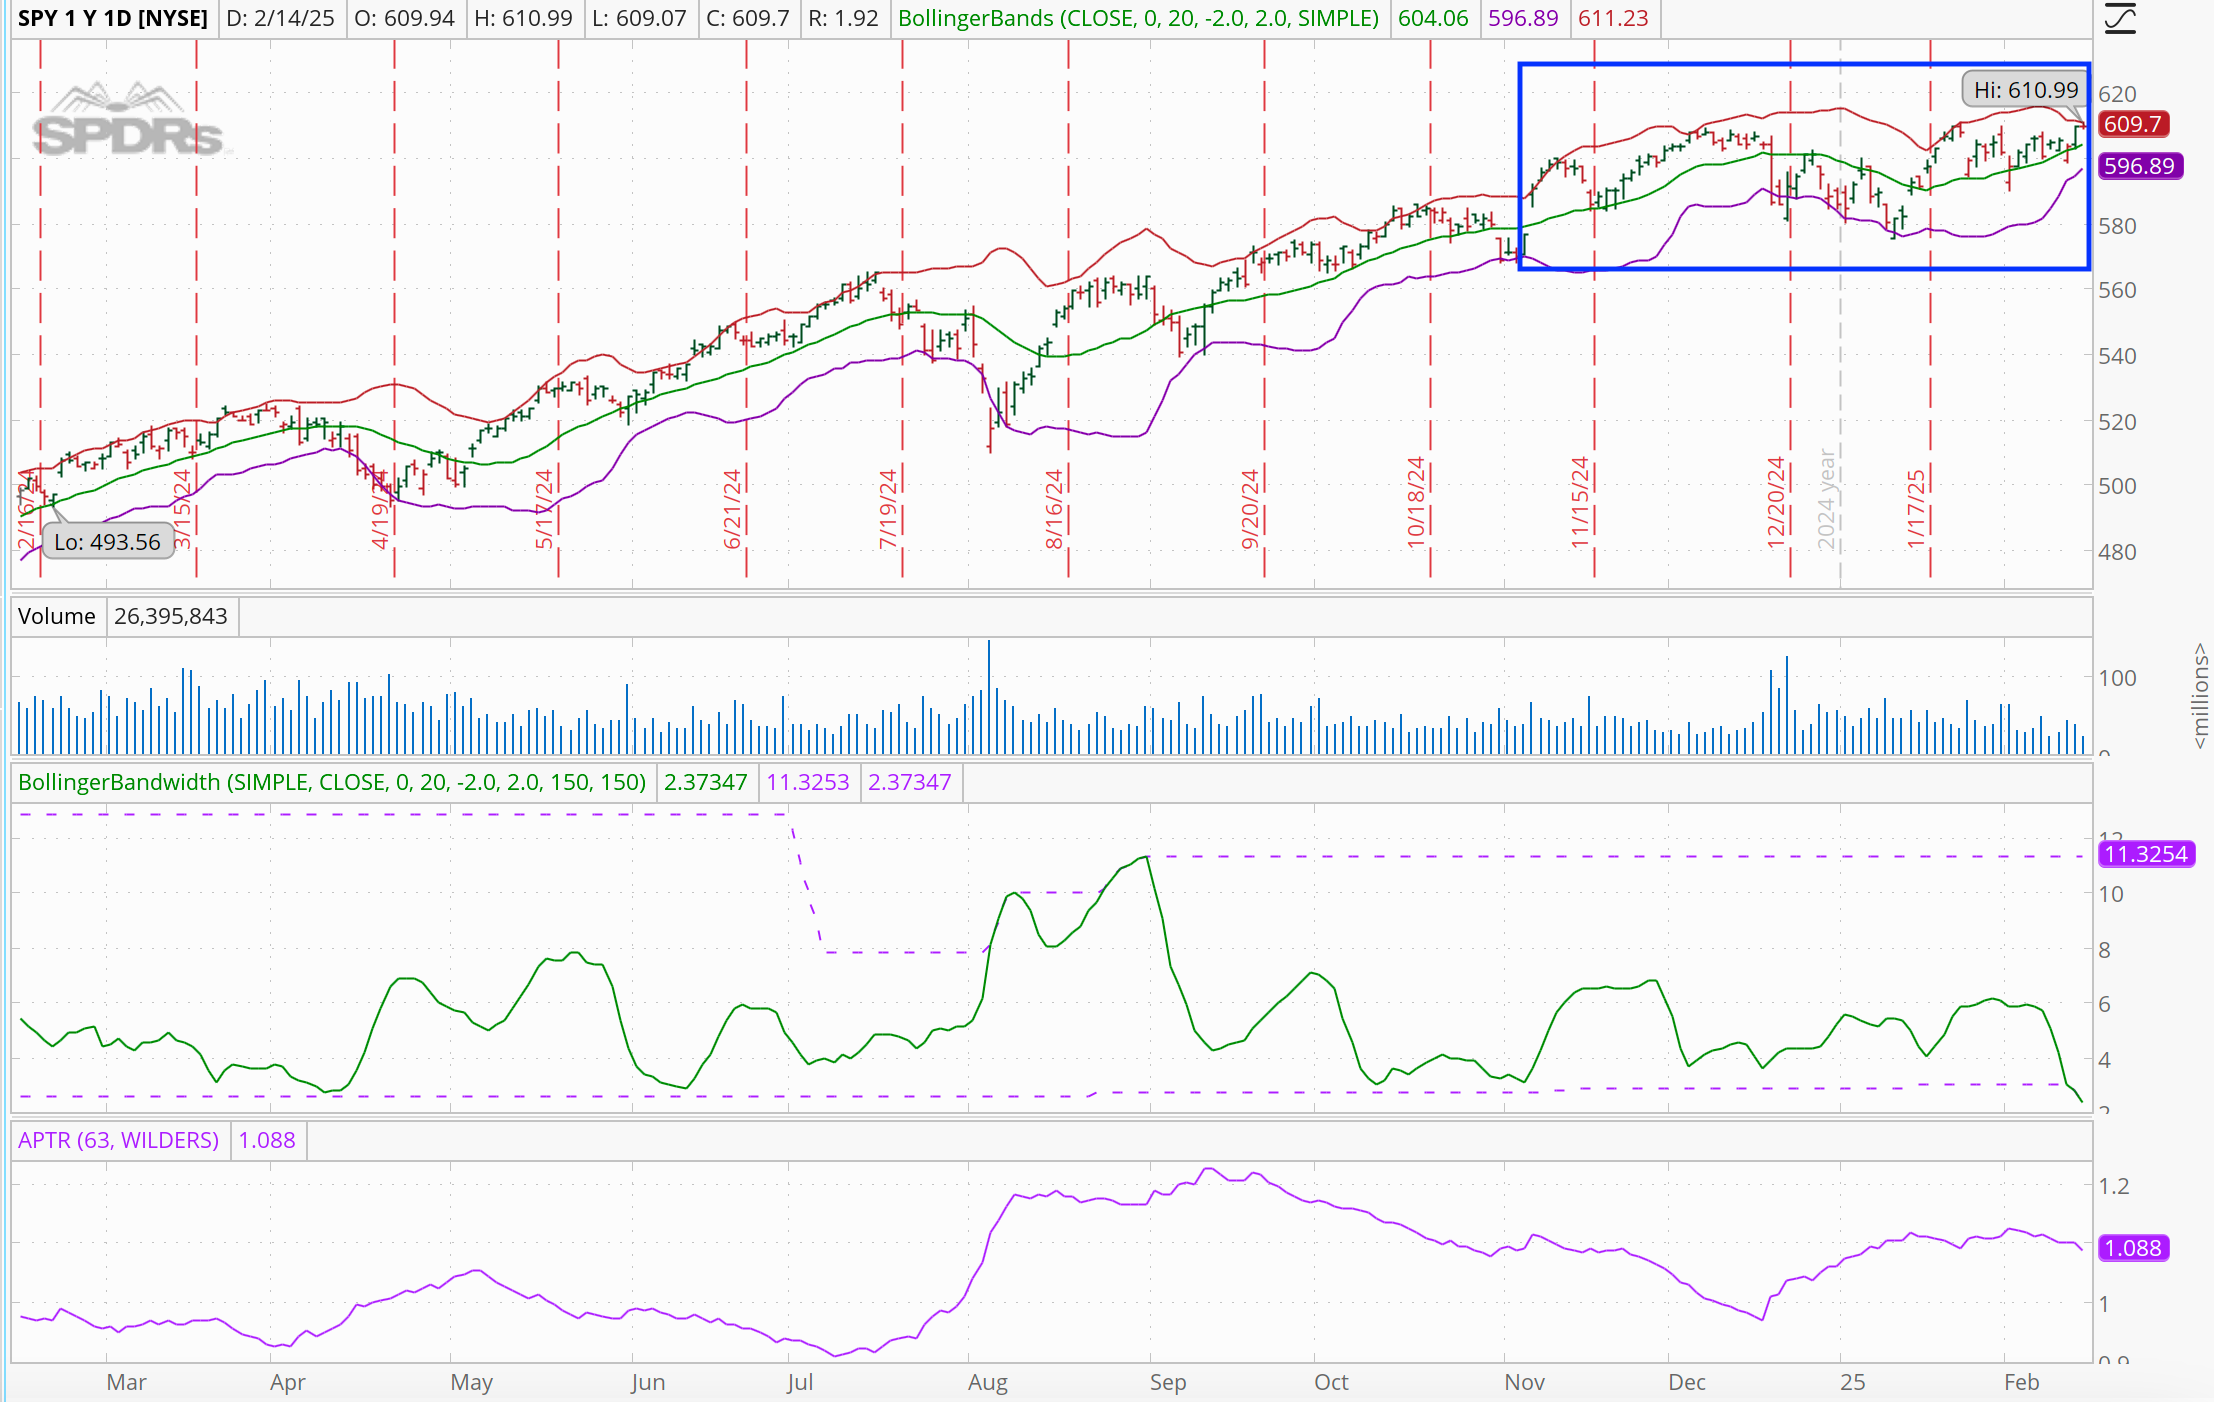
The market has been choppy during this period, and daily volatility, measured by the Average Percentage True Range (in purple), is elevated.
What’s weird is that this volatility hasn’t occurred in a down market, which is when we normally see the highest levels of vol. It’s a reflection of the uncertainty coming out of Washington, as well as the rotation away from MSFT, NVDA, GOOGL, and TSLA.
What I find really interesting, however, are the Bollinger Bands. See how narrow they are? That's the tightest they've been in a year. You can see it even more clearly when you look at the green indicator, which measures the Bollinger Bands’ width. This is a condition that John Bollinger calls the squeeze.
When the bands are tight like this, it means that the market is about to make a big move. The thing is, the bands don’t tell us whether the move will be upwards or downwards. And that’s ok. The good news is that there will be some resolution to this sideways trend as soon as next week.
Can the Fear & Greed Index Offer Any Clues?
Fear & Greed finished last week at 44, just one tick into the Fear zone. Are investors fearful? There’s certainly a lot to worry about. Like stretched S&P 500 valuations and uncertainty coming out of DC.
I’d like to be a bull and would be a lot more comfortable if Fear & Greed could get above 50. But, since December, we’ve been stuck below 50, even as the S&P 500 sets a new high.
See how Fear & Greed dropped in December? I’ve put a blue box around the area in question.
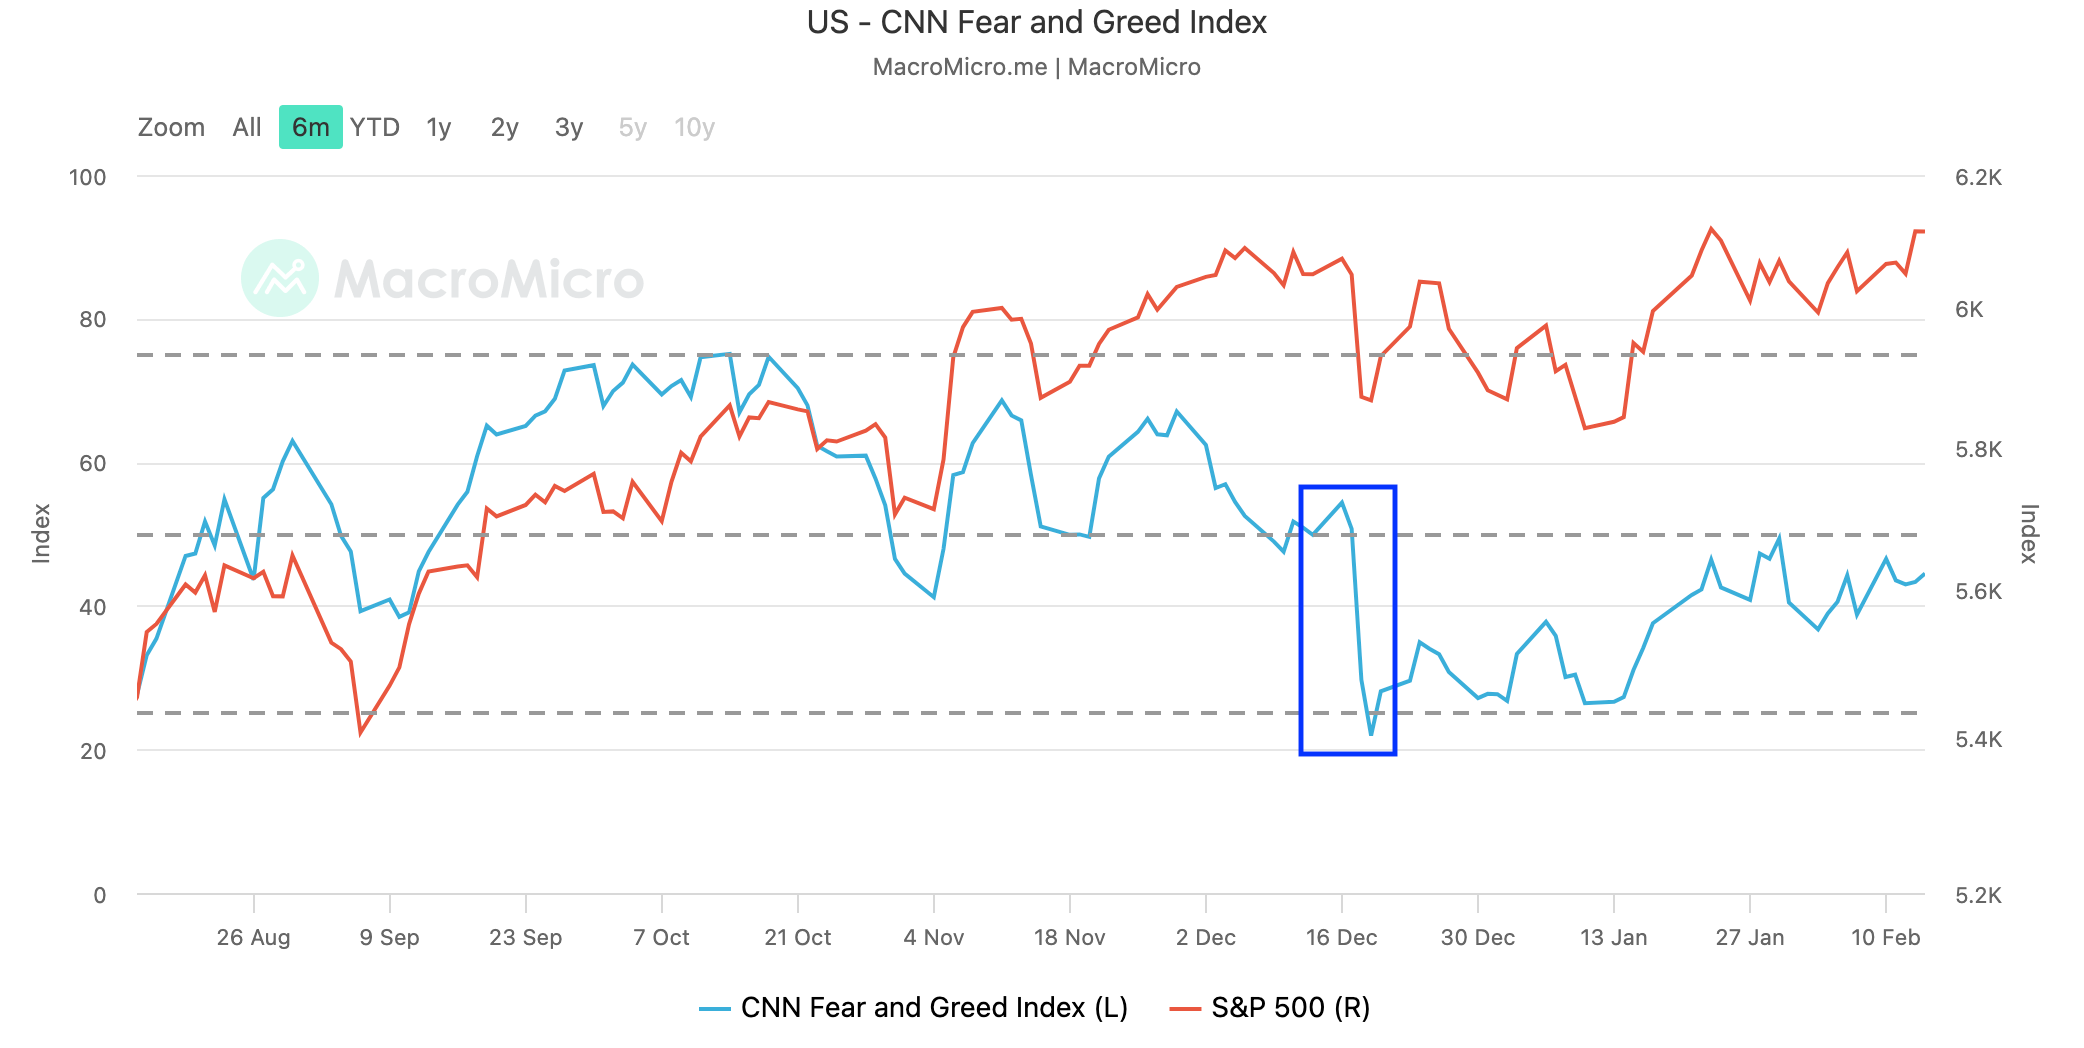
That dip was driven by breadth, which has recovered a bit, but not enough to suggest broad strength in the market. Both indicators remain locked in the Fear zone, though a couple of strong days would turn both positive.
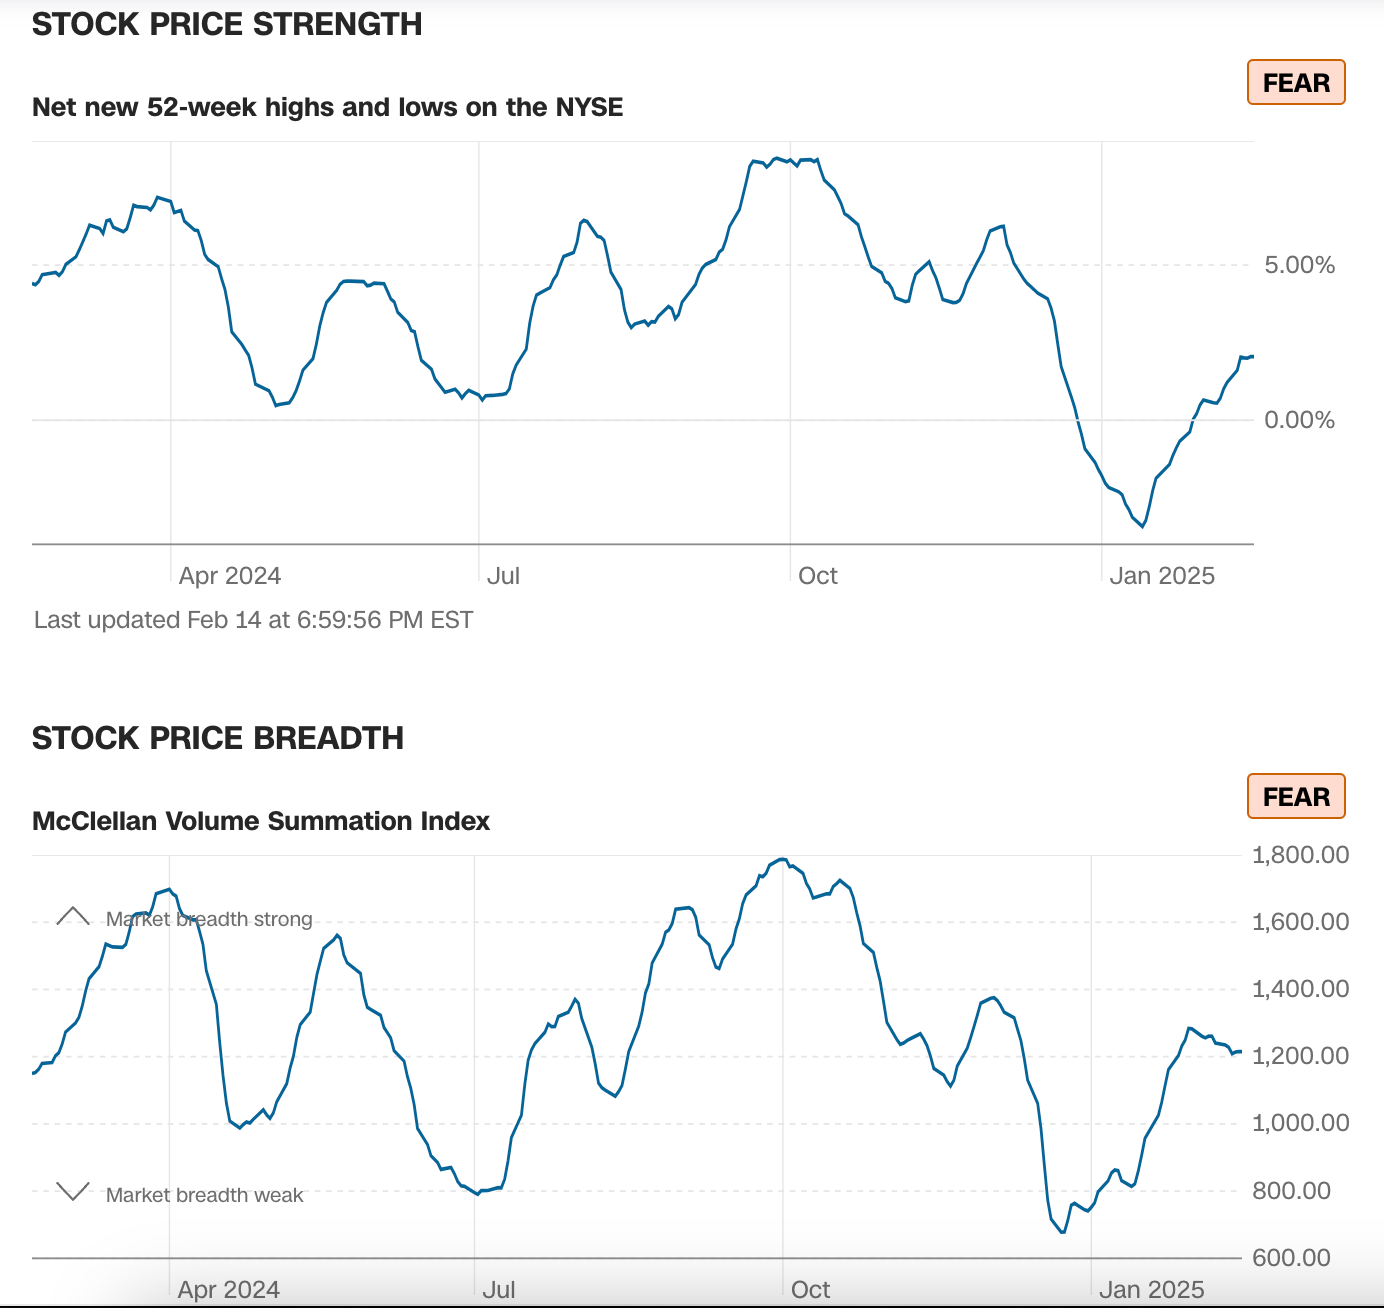
So, it’s still a narrow market.
Options traders remain greedy. The Put/Call Ratio is bumping along the bottom of the chart and we ignore the VIX, since it’s low. But I’d call it greedy, too!
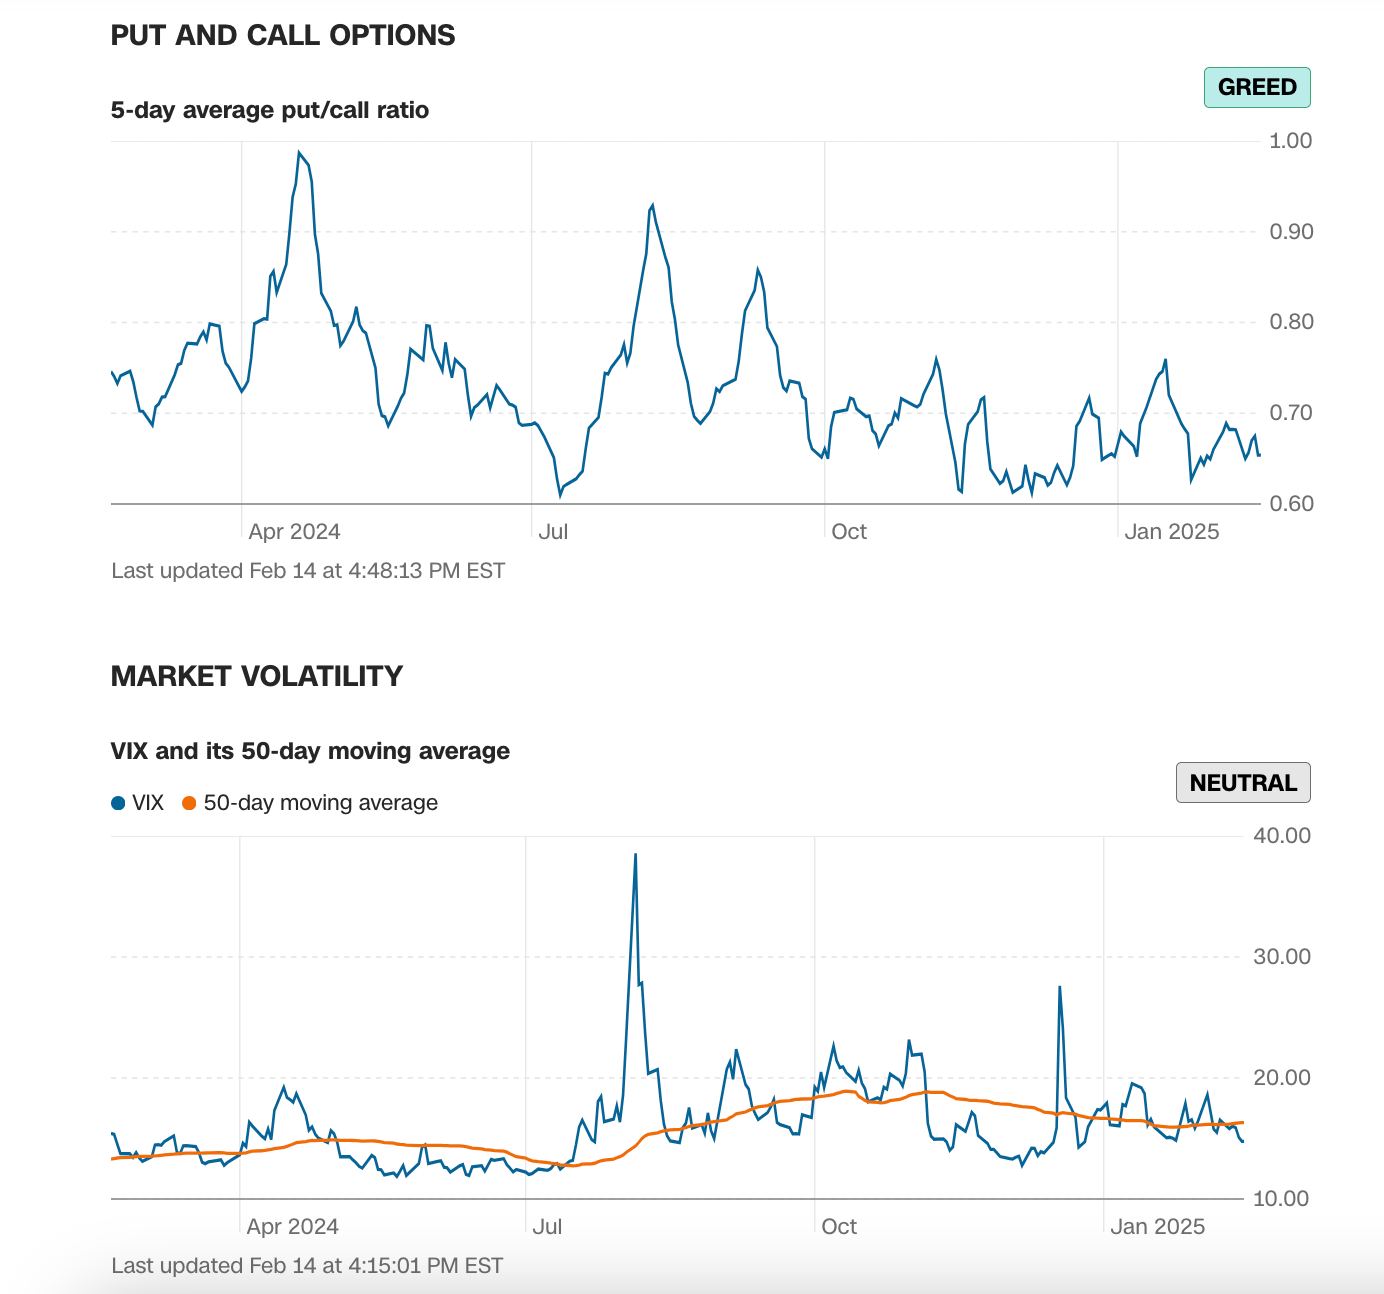
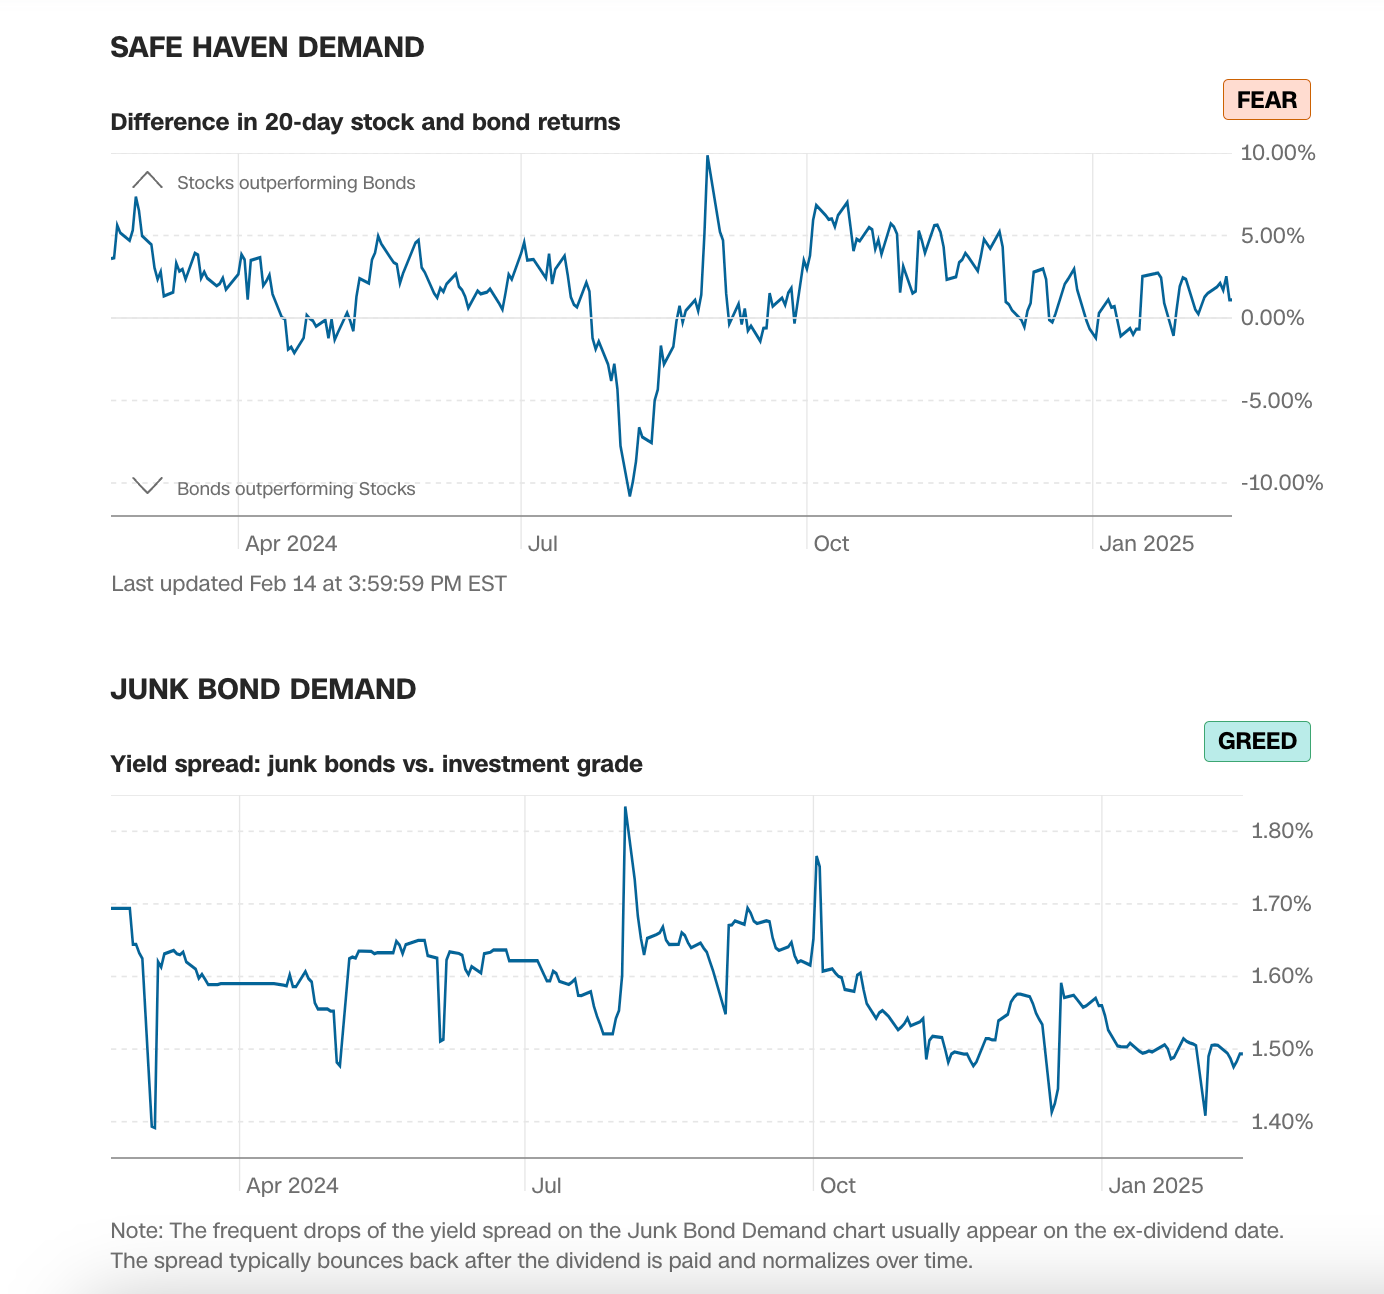
The bond indicators are mixed, but I noticed that both have been trending sideways since the election. Just like the stock market.
Basically, Fear & Greed is not offering a clear signal. This is consistent with the Bollinger Bands Squeeze and sideways market that we’re experiencing. Given that we set a new high on Friday and that the S&P’s 125-day average remains upward-sloping, I think the weight of the evidence says we’ll go higher, but it’s a low conviction bet. If you're tempted to play this one, the January lows would make a logical stop-loss.