My Bet's on Peace, Oil Cools, Chart Sprouts Green
Here's why I'm seeing positive signals on Iran peace talks; also oil and gas prices appear to relent and the chart of the S&P is showing signs of bullishness.
You've reached your free article limit
You've read 0 of 1 free Pro articles.
 Market_Recon_TSP1_KL
Silence. Zero dark thirty. Just me and the hum of my refrigerator in the background. I look over my computer screens into the black abyss of my office window. The shiny man shrouded by the night stares back. Let the dog out, he says. Turn on Bloomberg Radio, he says. Done and done. Check foreign markets. Positive. Check U.S. equity index futures. Positive. What's down? Oil's down. Front-month WTI Crude traded above $105 per barrel a rough 24 hours ago. This morning, I saw the sweet stuff trading with a $96 handle. I also have seen that gasoline futures are trading lower as well.
Peace Progress
The U.S. Navy had set up and had initiated its blockade of the Strait of Hormuz. But it became obvious to observers and for our intents and purposes, market participants, that U.S. and Iranian officials were discussing not the possibility, but the likelihood of holding a second round of peace talks before the announced two-week ceasefire period expired.
Vice President JD Vance spoke to Fox News, “We did make some progress in the negotiation.”
Vance added that the talks this past weekend did help clarify some red lines. Concerning the probability of holding another meeting, Vance was blunt and said the question was “best put to the Iranians, because the ball really is in their court.”
There is some belief that if a second round of talks can be held this week or this weekend, that the existing ceasefire, which expires on April 21st, can at least be extended.
There are whispers passing up and down Wall Street that Iran has already offered to disband its nuclear weapons program and allow for inspections for a five-year period, but that the U.S. is insisting on a 20-year period. If it is true that this is the one big issue that stands in the way of peace, my friends, and there is both a bid and an offer on the table? Then, we're really not that far away.
The Darkling Thrush
At once a voice arose among
The bleak twigs overhead
In a full-hearted evensong
Of joy illimited;
An aged thrush, frail, gaunt, and small,
In blast-beruffled plume,
Had chosen thus to fling his soul
Upon the growing gloom.
So little cause for carolings
Of such ecstatic sound
Was written on terrestrial things
Afar or nigh around,
That I could think there trembled through
His happy good-night air
Some blessed Hope, whereof he knew
And I was unaware.
- Thomas Hardy (1900)
Manic Monday
U.S. markets turned an early selloff around on Monday. Markets started out trading lower on a Sunday night that melted into a weak Monday morning. Then, these whispers started making the rounds. When the dust settled, oil was trading lower, Treasury debt securities had found a bid, and stocks traded higher. The Nasdaq Composite gained 1.23% on the day, while the S&P 500 added 1.02%. Looking past the weed, the Dow Transports soared 2.47% on the prospects for less expensive fuel, while the small to mid-cap indexes did well and the Philly Semiconductors popped for 1.68%.
Minty Fresh
Have a Tic Tac? Don't need one. Market breadth was minty-fresh on Monday. Nine of the 11 S&P sector SPDR ETFs closed out the day's regular session in the green. Technology (XLK) led the way, followed by the Financials (XLF) , despite Goldman Sachs (GS) having spit the bit in response to earnings. The Utilities (XLU) and the Staples (XLP) both closed in the red as growth outperformed cyclicals and cyclicals outperformed defensives.
Winners beat losers at the NYSE by almost precisely a two-to-one margin and by better than two to one at the Nasdaq. Advancing volume took a commanding 83.2% share of composite Nasdaq-listed trade on Monday and a very solid 73.9% share of composite NYSE-listed activity as well. The only catch was that aggregate trading volume across Nasdaq listed securities suffered an 8.9% day over day contraction from Friday's level. Conversely, aggregate trade across NYSE-listings popped for an 8.9% increase. Volume across the membership of the S&P 500 increased as well.
The Chart
Readers will note that on Monday, after a one-day pause, the S&P 500 pulled away from its 50-day simple moving average as the 21-day exponential moving average crossed over the 200-day simple moving average.
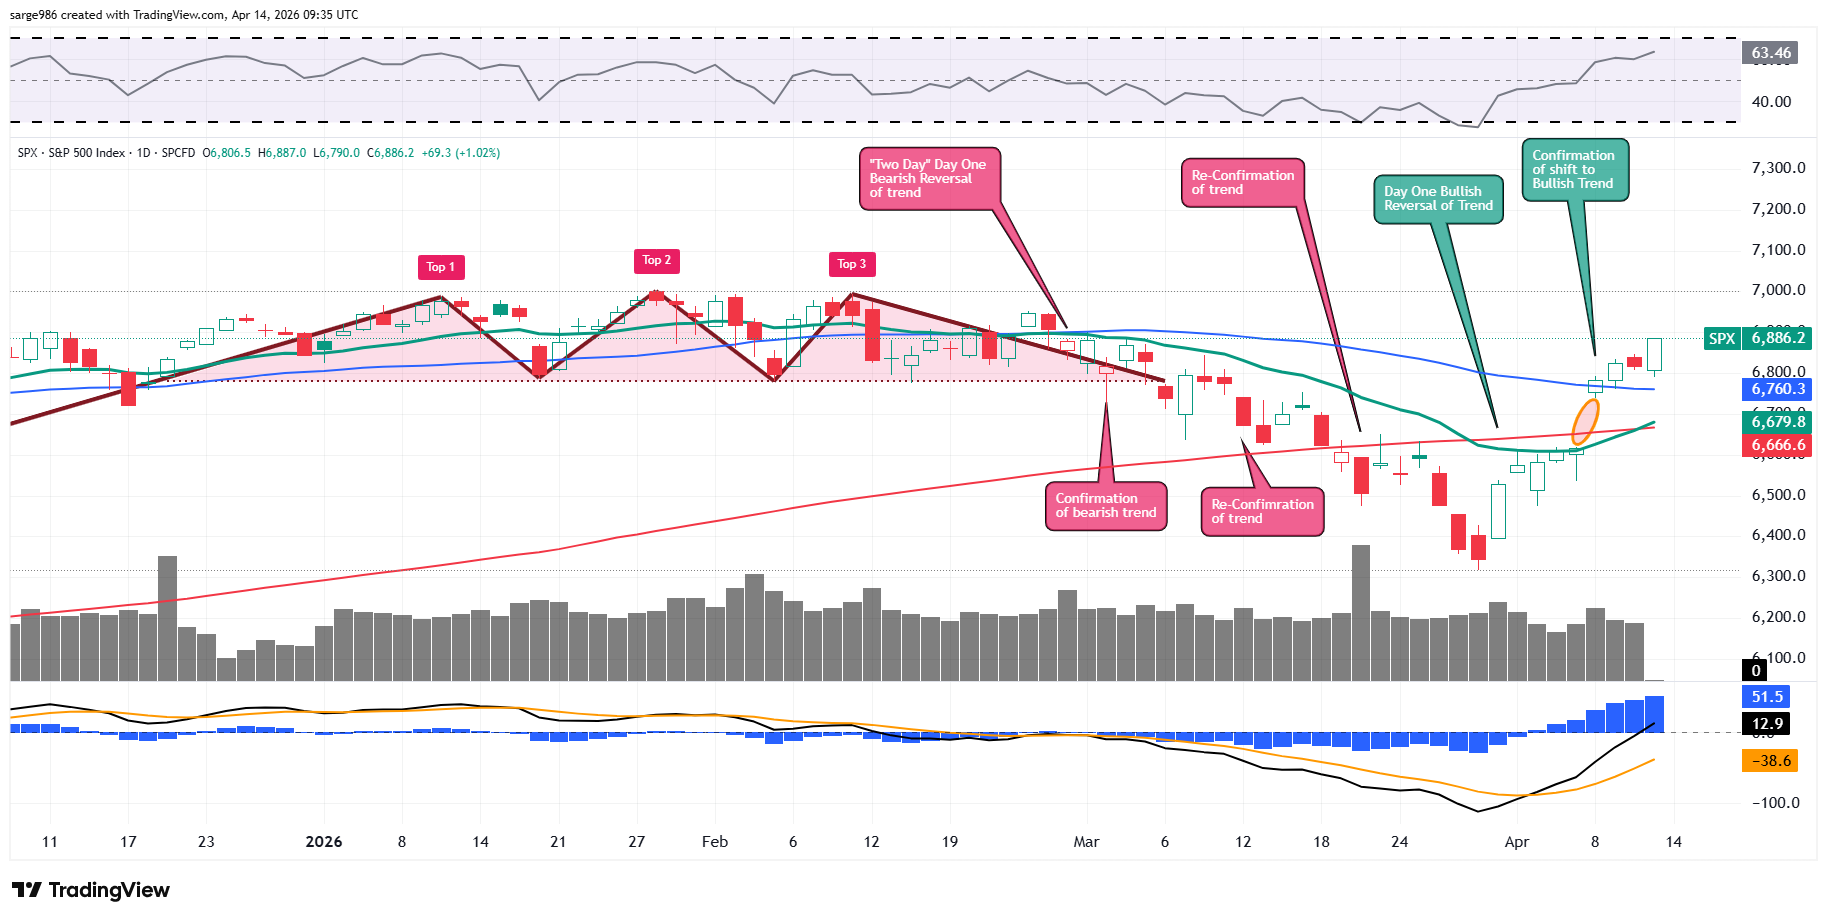
These are bullish undercurrents for large-cap U.S. equities in general. Readers will also see that Relative Strength has soared over the past week or so but has not yet approached what might be considered an overbought condition. Below the chart, the daily Moving Average Convergence Divergence is starting to look white hot. The histogram of the 9-day exponential moving average is now well above the zero-bound. In addition, the 12-day EMA has crossed above that same zero line while pulling away from the 26-day EMA. These are all short- to medium-term bullish signals.
Related: As We Near Overbought Levels, Will a Pause Refresh Buying Interest?
Here Come the Banks
Is full of grace? This morning, traders and investors will have to focus on more than the ceasefire in the Middle East and the naval blockade. Traders or more specifically, high-speed, keyword-reading algorithms will be reacting to the March report on producer-level / wholesale prices for March, which the Bureau of Labor Statistics will release at 8:30 a.m. ET. Do not be shaken by a headline print that lands above 4%. That's what is already priced into markets. Up around 4.5%, you can get shaken.
In addition, the banks will be out in force this morning. Wells Fargo (WFC) , JP Morgan Chase (JPM) and Citigroup (C) will lead a heavy slate of Q1 financial results this morning. Will they all report a strong quarter of profitability? My opinion is that markets have been volatile and they all should, unless their traders were asleep at the switch. That said, Goldman's bond, commodity and currency traders unexpectedly had a lousy quarter. That is what Wall Street will focus on when these banks report this morning.
Yes, there are five Fed speakers set to orate later today. Of the five, only Michael Bar and Anna Paulson hold 2026 voting rights, so don't let the other three upset your apple cart. That said, Michael Barr is the central bank's version of melba toast. Sort of. You really only have to pay attention to Anna Paulson today.
Economics
(All Times Eastern)
06:00 - NFIB Small Biz Optimism Index (Mar): Expecting 98.6, Last 98.8.
08:15 - ADP Employment Change (Weekly): Last +26K.
08:30 - PPI (Mar): Expecting 1.2% m/m, Last 0.7% m/m.
08:30 - Core PPI (Mar): Expecting 0.5% m/m, Last 0.5% m/m.
08:30 - PPI (Mar): Expecting 4.1% y/y, Last 3.4% y/y.08:30 - Core PPI (Mar): Expecting 3.7% y/y, Last 3.9% y/y.
08:55 - Redbook (Weekly): Last 7.6% y/y.
4:30 p.m. - API Oil Inventories (Weekly): Last +3.719M.
The Fed
(All Times Eastern)
12:15 - Speaker: Chicago Fed Pres. Austan Goolsbee.
12:45 - Speaker: Reserve Board Gov. Michael Barr.
1 p..m - Speaker: Boston Fed Pres. Susan Collins. 13:00 - Speaker: Philadelphia Fed Pres. Anna Paulson.13:00 - Speaker: Richmond Fed Pres. Tom Barkin.
Today's Earnings Highlights
(Consensus EPS Expectations)
Before the Open: (ACI) (.44), (BLK) (11.57), (KMX) (.23), (C) (2.63), (JNJ) (2.68), JPM (5.51), (WFC) (1.60)
At the time of publication, Guilfoyle had no position in any security mentioned.
