Money Flows From the Unprofitable to the Profitable, but Is a Correction Near?
Let's look at several indicators that suggest what could be next.
You've reached your free article limit
You've read 0 of 1 free Pro articles.
That was quite a rollercoaster in the speculative names on Wednesday, wasn’t it? Those stocks garnered an awful lot of volume, too. Was it enough to say there was a panic? In some stocks, it probably was.
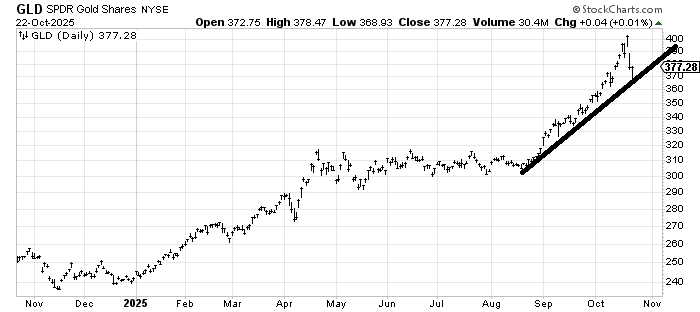
It’s tough to say when the fever breaks, as it finally did this week, if that’s it and we’ll never see these stocks rally again, but since my view remains the same, I like to wait for a pattern to set up again. While GLD did in fact bounce right off that line I drew in, and probably can/will bounce some more, I still have no interest in it because I want that pattern to set up.
But Wednesday brought us some other interesting tidbits, and I am not talking about the nonsense that went on in stocks like Beyond Meat (BYND) that traded well over two billion shares, having ramped up from fifty cents earlier in the week to 7.50 Wednesday morning and then closing at 3.50.
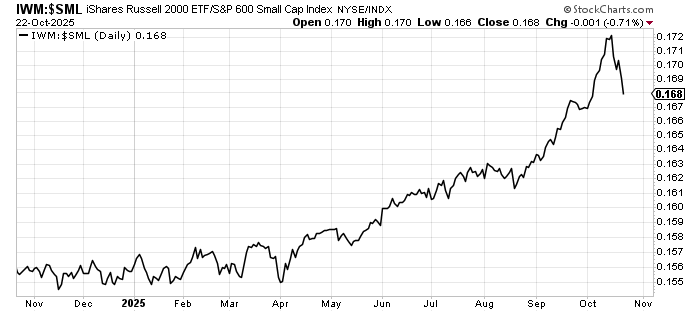
I am talking about the continued decline on the ratio of IWM to SML. Call it what you want, I call it the reversal of the unprofitable to the profitable.
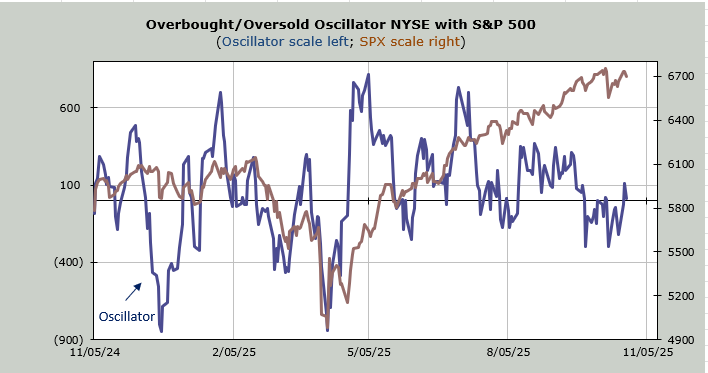
I am talking about the fact that for the first time in ages, the advance/decline line on the NYSE held up rather well compared to the S&P. I am talking about the fact that the number of stocks making new lows did not expand. Last Thursday’s 42-point decline in the S&P brought us 60 stocks making new lows, and Wednesday’s brought us 18.
Of course, the number of stocks making new highs is not expanding, but again, that is the constant group rotation. Now the rotating is out of the low-quality stocks and into some energy and staples. I still think the market should try and rally again this week to get us back to a short-term overbought reading.
I want to end with a chart from Bespoke. For months, I have been saying that my indicators don’t change. The short term gets overbought and oversold (barely), but the intermediate term indicators tend to just sit there.
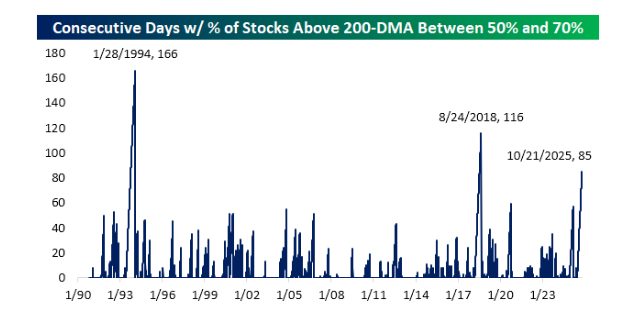
Bespoke tracks the number of consecutive days that the percentage of stocks trading over their 200-day moving average lines has been between 50% and 70%. This is not an indicator I use, but basically, call that neutral territory: not overbought/not oversold.
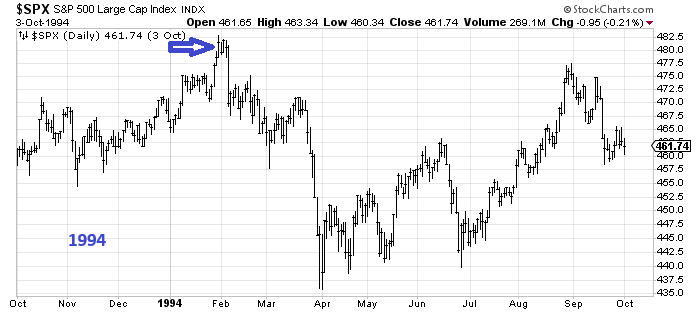
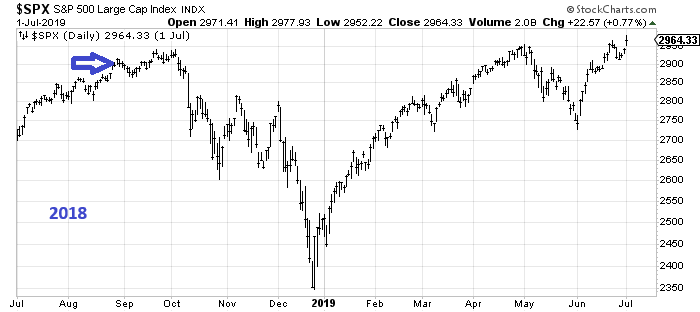
They highlighted that this is the longest streak (85 days) since we saw 116 days in August of 2018, and prior to that, January of 1994 with 166 days. I immediately recognized those dates because in both cases the market fell quite a bit within a few weeks.
I grant you, this is only two other instances, and we’re not yet at the extremes we saw in those instances. But this is what my indicators have said: no change. Yet when the streak is this long and they do change, it has tended to mean—at least these two times—a correction is near.
Just something to tuck away for when this does change.
Here’s the Bespoke chart.
Here is what 1994 and 2018 looked like. I would highlight one major difference between those two years and now: interest rates. In both cases, the Fed was either hiking or leaning toward it. They are not doing so now.