Meta, Microsoft? Just Magnificent
Let's dig into the impressive results by these two Mag 7 names, and sort out that confusing GDP report and why, when looking below the surface, it appears pretty positive.
You've reached your free article limit
You've read 0 of 1 free Pro articles.
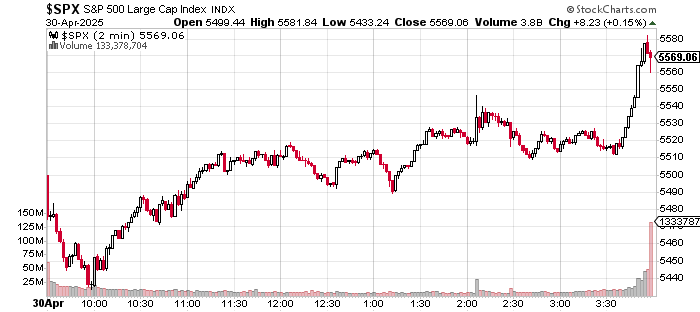
What a rebound from the depths of Hades! Am I referring to the regular trading session on Wednesday, or to the month of April? It could be either. A traders' market? Indeed. An investors' market? Not for the faint of heart, or for those with a very thin tolerance for risk. On Wednesday, the S&P 500 posted a gain of 0.15%, closing in the green for a seventh consecutive trading day after having been down as much as 2.29% early in the session. The Nasdaq Composite closed just slightly into the red at -0.09%, but that was after that index had been down 2.87% at one point shortly after the opening bell.
The early morning selloff came about as the algorithmic result of a spate of weak looking macroeconomic data that had been released. Among those data points were headline first-quarter Gross Domestic Product decline of 0.3% (q/q, SAAR), and a Q1 personal consumption expenditure inflation growth print of 3.7%. Wall Street had been looking for GDP growth of +0.4% and Q1 PCE inflation of 3.1%. A contracting economy coupled with red hot inflation? No wonder the bots that control priced discovery in 2025 raced each other to various points of sale, hitting every bid in their collective path. Then something changed. More than one thing changed.
Maybe at least some of the market rebound came about as portfolio managers dressed up their books. Maybe at least some of that market rebound came about as pension funds reweighted their portfolios. Take a look at the chart below. You be the judge.
Looking under the hood, investors discovered that the GDP print was not nearly as negative as had been thought and had been anywhere from positive to significantly positive in almost every single important category. Additionally, 90-minutes later, when the monthly PCE inflation data was released, we learned that there had been virtually no inflation whatsoever in March.
For March, headline PCE printed at month-over-month growth of 0.0%, down from 0.4% in February, while Core PCE inflation also hit the tape at growth of 0.0%, down from 0.5% in February. On a year-over-year basis, headline PCE inflation and Core PCE inflation printed at growth of 2.2% and 2.6% respectively, down from 2.7% and 3.0%.
Window Dressing...
Whatever you want to call it, that was some last 20 minutes:
For the Month?
Incredibly, for April, the Nasdaq Composite closed up 0.85%, after having been down 14.5%. For April, the S&P 500 closed down 0.76% after having been down as much as 13.8%. The most interesting reversal may have been performed by the Philadelphia Semiconductor Index. That high profile mid-major equity index still closed down 0.94% for the month but had been down 20.7%.
Treasury debt securities had a wild month as well. The U.S. Ten Year Note paid just 4.15% as the sands of time ran out on the month of April, down from just under 4.5% as recently as April 10. The U.S. Dollar Index closed out the month at 99.47 after having gone as low as 98.28 and as high as 103.81 during April.
About That GDP Report
It would be difficult to call Wednesday's first estimate of first-quarter Gross Domestic Product by the Bureau of Economic Analysis negative. Obviously, the report is skewed, as there was a rush to import goods ahead of the president's "liberation day" where he announced the implementation of a wide array of various tariffs on all U.S. trading partners.
Using the Bureau of Economic Analysis' released materials as a resource (I note this, because my tweet on the matter set off a Wednesday firestorm on Twitter and apparently, we have several members of the financial media and several members of the faculty at institutions of higher learning that cannot think outside of their trained little boxes), net exports had an impact of -4.83% (q/q, SAAR) on the headline print of -0.3% (q/q, SAAR). The other side of that same coin would be an impact of +2.25% in private inventories. By most estimates, an adjusted GDP print of +3.0% or maybe just a little more if the net decrease in exports and the increase in inventories were somehow flattened.
Of course we cannot do that, but it is difficult to make the "economy in decay" argument, at least for the first quarter, when final sales to private domestic purchasers were up 3.0%, and federal government consumption was down 5.1%. Now, a lot of this data is difficult to parse as the 21.9% growth in gross private investment is obviously tied to the 41.3% growth in imports. Now, sit down for what I am about to tell you. I don't know all of the answers, but so many people who really should know better, refuse to look into the data and are quite happy to take important data at face value. Even when there are obvious non-recurring factors.
Error in the Data?
I don't know. Maybe. This is confusing. Forget percentages and impacts in percentage terms. Now I am just talking about dollars and cents. For the first quarter, the BEA is reporting a $323.6 billion increase in the import of goods. The BEA is also reporting a $131.3 billion increase in private inventories and a $7.3 billion increase in the consumption of goods. Unless I am missing something, and I very well may be, for as I said, I know not everything, that leaves $185 billion unaccounted for.
This is a little sloppy because we are trying to completely separate goods from services and we are leaving all of the other adjacent data out of our thinking, but does it not stand to reason that imported goods end up either being consumed or in inventory somewhere? This is not really funny. Either I am missing something, or the BEA is missing something. A revision that either takes consumption and inventories higher to meet imports or imports lower to meet consumption and inventories will significantly alter the headline GDP print for the quarter.
Return of the Jedi?
Revenge of the Sith? Meta Platforms META and Microsoft MSFT both reported their quarterly numbers on Wednesday evening. The results, to say the least, were impressive. Is the Mag 7 back in the saddle? At least for the moment. Meta posted revenue growth of 16.1% and earnings per share of $6.43, crushing expectations for something like $5.27. Operating income grew 27%, as free cash flow beat estimates by more than $1.7 billion.
Microsoft posted an EPS of $3.46, easily beating the street, on revenue growth of 13.3%. Azure-driven revenue grew 33%, well above estimates for little more than 30%. Microsoft also provided better-than-expected guidance. Meta Platforms increased projected capital spending, primarily for its generative AI projects, while Microsoft left its already-issued projections for capital spending in place.
This bodes very well for the likes of Nvidia NVDA and Advanced Micro Devices AMD. Needless to say, both META and MSFT are trading sharply higher overnight. Readers will see below that I am long MSFT, which would be contrary to what I had written on Wednesday. Understand that I did not go into the release with that position. That position is simply the result of overnight trading and may or may not be there later on today.
Palantir on Target ...
Palantir Technologies PLTR is closing in on our $122 target price.
Economics (All Times Eastern)
08:30 - Initial Jobless Claims (Weekly): Expecting 223K, Last 222K.
08:30 - Continuing Claims (Weekly): Last 1.841M.
09:45 - S&P Global Manufacturing PMI (Apr-F): Flashed 50.7.
10:00 - ISM Manufacturing Index (Apr): Expecting 47.9, Last 49.
10:00 - Construction Spending (Mar): Expecting 0.3% m/m, Last 0.7% m/m.
10:30 - Natural Gas Inventories (Weekly): Last +88B cf.
The Fed (All Times Eastern)
Fed Blackout Period.
Today's Earnings Highlights (Consensus EPS Expectations)
Before the Open: BIIB (3.04), CVS (1.63), LLY (3.64), EL (.31), HOG (.77), HSY (1.93), MA (3.57), MCD (2.68), MRNA (-3.11), RBLX (-.39)
After the Close: ABNB (.24), AMZN (1.36), AAPL (1.61), RDDT (.51)
At the time of publication, Guilfoyle was long MSFT, PLTR equity.
