Market Isn't Yet Oversold After Major Indicator Rolls Over
Breadth is increasingly narrow, with Nvidia single-handedly holding up the market on Tuesday.
You've reached your free article limit
You've read 0 of 1 free Pro articles.
I think it is pretty obvious to anyone who owns individual stocks that Tuesday’s market was held up by Nvidia NVDA. I’m half expecting my mother to tell me, it was that obvious.
Breadth was terrible. There are all sorts of statistics floating around about how the divergence between breadth and the S&P is the widest since (fill in the blank) or some other extreme. But since I am chart person let me show you a chart we looked at almost a month ago, it is the Equal Weight S&P (RSP) relative to the S&P.
When the chart is going down it means the equal weight S&P is under-performing the cap-weighted S&P. The chart just made a lower low. In fact, look at that chart and notice how the pattern since the April low was that of a downtrend with lower highs and lower lows.
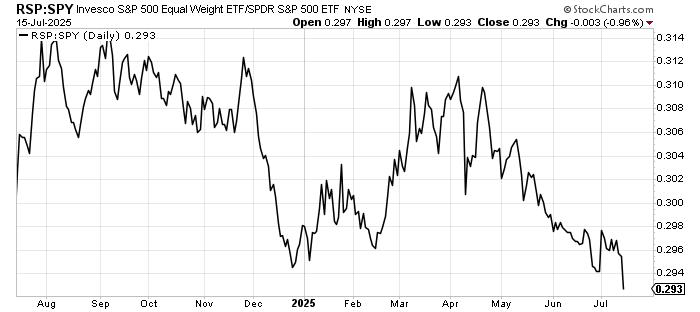
I think about this a lot because, at the lows, no one wanted to buy tech, or primarily semis. I was a fan of the semis at the lows. Unfortunately, I did not think they could power through all the resistance they had left behind and thought the SOX would stop around 4800. But this chart tells us the power of those cap-weighted stocks like NVDA.
We can say, "well this isn’t bullish for the S&P," but what the chart really says is that this isn’t bullish for stocks that are not index movers.
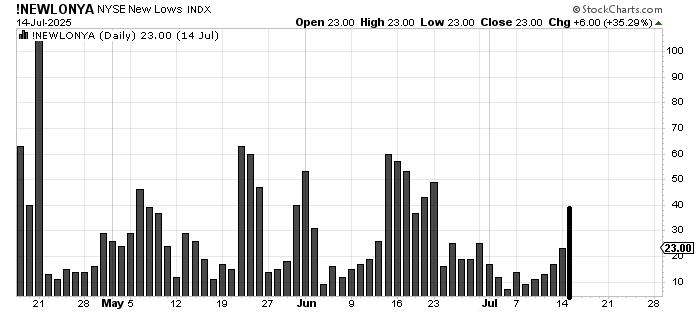
Here’s another chart. It’s the chart of stocks making new lows on the NYSE. On Monday, I noted they had lifted a bit. After Tuesday, you can see that the NYSE new lows are near 40, which is quadruple what they were a week ago. Sure that’s coming off a low base but if this market was more than just NVDA (and its friends) new lows would not be picking up like that.
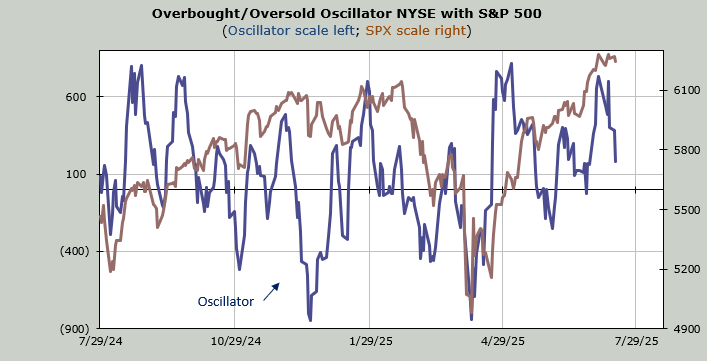
Now, let’s look at breadth. I have said countless times that breadth has been just fine. But now — you might need to squint — notice that breadth made a lower low than it did just over a week ago.
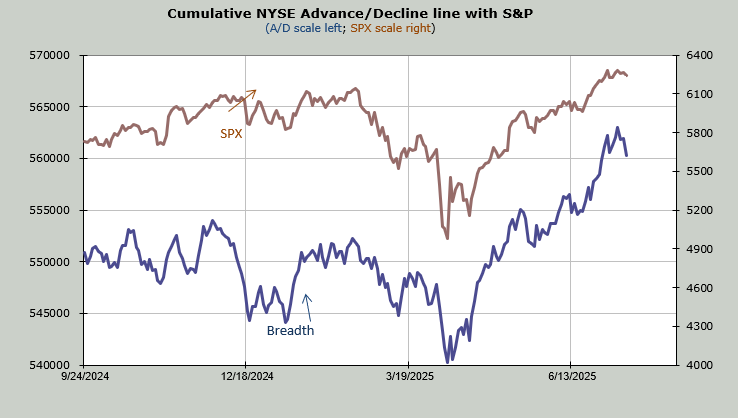
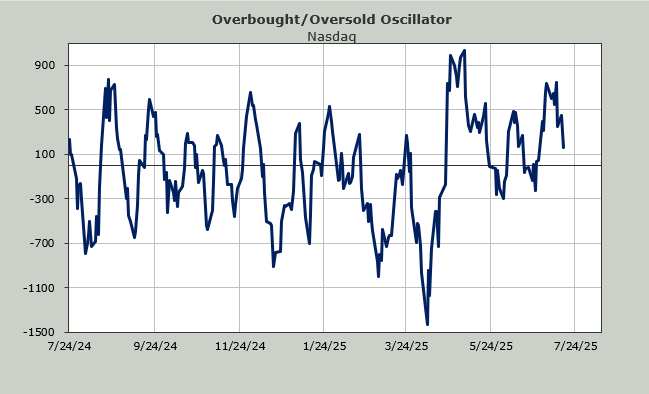
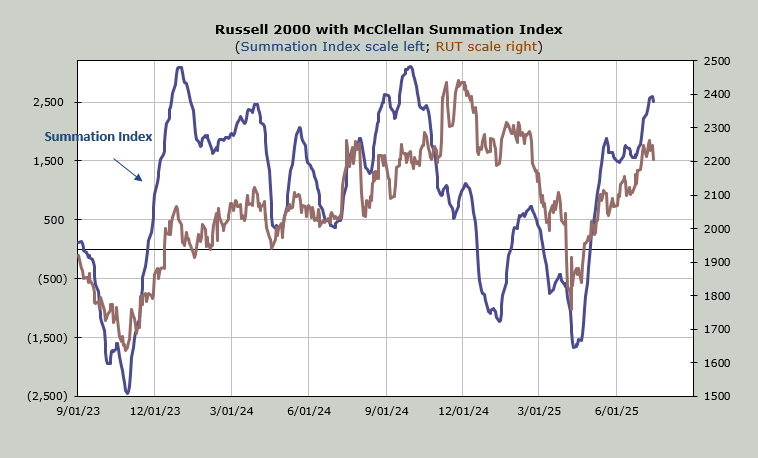
Then there is the McClellan Summation Index. It began to falter as we headed into the week. On Monday, it did not keep up. On Tuesday, it rolled over. You need to squint to see it but now it needs a net differential of +1800 advancers minus decliners on the NYSE to halt the decline.
But my biggest surprise of the day was that the put/call ratio was .81. Three weeks ago, we could barely get this indicator to fall under .90 and now on a down day it’s barely over .80.
The hallmark of this market for the last few months is that every time it appears to be out of gas, it is like Carrie and rises from the grave. I cannot call the market overbought anymore but it surely isn’t yet oversold.