Many Indicators Are Making Higher Highs, Just Not the One That Actually Measures New Highs
With the market at all-time highs, why aren't more stocks following along?
You've reached your free article limit
You've read 0 of 1 free Pro articles.
I would have preferred if we could have had that last-minute rally earlier in the day. Then, we would have been able to see what exactly was up there. When sell-offs or rallies come so late in the day, the market doesn’t have a chance to probe and get itself acquainted with what is up (or down) there.
Let’s see if we can get some follow-through on Wednesday to that last-minute rally because the indicators did not change at all. For example, the number of stocks making new highs continues to just sit there around 100 and can’t seem to get over 150. I’m not expecting a return to that 450 area (so yes, I will complain even if we get over 150), but right now, the inability to get over 150 new highs shows us the chop is still alive.
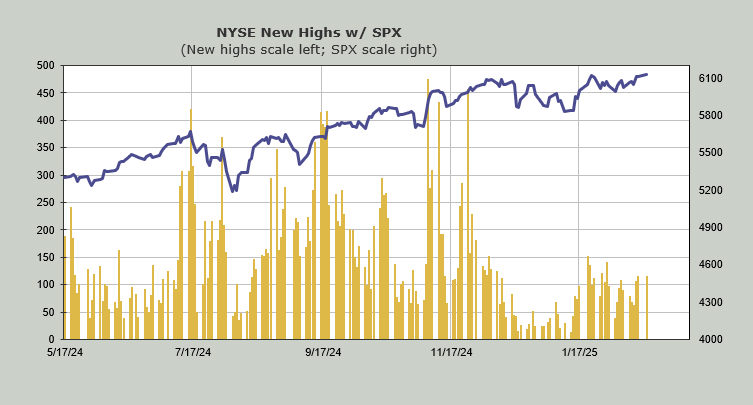
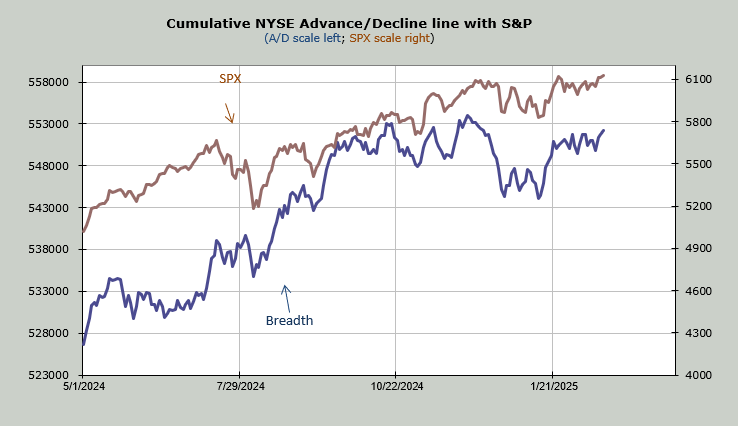
Even breadth eked out a higher high than that mid-January high, but not the number of stocks making new highs.
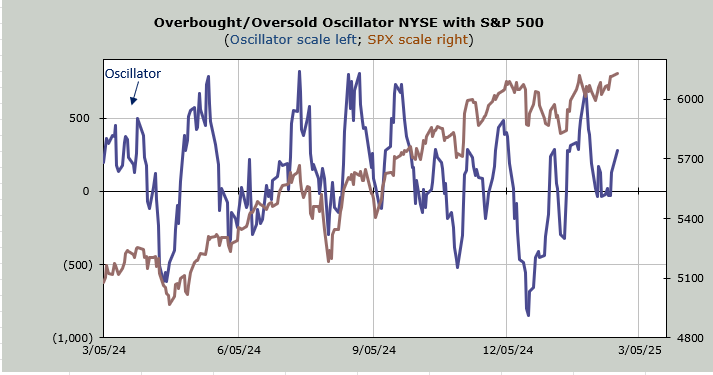
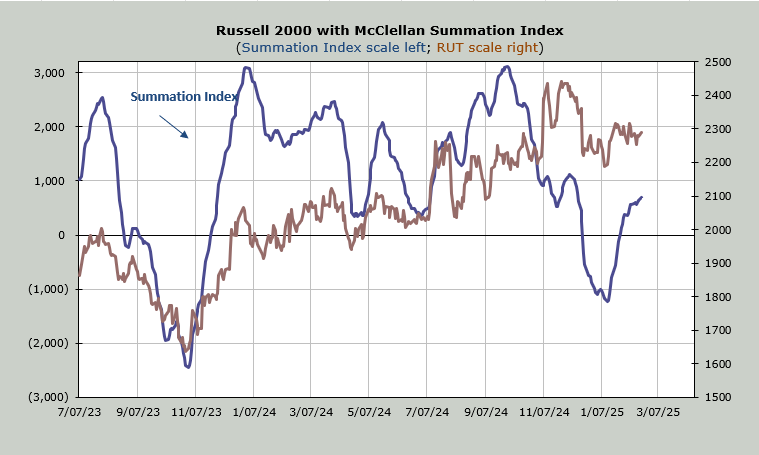
Even the McClellan Summation Index, which never turned south during this entire month of nothingness (as I have noted that is unusual and a positive), has crept upward, but not stocks making new highs. They have stayed dormant.
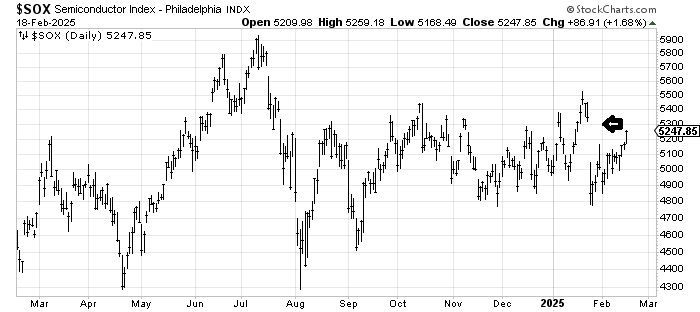
For weeks, I have noted that we have a few charts well worth watching for possible breakdowns. Microsoft has been high on my list, and it has not broken. The SOX was high on my list and not only has it not broken, it has rallied. It now has a test as it gears up to fill that gap it left nearly a month ago.
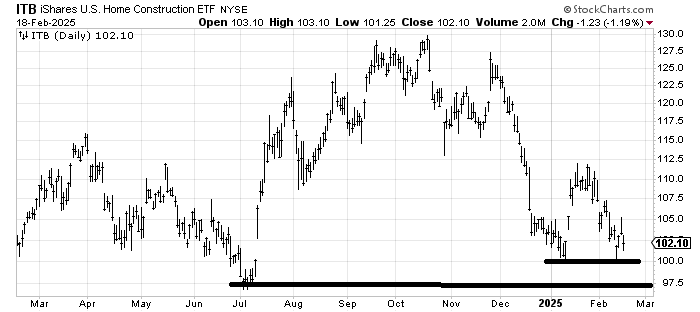
And then there is ITB. It has toyed with the lows. It has a different look than the other charts, though. It is nowhere near the mid-January high (as, say, the SOX is). It keeps hacking away at this 100 area. Wednesday should be a big test for it, as Toll Brothers reported what looked to be disappointing earnings on Tuesday evening.
The big support on ITB is that 97 area because that breaks that big head and shoulders top we saw on the weekly chart last week (shown here last Monday, February 10th). But for me the first real test is 100. If the Toll news doesn’t break 100 then once again we have a chart refusing to break on bad news.
If it makes it under 100, I would not expect 97 to break immediately, but the message is not one of holding; it is one of more deterioration. I read somewhere recently that when the Homies are at new 52-week lows and the S&P is at new highs, it’s a poor combination. But the same as we’ve seen in the last month, we watch to see if it breaks.
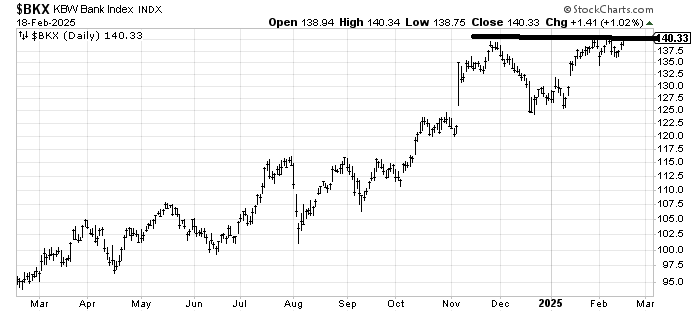
Lest you think it’s only stocks that might break down I’m watching, let me report that the Bank Index needs to clear 140 with some oomph for us to think there is a real breakout there.
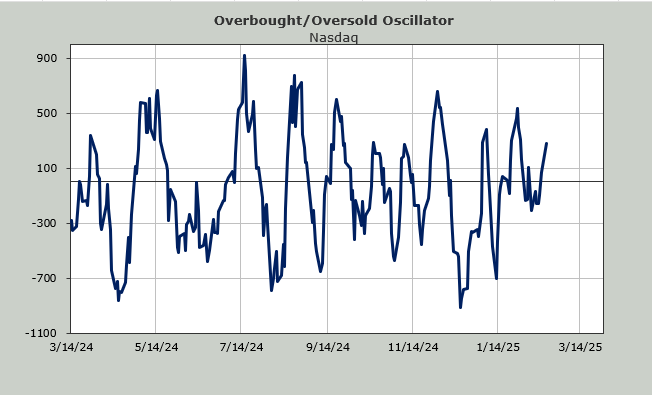
Finally, Nasdaq has been green for four straight days. It has not gone to five since the week of the election. I suspect we give it a try on the upside, but in the end, the chop stays with us.