Looking for Initial Bitcoin Price Support Following Breakdown
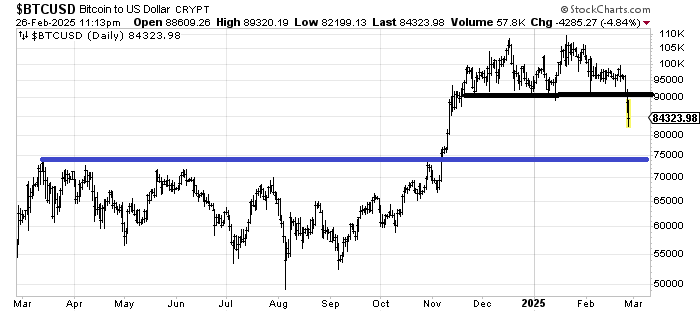
Bitcoin finally broke down below $90. Where is support?
You've reached your free article limit
You've read 0 of 1 free Pro articles.
Wednesday was, to quote Shakespeare, full of sound and fury, signifying nothing.
There was a lot of up and down, which I admit is better than just grinding, but it didn’t change any of the indicators. It barely changed any of the charts.
Consider that the IWM is still hovering at 215. Consider that the Transports are still sitting at that 15,750 area. The SOX is still in the range. ITB had the chance to break down recently and it refused to do so. For now.
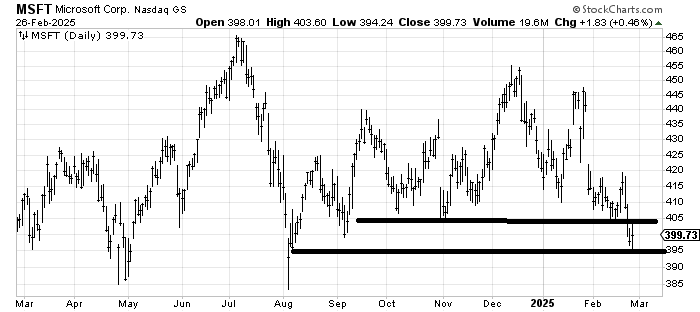
The only chart that broke was Microsoft MSFT, and it didn’t even whoosh. It dribbled. If it trades back over 405, it’s going to be just like ITB, which broke 100, traded down to 97, and then recaptured 100. Let’s call this chop with a downward bias.
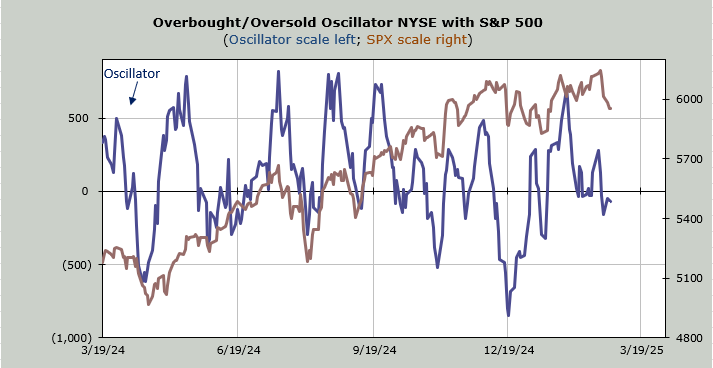
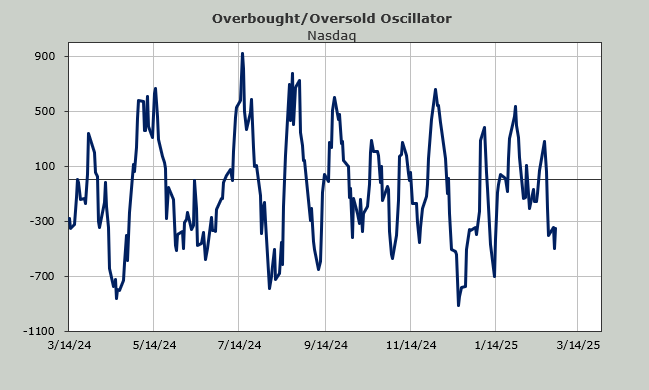
In any event, breadth was flat along with the S&P. That means none of the indicators budged. I would still like to see an up day and then back down. That would, at least, get the Overbought/Oversold Oscillator into a decent short-term oversold condition.
Sentiment did shift a bit, in that it did not get immediately bullish on Wednesday. The put/call ratio was over .90—again not extreme—for the third straight day. To me, it shows a shift in the sentiment, wringing out the complacency.
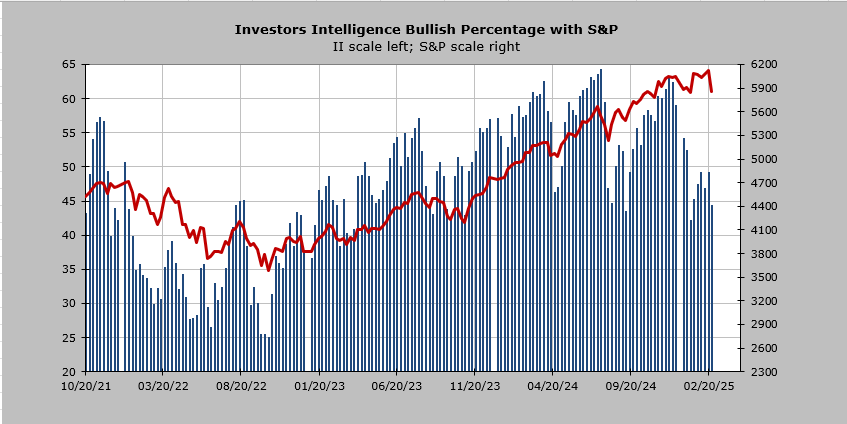
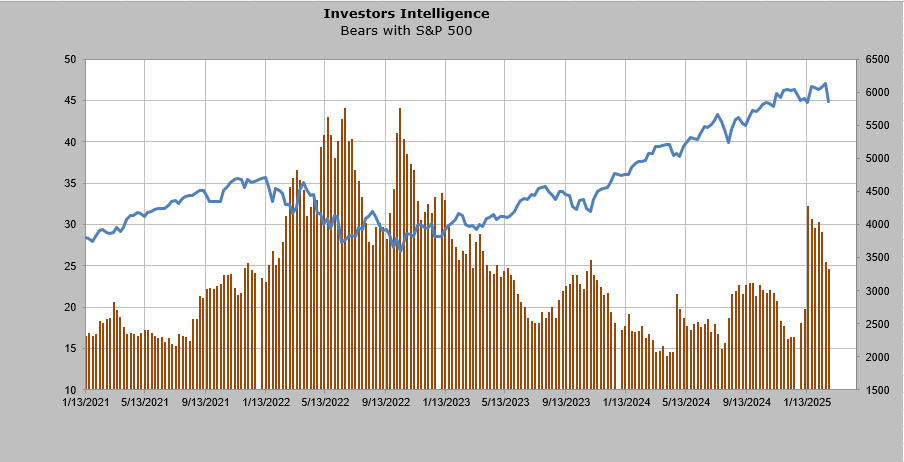
The Investors Intelligence bulls came down five points to 44.3%. That’s about two points higher than the January low reading. So that’s moving in the right direction. The bears, however, came down a point as well, so they remain well off the January level of over 30%.
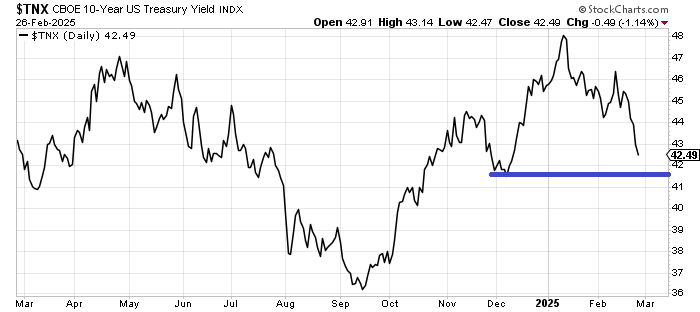
But that brings us to the bonds. All of a sudden—anecdotally—I can’t find a bear on bonds. In the short term, we are closing in on the December low in rates, and with an inflation reading coming out on Friday, I’d be inclined to look for a bounce in rates.
I should, however, note that the DSI for bonds is still only 48, so on an intermediate-term basis, I don’t think rates back up too much.
This brings us to Bitcoin. If you couldn’t tell from my columns all these months where I call it crypto garbage, I am not a fan. The only use case I see is for illegal activities, so you’ll color me skeptical. But several have inquired regarding the chart because it has finally broken 90,000. The textbooks would say it’s a double top, and if we take the top of the pattern (call it 105k) and subtract the bottom (90k), we get 15k. We then subtract that from the breakdown at 90k, and we get 75k, and yes, I know that’s where support is. Like magic!
I will end by noting the Daily Sentiment Index (DSI) on Bitcoin is currently 41, which I consider a neutral reading. I would remind you that around Thanksgiving, I wrote here in these pages from a story from the Wall Street Journal about a young Harvard graduate who was buying MSTR, Bitcoin, and the levered MSTR ETF for his parents’ retirement account, thinking that was diversified. Perhaps someone ought to check in on him…