Liberation Day Was Not a Prank
Investors were seemingly unaware that the tariffs would be as severe as they were. What insights can the charts give us about what's next?
You've reached your free article limit
You've read 0 of 1 free Pro articles.
Tariffs Are Not April Fools' Day Pranks
This week saw the annual celebration of April Fools’ Day where I had the opportunity to play my favorite prank on my kids. Well, just one of my kids.
I stole her car.
I didn’t take it far. I just moved it within the high school parking lot and put a stuffed skunk in the driver’s seat.
It was the best prank of the week.
Since Wednesday, Liberation Day, I’ve hoped the tariffs were a prank. But they’re not. And that’s got investors worried.
Since the announcement, the S&P 500 is off around 11%. Investors do not feel liberated.
If you remember back to February, when eggs were expensive, but imported goods were not, I said that the Bollinger Bands indicated an increase in volatility. To be honest, I didn’t expect anything near what we’ve gotten. I knew the market was overvalued and top-heavy, and even thought that there would be a 10% correction or more. But it’s hard to forecast the magnitude of a move before it happens.
For me, technical analysis isn’t a forecasting tool. It’s a measurement tool.
So let’s do some measuring.
S&P 500 Compared to Its 125-Day Average
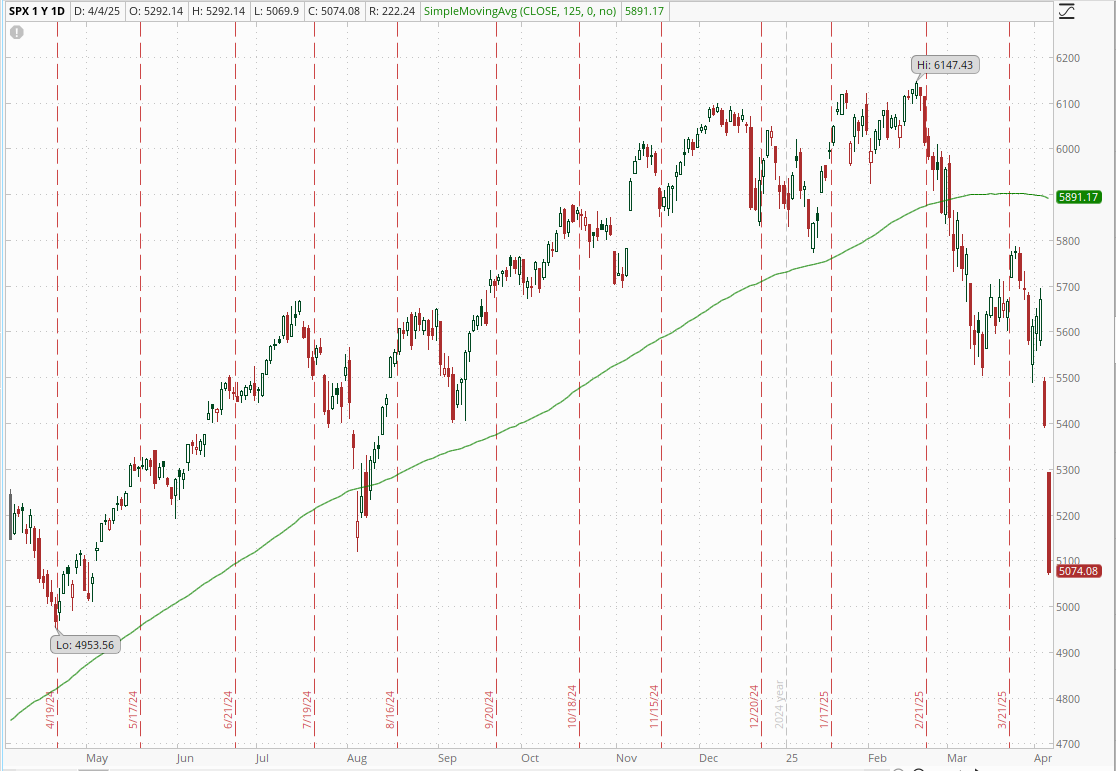
The S&P 500 closed at 5074 today, which is 17.5% off of the all-time high set in February. 5074 is also 817 points below the 125-day moving average. That is a lot. Like 14% below. Or 5 standard deviations.
Over the last 20 years, we’ve been this far below that average five other times, two of which were during the last Trump presidency. March 2020, during the Pandemic, and in December 2018, when he last went on a tariff tirade. Other times were in August of 2015, August 2011, and during the financial crisis in September 2008.
This only happens during chaotic markets.
Of the five prior instances, two resulted in V-shaped bottoms. Those were during the last Trump presidency. Quick down followed by a quick up. The stock market version of an April Fools' prank. Just kidding!
Of the other three, two saw stocks bounce around the lows for several months before recovering, while the lows in September 2008 led to more lows in 2009.
So, what will it be this time? Answer: I don’t know.
What I can tell you is that the 125-day average has also rolled over, indicating a weak market.
The S&P 500 and Its RSI (Relative Strength Index)
The RSI, too, is bearish. RSI is a momentum indicator that shows how committed investors are. People have written entire books on RSI, but I’ll keep the analysis more simple today. RSI travels in ranges. When the market is strong, it tends to bottom out around 40 and top out around 80. When the market is weak, it bottoms out around 30 and tops out around 60.
Well, the RSI for the S&P 500 closed today at 23, which is really low!
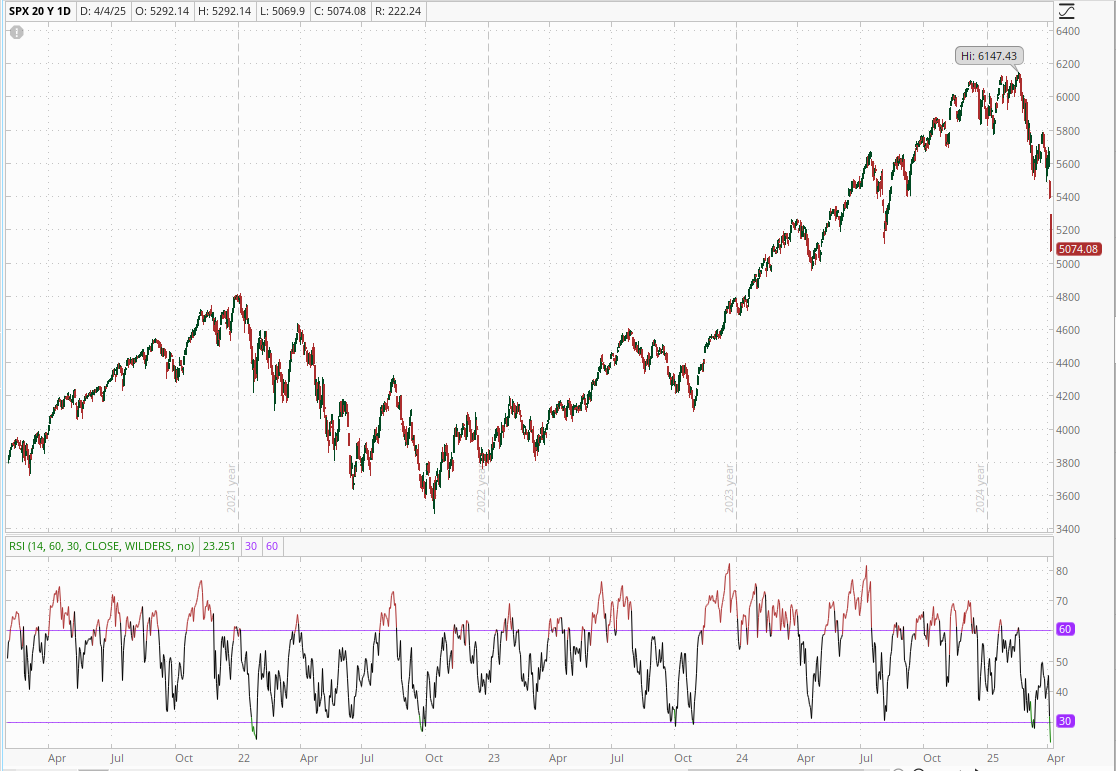
What does it mean? It means that stocks could bounce. But just a bounce. When the RSI gets over 60, that would signal a change in the technicals.
How About the Fear & Greed Index?
The good news is that it closed at 4 today.
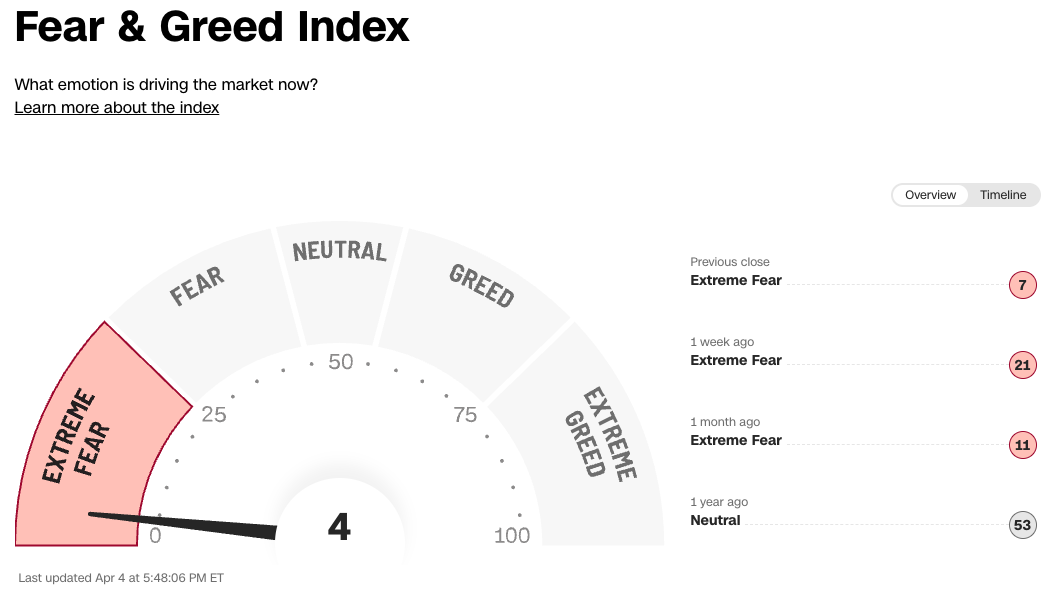
I don’t have my data anymore, but back when I tested this years ago, probably around 2018, there had never been a time when the S&P 500 failed to bounce following a Fear & Greed close below 10.
The last one was back in 2022, and you can see here that stocks did bounce. However, a month later, we saw new lows.
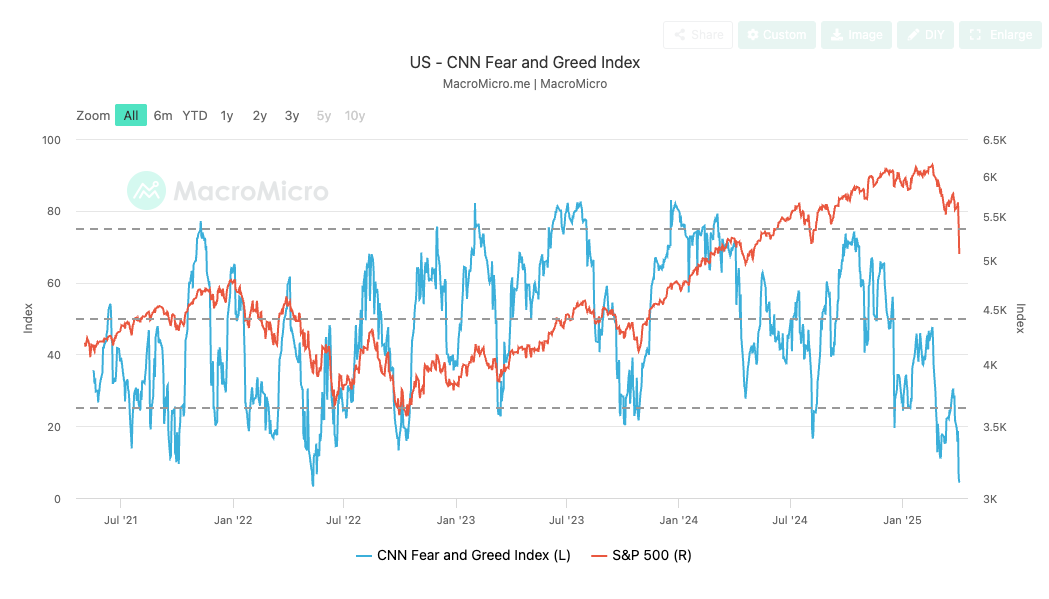
The other interesting thing I notice when I look at the individual components of the Fear & Greed Index are that many of them are at multi-year extremes. It’s almost like this market was caught off guard. Investors were surprised. Which is weird because Trump is doing exactly what he said he was going to do. But there was so much disbelief leading into this announcement that people thought he was just using extreme numbers to gain an advantage. Investors were wrong.
Fact is, I can give you the best analysis I can, and I may be textbook correct. But this market is event-driven and so much will depend on the news out of Washington. So, everything will hinge on what comes out of the White House as well as the reaction from our (former?) trading partners.
That said, unless there is more news over the weekend, it seems like a bounce is in order, but I don’t see a resumption of the bull market any time soon.
My Favorites from TheStreet Pro This Week
Enjoy these four articles that encapsulate much of the great thinking on Pro.
Doug Kass saw this coming. He's been bearish since before the start of the year and has been quite vocal about it. On April 3rd, as some investors were scrambling to sell out risky positions, Doug was reaping the fruits of his hard work.
Peter Tchir gave us a heads up Monday that he was cautious. He mentioned both best and worst case scenarios as well as a bottom line. And the bottom line was, caution.
Every good portfolio manager has to think several steps ahead and Chris Versace, Portfolio Manager for TheStreet Pro's Portfolio, always thinks ahead. On April 3rd, he laid out four scenarios for how the market might rebound.
And let's leave it with one that's sure to put an ear worm into your head.
Ed Ponsi reached back into his musical career to estimate a price that the S&P 500 might bounce at. Perhaps Ed's hair band inspired target price would have worked even better, if it weren't a Friday. People just wanted out.
One thing we can't say is that this week, we got up and nothing got us down.
