Let's Forget the 'We've Never Seen This Before' Stuff and Look a Little Deeper
Here's why you should be rooting for a market breather in this index-led rally. Plus, our Q&A is here today, with looks at four key charts.
You've reached your free article limit
You've read 0 of 1 free Pro articles.
There are all these statistics and charts being floated around about how this has been the fastest/biggest/whatever move from down to up in forever. And along with that comes the standard comparisons. I like a comparison just as much as anyone else, but can we stop and just discuss a few indicators?
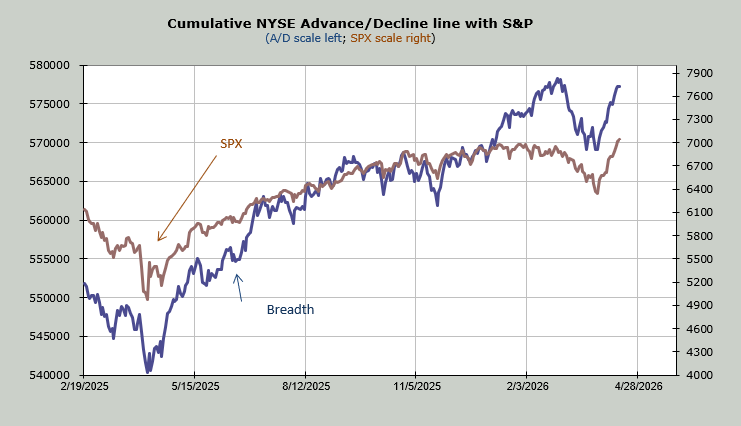
We are overbought short term. We have been that way since midweek. I have said I thought it would lead to some form of chop and/or pullback but that we would then rally again. So far we’re seeing a lot of chop — just notice how breadth is not keeping up with the S&P. It remains at a lower high.
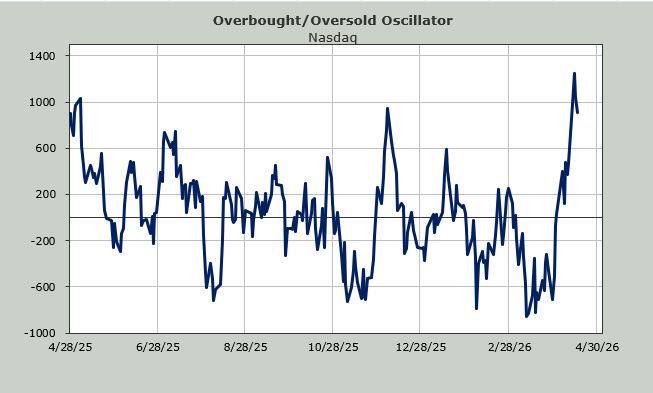
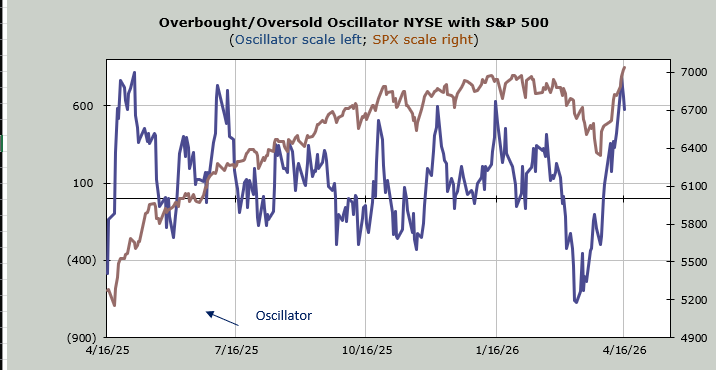
Or take a look at the Overbought/Oversold Oscillator. It has ticked down. If you are just watching the major market indexes, sure there seems to have been no slowing, but in stocks? There has been quite a bit of "catching your breath."
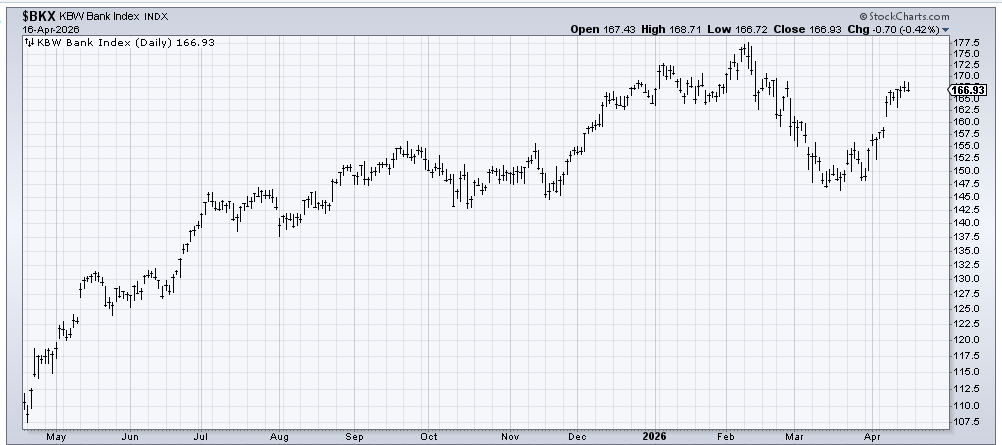
Just look at the all-important Bank Index. Doesn’t that look like a breather? Heck, it closed at the low of the day — and oh so slightly red — on Thursday. I look at a chart like this and if I had a bearish suit on I would say it looks like a failure at resistance. But the indicators — which for now are still supportive of the rally — say the chart should rally again.
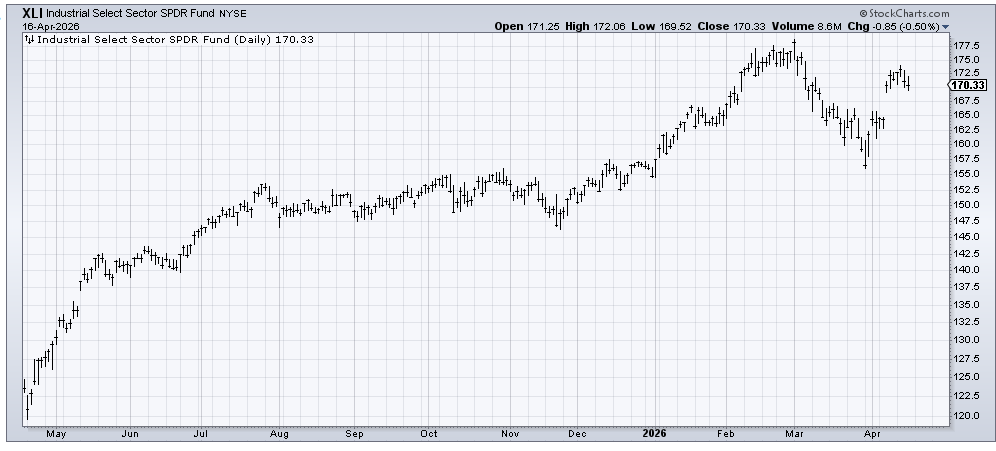
Or take a look at the industrials. Here too we’ve seen a whole lot of overbought-ness at work. This is the gap and sit I wrote about on Monday. And yes, it is sitting right at resistance. This, to me, is the overbought reading working. And it ought to rally again after the breather. The issue is if it doesn’t or if the subsequent rally can’t make any new headway.
I could go on. Perhaps it has been so long since we’ve had such an index-led rally that folks have forgotten what it’s like when the indexes keep going but there’s an awful lot of stocks and groups that sit it out.
So why do we want to see a breather? Breathers keep a Wall of Worry intact. I do think sentiment has changed drastically this week but I do not think we are at the point that everyone is back in the pool. We are getting closer, though.
Just look at the AAII bulls falling five points to 31.7% this week. Sure, I don’t think this is a great survey but as we noted a few days ago, the Investors Intelligence bulls (40%) are not extreme yet either, although I do expect to see them in the mid-40s by next week.
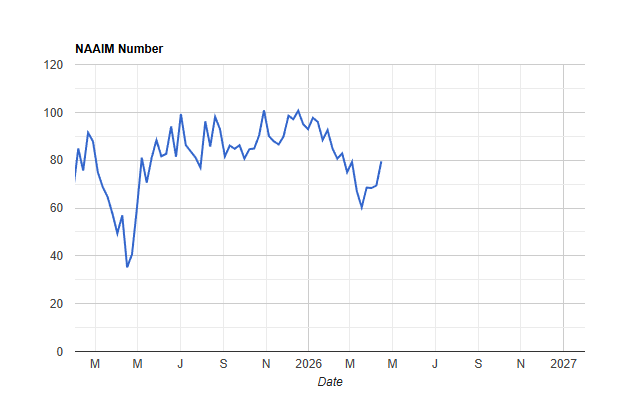
The NAAIM folks have increased their exposure, but they are not yet "on margin" (over 100) as their exposure sits at 79.
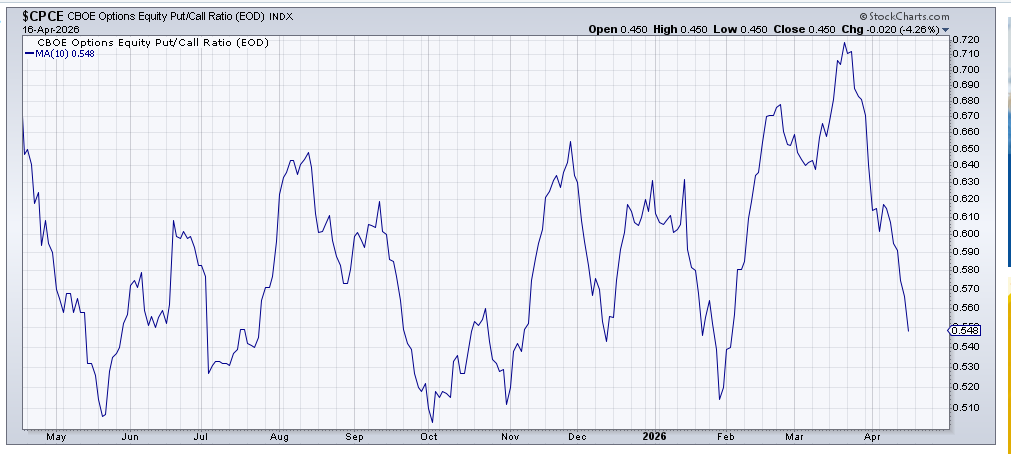
The put/call ratios, which tend to be an early hint to the more slow-moving weekly indicators, are telling a story of fast conversion from bears to bulls. The equity put/call ratio has been under 0.50 for the last two trading days (and was 0.50 on the third day) so the 10-day moving average has collapsed. It has gone from 0.72 to 0.58. When it gets to the low 50s I will consider it extreme.
The Nasdaq’s Daily Sentiment Index (DSI) is now 78. Recall three weeks ago it was 12. If the Nasdaq keeps on going this will get to the mid-80s by next week. And that would be the same as the equity put/call ratio getting to the low 50s.
If you want a market that continues on in a healthy manner, then you want a pullback because you don’t want these indicators to get extreme. You don’t want all those bears jumping the fence to the bull camp in a heartbeat.
I say forget about all those "we’ve never seen this before" statistics and watch to see if breadth can catch up and/or the sentiment tells us folks are "all in."
Q&A/Reader’s Feedback
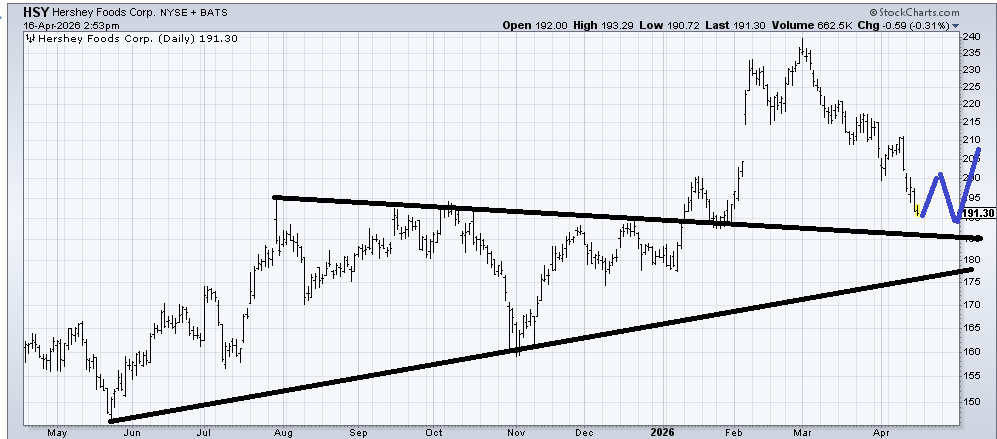
I turned sour on the staples a few months back and have not really warmed up to many (although I did like Pepsi (PEP) not long ago). Hershey (HSY) is definitely oversold and is coming into support. I would expect a bounce from this $185-190 area. As someone who prefers a "W" pattern, I would prefer if it bounces and then comes back down as I have drawn in blue. If it maps out like that I’d be a fan.
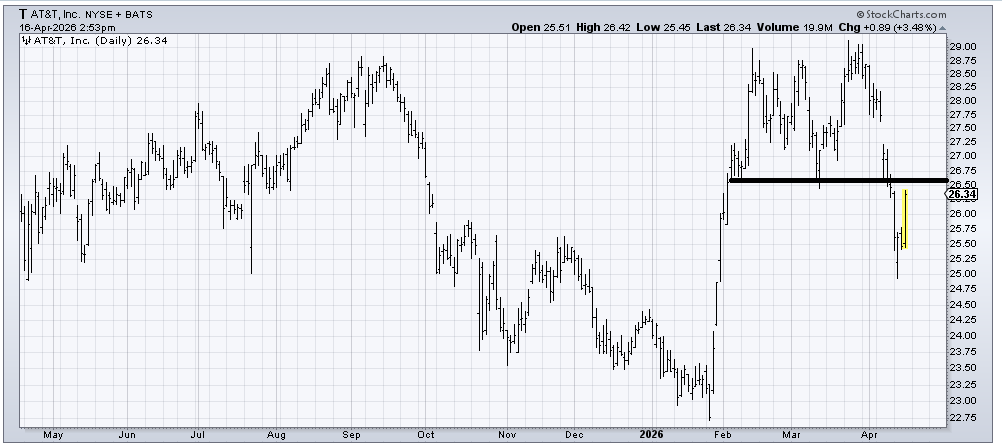
Once I said I thought Verizon (VZ) could rally the questions tumbled in on AT&T (T) . It’s not the same chart. AT&T has resistance in this $26.50 area. And then there is that gap to be filled at $27.75. Earnings are early next week but I would say if the stock can get over $26.50 then the gap fill is in play.
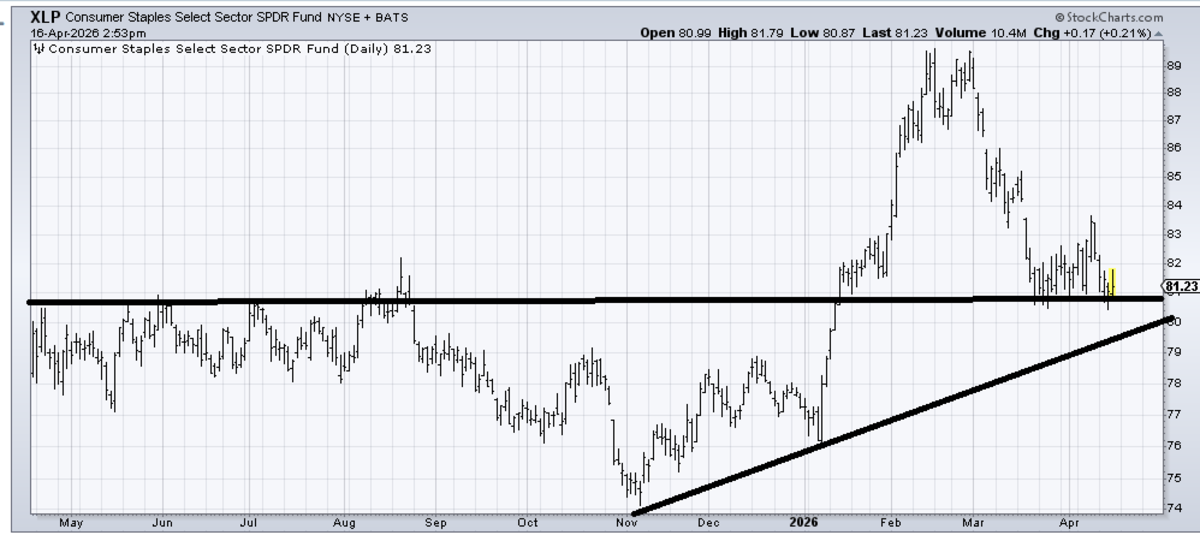
State Street Consumer Staples Select Sector SPDR ETF (XLP) has come down to support and it could be forming a small "W" pattern. I think it is worth a try with a stop under that uptrend line (around $79).
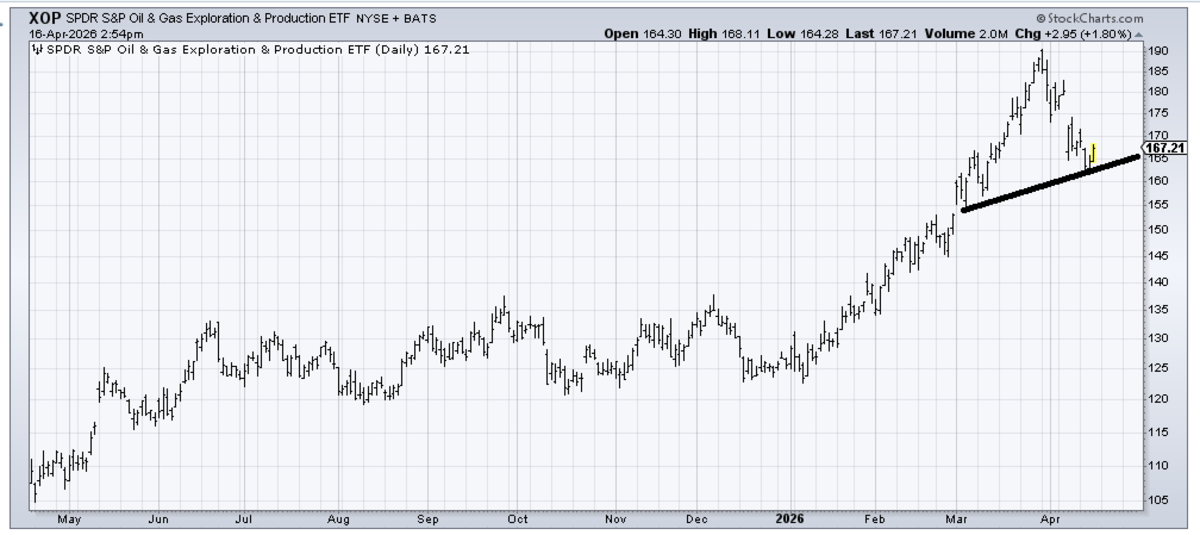
State Street SPDR S&P Oil & Gas Exploration & Production ETF (XOP) should bounce from here but I am still not ready to commit to the energy sector. Last fall I loved energy and now you can look at the chart and see why: it was basing. Right now it’s unclear to me. If it bounces and comes back down and tests that line with success I might be willing to hop back on the energy train.
Related: China’s Surprise Growth Shows Silence on Iran, U.S. Trade Can Be Golden
