Kicking Off September with Flat Indicators
Let's look at the breadth statistics to see what's happening with stocks.
You've reached your free article limit
You've read 0 of 1 free Pro articles.
Just prior to my vacation, I thought with the string of down days we were entitled to an up day, and we got one giant up day. I also thought that post said up day it was unlikely to change any of the indicators. And that is exactly what has happened.
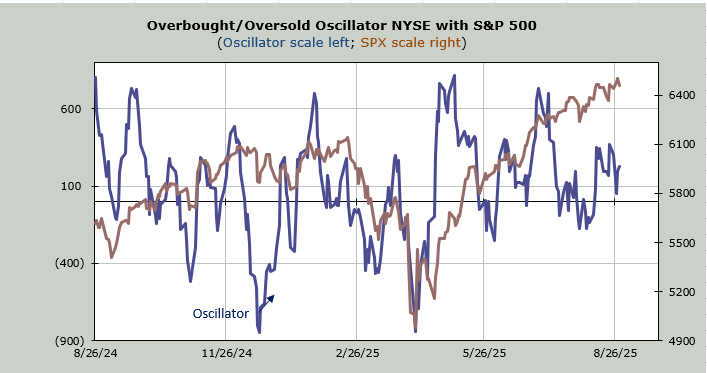
I’d love to report that there was a ton of follow-through from that big day that gave us a day with 90% of the volume on the upside, but I can’t. I’d love to report that the big up day has a terrific week of positive breadth readings, but in the end, last week saw breadth flat as a pancake, which is pretty similar to the S&P.
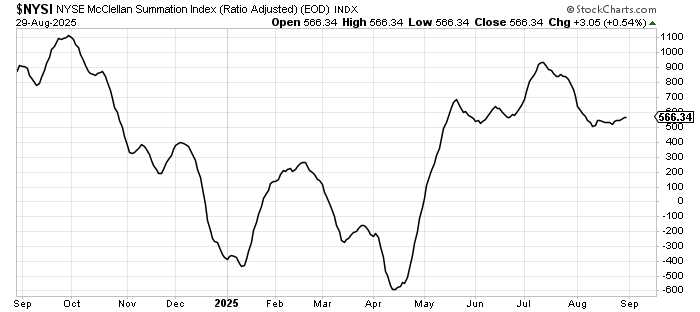
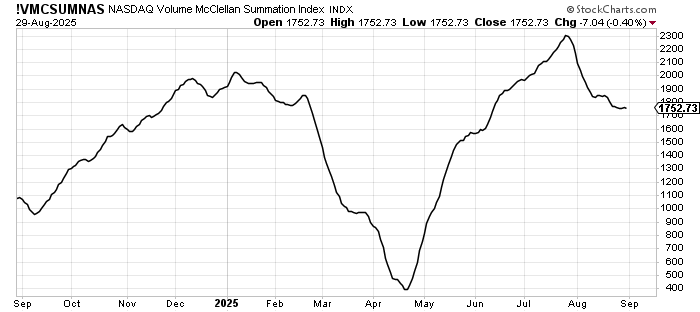
One of the most interesting aspects is that the McClellan Summation Index remains flat while the small caps have rallied. That is unusual.
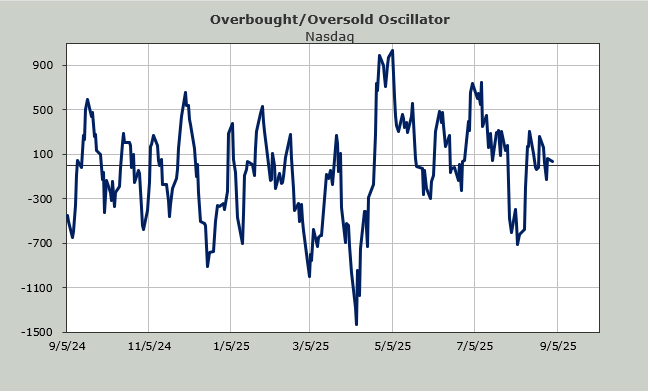
And it’s not just the NYSE, over on Nasdaq, where the index did not even bother to make a higher high, the Summation Index using Volume is still flat to down.
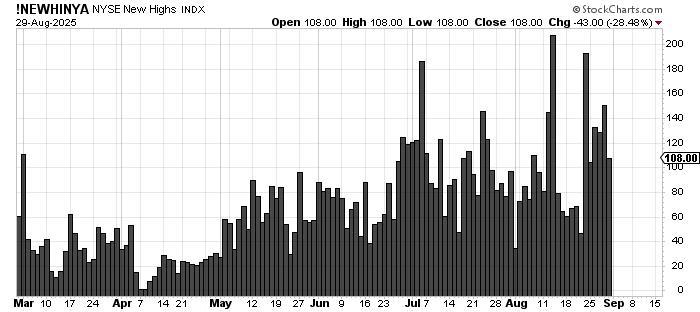
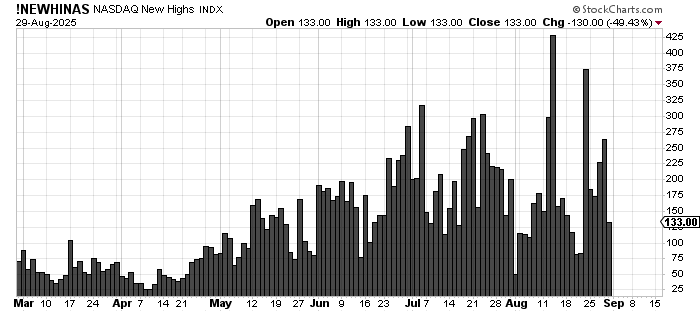
I saw lots of statistics being passed around regarding that big up day and how bullish it was (90% up days should be considered bullish), but do you realize that the number of stocks making new highs did not even surpass the prior high reading from about a week prior to that?
Yet banks did terrific and are no longer underperforming the S&P. The ratio of the Bank Index to the S&P has eked out a higher high, which means it is now the highest since the Silicon Valley Bank debacle in the spring of 2023.
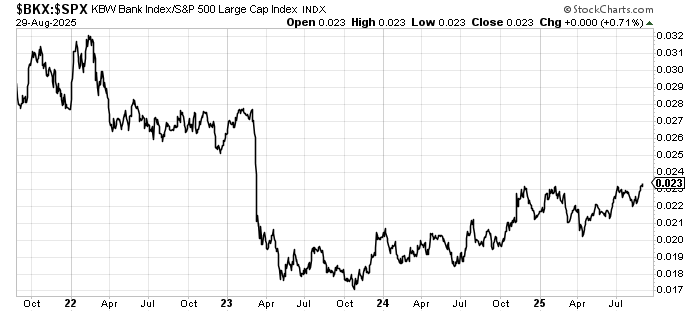
I do think banks are getting a bit overbought up here, but my longer-term target on the Bank Index is around 180 (currently 150). But it is the semis we need to get back to once again.
The SOX has gone nowhere in two months. Just a reminder I view semis and banks as leading groups, or they tend to be. Watch that 5400 area on the SOX. You might recall how I fussed over 4800 for months prior to the break in February. I will now focus on 5400 because that has been support for the last two months.
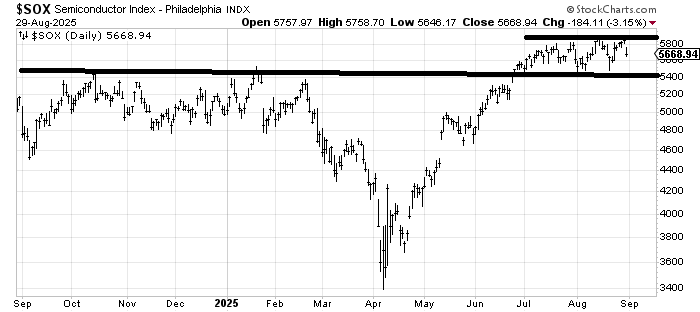
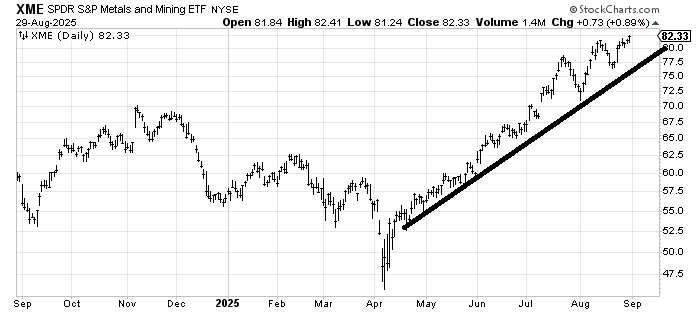
Now let’s turn our focus to attention to the group that gets so little attention yet has far outperformed the semis: metals and mining. The SOX had rallied (to the July high) about 40% from the April low. XME, an ETF to be long metals and mining stocks, has rallied 70%.
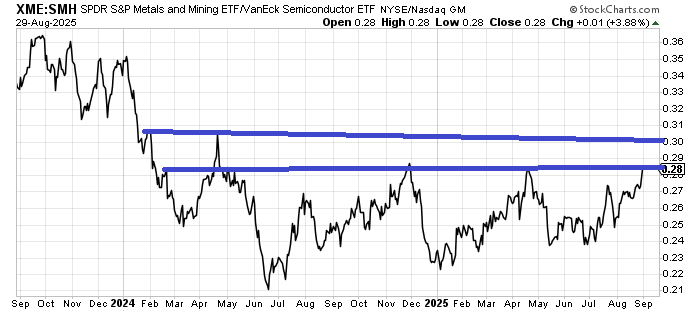
While I am unsure what we should say about a bull market being led by metal stocks, I do want to show you the relationship between the XME and the SMH because for the last 18 months, that ratio has stopped in this area every time it has gotten up here. But my eyes see a base building. Notice how it has made higher lows since the fall of 2024.
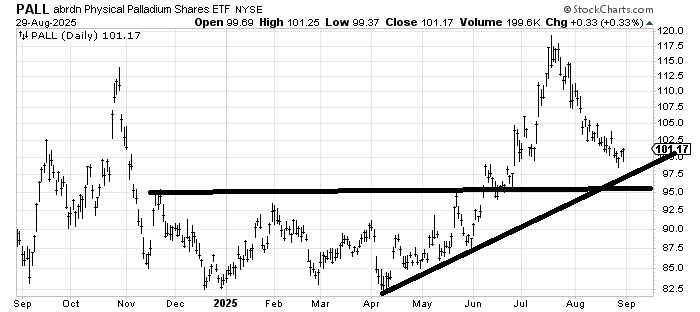
Take a look at my old friend PALL, an ETF to be long Palladium. It had that terrific run from that base and is now back down to testing that breakout. In any event, I still see very little change in the indicators, so the group rotation remains alive for the time being.