Kass: Like 53 Years Ago, January 2025 Could Represent an Epic Top for Stocks
Today's market, with the Magnificent Seven, resembles one in December 1972/January 1973 headlined by the Nifty Fifty. Here's what happened then and why that matters now.
You've reached your free article limit
You've read 0 of 1 free Pro articles.
With the 10-year Treasury yield reaching multi-month highs, my baseline expectation is that January 2025 could represent an important top in stocks — much like it did 53 years ago in 1972.
Here I present my rationale for the comparison as well as an investing lesson from Wally Deemer on "new eras"... and what comes after them!
Tuesday morning, bond yields continued their climb higher:
* The yield on the 2-year U.S. Treasury note is +2 basis points to 4.27%.
* The yield on the 10-year U.S. Treasury note is +3 basis points to 4.65%.
* The yield on the 30-year U.S. Treasury bond +3.5 basis points to 4.87%.
As the risk-free rate of return is a foundation to stock valuations and the equity risk premium has grown ever thinner — I plan to continue to steadily raise my short exposure as bonds defy and fail to endorse the rise in stocks.
As I wrote late Monday in my Daily Diary on TheStreet Pro:
I remain bearish on equities — in the belief that reward vs. risk is unattractive and, as equities continue their robust rally, returns are increasingly asymmetric.
As expressed previously in my Daily Diary, my theory has been that the December 2024/January 2025 market may resemble an important top similar to December 1972/January 1973.
In both periods, we faced a combative President (Nixon/Trump), narrow leadership (it was the Nifty Fifty in the early 1970s and the Magnificent Seven in recent years), interest rates and inflation turned up (from the prior few decades) and public sector debt was climbing rapidly. Like in 1972, we lack visibility today (and a sense of fiscal responsibility on the part of our political leaders with regard to future fiscal policy).
In both periods the forward P/E was extremely elevated (today, at 23x, in the 96%-tile), the market advance was not broadening out, the "animal spirits" took stock prices higher without a commensurate change in future profit forecasts and the equity risk premium was paper thin.
An epic market top was completed in January 1973 — leading to a poor year for the S&P Index, which marked the beginning of the end of the Nifty Fifty and several years of weak performance in the Indices.
I expect something similar to that this month (January 2025) — an important market top, a down year for the averages and marked by the beginning of the end of the Mag 7, which could extend multiple years.
I plan to expand my short exposure Tuesday if the modest strength in futures continues.
To emphasize my message, here is something special — an investing lesson which chronicles the demise of the Nifty Fifty as written in a memorandum at the end of the dot-com bubble — from my pal Wally Deemer who I worked with at Putnam almost 50 years ago during the end and demise of the Nifty Fifty era:
Walter Deemer's Special Report — March 3, 2000
Arrogance
Introduction
During my now 36-plus years in this business, I've never seen anything even remotely comparable to the current chasm in the stock market between New Economy and Old Economy stocks; the NASDAQ, which rose 85% in 1999, has risen another 16% so far this year while the Dow-Jones Industrial average (whose 30 components happen to earn more than all of the NASDAQ stocks combined do) was recently off more than 14%. But it is not the unprecedented market chasm that prompts this piece -- it is the accompanying arrogance on the part of all too many New Economy (aggressive growth) managers, as demonstrated in such things as the writings of James Cramer of TheStreet.com and the utterances of a seemingly-endless parade of hedge fund managers on CNBC. These managers sneeringly inform those unfortunate souls who are not invested in the same Cisco's and Qualcomm's as they are (or, more likely, in the same JDS's and Xcelera's as they are) that "Old Economy stocks are relics of the past; if you don't own the Cisco's and Qualcomm's of the world, no matter what their valuations may be, you're living and investing in the past, not the future. This is the way it is and this is the way it's going to be from now on." (The logic of the subset of managers who are well aware that this kind of thing can't last, but are cocky enough to think they can get out before the final whistle blows -- even though they readily admit that most players won't -- needs no further comment on my part.)
While the first part of the foregoing observation "this is the way it is" -- is clearly true, we vigorously disagree with the second part "this is the way it's going to be from now on". We are hardly about to quarrel with the idea that Cisco (to pick on what is on the verge of becoming the biggest company in the world in terms of market capitalization) is a better company than, say, Sears; quite obviously, it is. But investors are not buying Cisco, the company; investors are buying Cisco, the stock -- and what seems to be lost on the part of many of the aforementioned money managers in their "buy-the-New Economy" reasoning process is the fact that just because Cisco is a better company than Sears, Cisco is not automatically a better stock, too. Relative valuations must must also be considered.
The Case for 'New Economy' Stocks: We've Heard It Before
One of the biggest justifications the aforementioned money managers cite for owning the New Economy stocks -- at any price -- in lieu of everything else is the Fed's current stance on interest rates. Although higher short-term rates are almost a certainty, the New Economy stocks, their argument goes, are pretty well insulated from the Fed's harmful effects; it is really only the already-beleaguered Old Economy stocks that will be adversely impacted by them. Part of my problem with this line of reasoning, though, is that I've seen this movie before. And it doesn't end happily. Back in 1972-73, at the height of the Nifty Fifty era, one of the biggest justifications that was cited for buying big, high-quality growth stocks (at any price) was that those stocks were the ones that were the most insulated from the high interest rates and high inflation that were then ravaging the globe, and no price was too high to pay for the growth and safety they offered. I can still remember going into John Bennett's office one day at Putnam during the height of the Nifty Fifty era and asking him how he could justify our owning J&J at its then-grossly-inflated multiple. John puffed on his pipe, then responded: "If you look at their earnings out seven years from now, the stock's not really all that expensive." (John also counseled "In a bull market, rent a kid!", which turned out to be a rather prophetic comment as it regards the current investment climate.)
Now I will be the first to admit that conditions during the Nifty Fifty era were far, far different than they are now; in 1973, for example, inflation and interest rates were both in double digits. But the arrogance on the part of all too many money managers was disturbingly similar: "The Nifty Fifty stocks are the ones that will grow come what may, and are the ones that are most insulated from the interest-rate and inflationary pressures. The Nifty Fifty stocks are therefore the stocks you MUST own -- at any price". Relative valuations were not even considered. I well remember an incident at Putnam during the height of the Nifty Fifty era when the Putnam Advisory Company -- which was every bit as big a Nifty Fifty player as Morgan's Carl Hathaway (Hathaway just got all the media coverage) -- was bringing in new accounts almost daily. As a result, the advisory managers made frequent trips to the trading room to deliver a stack of buy tickets for their Core List stocks and a stack of sell tickets for the stocks they had inherited. One afternoon, John Maurice, a card-carrying contrarian and one of the best and most astute money managers I have ever worked with (he managed the Putnam Growth Fund) looked at the advisory manager who had just brought in the latest stack of buy and sell tickets, and said "Do you mind if I ask you something?"
"Sure."
"Do you ever wonder if U. S. Steel, which you're selling at five times earnings, might possibly be a better stock than Baxter, which you're buying at 50 times earnings?"
"No," came the instant reply. "We were sold to our new client as a growth stock manager, and a growth stock manager we shall be."
But -- the deeply-depressed U. S. Steel WAS a better stock to buy in 1973 than the immensely-exploited Baxter. Not only that: the money that came flooding into growth stock managers in 1973 and 1974 because of the sensational past performance of high-quality growth stocks departed just as quickly towards the end of that decade, due to the persistent underperformance of those very same growth stocks.
Investors have thus seen money forced out of value shops and into growth shops before. I know how the story ended in the mid-1970's -- and there is absolutely no question in my mind that the currently-still unfolding saga is going to end comparably at some point. The (unanswerable) question, of course, is just WHEN the pendulum will start swinging the other way (as well as what the force or forces will be that cause it to start to do so). It is probably a good idea for all of us, though, to keep in mind that no pendulum swings in the same direction forever, either in the physical world or on Wall Street.
Final note #1: The Nifty Fifty performance which crested in 1973-74 caused John Neff, so I am told, to come within one quarter of being fired at the time. Neff stuck to his style of investing, though, and his fund subsequently performed so well, and got so big, that it had to be closed to new investors 15 years later. Carl Hathaway's did not.
Final note #2: According to the February 21st issue of Pensions & Investments: "Growth stocks outperformed value stocks by 125 percentage points during the past 18 months, representing a 6.8 standard deviation or an event that should occur only once every 285 billion years, according to AXA Rosenberg." That's right; BILLION.
The 'Nifty Fifty' Top (1973-74)
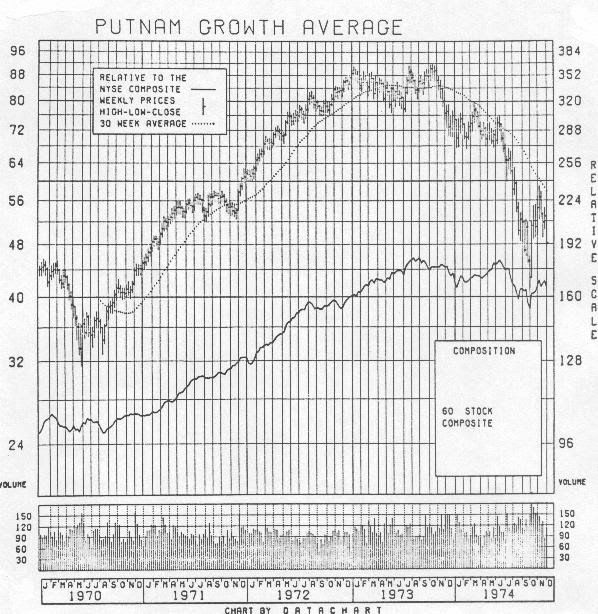
And just what did the Nifty Fifty look like back then? The chart on the next page is a weekly chart of the Putnam Growth Average from 1970 through the end of 1974, exactly as it appeared in one of my regular weekly reports at the time (the solid line on the chart, as well as on the other charts in this report, is a relative strength line). The Putnam Growth Average is thus not a "reconstructed" index of growth stocks -- it is the "Nifty Fifty" universe we were actually using back then. (There were, in fact, actually sixty stocks which met all three of our criteria for inclusion: 1) A billion-dollar market cap; 2) A five- year growth rate of at least 15%, and 3) Consistent earnings growth; no single quarterly earnings point could be more than 20% away from a least-squares line drawn through the past five years of quarterly earnings.)
As I said, conditions were completely different then than they are now, so I am not at all sure if we will see a top pattern anything like the Nifty Fifty one this time around. But that Nifty Fifty top is about all we have to go on, so we might as well take a look at it; as you can see, the price top took some ten months to develop, from January until October of 1973, while the top in relative strength was made during an eleven-month period, from August of 1973 through June of 1974. The conclusion, then, at least based on this one and only example, is that growth-stock tops are broad, drawn-out affairs.
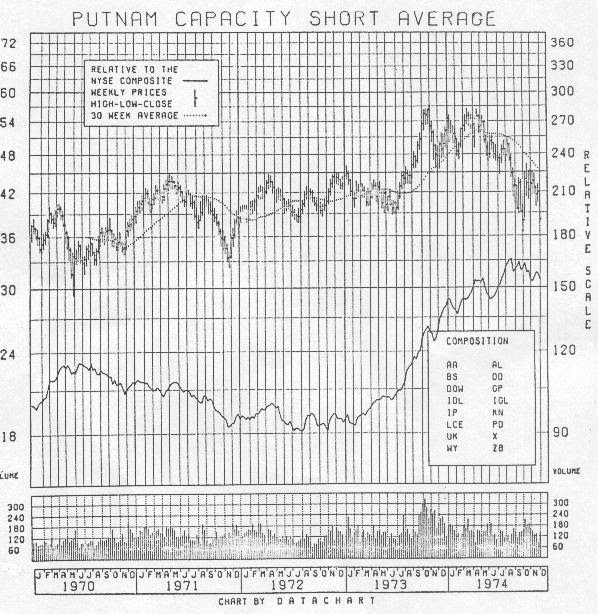
And what about value stocks in 1973; the U. S. Steel's that Putnam were dumping at five times earnings to buy Baxter at fifty times? We had an index called the "Putnam Capacity-Short Average" to track the basic industrial/commodity cyclical sector, which was as depressed an area as you could get in an already-depressed market (in an effort to draw attention to the stocks, we called it the Capacity-Short Average to highlight the fact that many basic industries were running out of excess capacity back then). This, too, is a "real-time" chart from the end of 1974; note its soaring relative strength line during 1973 and 1974 and the fact that the index itself barely broke its 1973 low in 1974 while the DJI was tailspinning from 800 to 580.
The Really Tragic Part of the Nifty Fifty Story
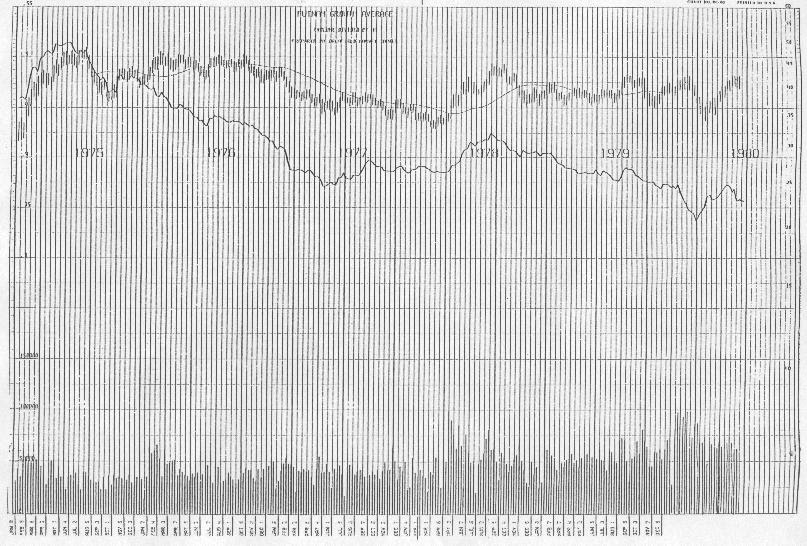
The really tragic part of the Nifty Fifty story, though, was not what happened to the stocks during the 1974 bear market. The really tragic part of the Nifty Fifty story was what happened to them in the months and years afterwards, as shown by the more recent (but still contemporary) chart of the Putnam Growth average, this one from 1980. As you can see, the stocks underperformed throughout 1975, 1976 and 1977, and, following a brief rally in 1978, the underperformance resurfaced and lingered on for another couple of years.
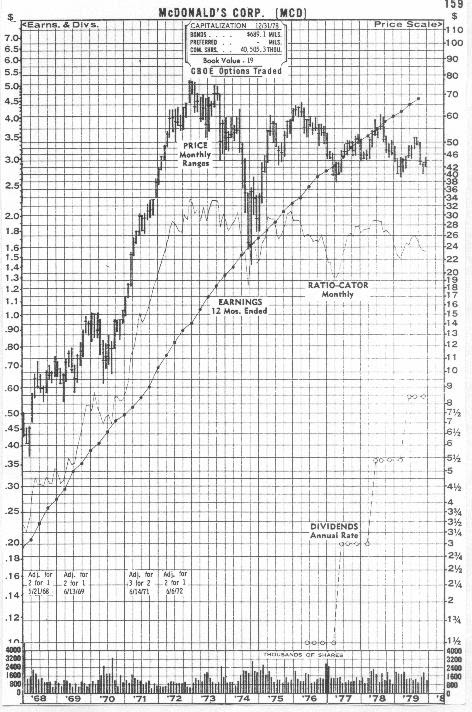
It was this long period of sustained underperformance that ruined growth stock managers and which set up the eventual bottom in growth stocks. The chart of McDonald's is classic (but by no means unique); the stock went from 75 to 40 from 1973 until 1979 -- without the company missing a single quarterly earnings number. Even more catastrophically, McDonald's P/E multiple went from 75 times trailing earnings in 1973 to less than 10 times earnings in 1979 despite the fact that the company maintained a 25% earnings growth rate, compounded, throughout the entire period.
(And just how widely was this underperformance predicted? Well, as part of out quarterly investment policy review at Putnam, I brought in leading advocates from both sides to make their cases, then let the money managers decide who was right. In 1975, though, I could only find one person who was willing to come in and tell us that growth stocks would underperform for a period of years Don Hahn.)
Conclusion
As I said at the outset, what prompted this piece is the arrogance on the part of all too many New Economy (growth) managers who sneeringly tell everyone who is not invested in the same Cisco's and Qualcomm's as they are that "this is the way it is and this is the way it's going to be from now on. The Old Economy stocks are relics of the past and if you don't own the Cisco's and Qualcomm's of the world, no matter what the price, you're living and investing in the past, not the future." Again: we are not about to quarrel with the idea that Cisco is a better company than, say, Sears; it is. But investors are not buying Cisco, the company -- investors are buying Cisco, the stock, and what seems to be lost on the part of many money managers is the fact that just because Cisco is a better company than Sears does not automatically make Cisco a better stock, too.
This commentary was orginally posted in Doug's Daily Diary on TheStreet Pro.
At the time of publication, Kass had no positions in any securities mentioned.
