Just When You Think the Sellers Are on Vacation, They Come Back
Friday was barely a down day, but the breadth was terrible.
You've reached your free article limit
You've read 0 of 1 free Pro articles.
Was it just Friday that I noted how it was starting to feel as if the market would never go down again, and then lo and behold, we get a down day. Oh, I know, Friday can barely be registered as a down day when the S&P is off by a mere 20 points.
However, in terms of breadth, it was not a great day with breadth at more than two to one on the downside. It hasn’t changed any of the indicators yet, though. The difference is that now, as we enter this week, there is a chance the indicators can change.
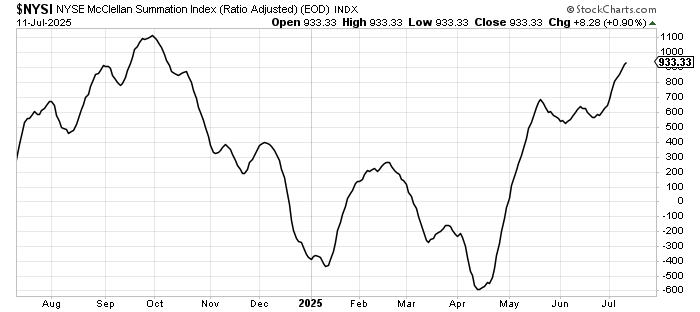
A week ago, we entered the week with the Daily Sentiment Indicator (DSI) for the S&P at 87. I said that was extreme (okay, truly extreme is over 90, but 87 is just touching the stove, not jumping right into the fire). But we also entered the week with breadth good and the McClellan Summation Index sporting a cushion of -2800 advancers minus decliners. This is what it would take to turn the indicator from up to down. I consider that a good cushion.
The reason I consider it a good cushion is that a few days of negative breadth won’t change the indicator; it can withstand a minor dip. We entered Friday with that number at -1700. Again, maybe not as good as Monday’s, but still not bad. It would still take at least two days of decent negative breadth to halt the rise and more to turn it down.
But now we enter this week with that number at -200. That’s not really even a cushion. In other words, it won’t take much to not only halt the rise but to turn it down.
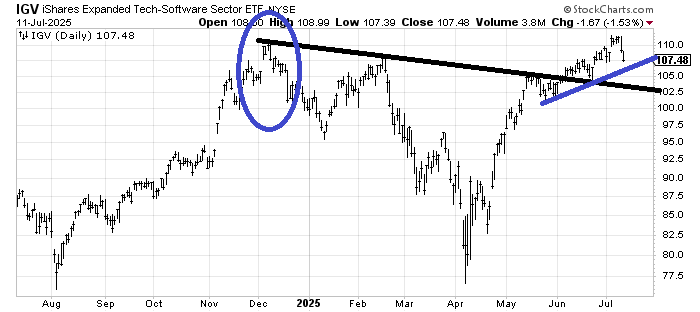
We talked about IGV, the ETF to be long software last week, and I noted the weakness. It did not bounce off that little gap fill at 109 Friday. In fact, it continued lower and closed at the low of the day. It did not break support, but keep that action from last December in mind (circled in blue) because the stops at support were just way stations.
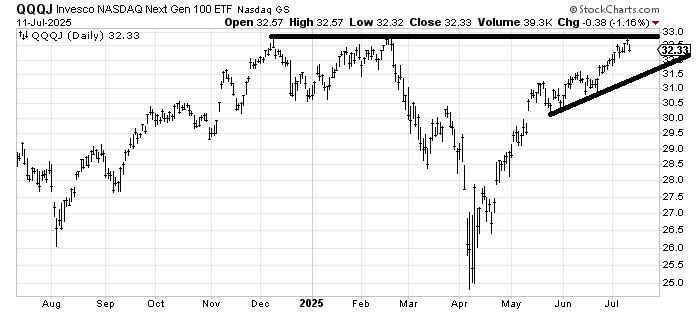
One of the charts that has been quite strong since mid-June is that of QQQJ. They call it the Next Gen QQQs. I call it the Juniors (J=Juniors). It’s basically the next 100 stocks that don’t get into the QQQs. It doesn’t trade much, but the chart is often quite telling because it encompasses all those smaller tech stocks.
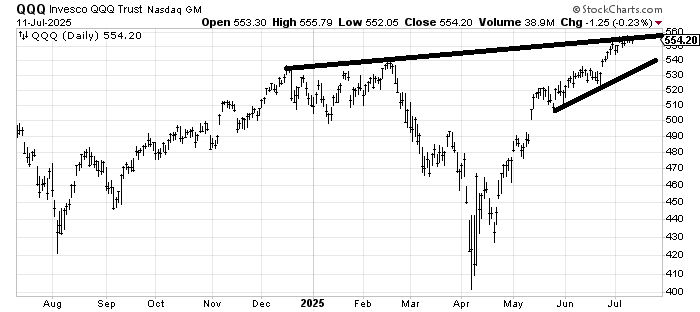
It did not make a higher high (vs December and February), and it took it on the chin Friday. Most likely, this is just a correction after a big run, perhaps back down to that small uptrend line, but it’s worth putting on your screen because this tech-heavy ETF has been an important tell at highs recently. Notice that it did not make a higher high in February, while the Seniors (QQQ) did.